


 Servicios personalizados
 Inglés (pdf)
 Articulo en XML
 Referencias del artículo
 Enviar articulo por email
 Citado por SciELO
  Similares en
SciELO
Similares en
SciELO 
 Permalink
Introduction
In the Brundtland Commission's publication “Our Common Future” (1987), the definition of sustainability was “sustainable development is a development that meets the needs of the present without compromising the ability of future generations to meet their own needs”. This definition of sustainability includes two key concepts: (1), the concept of needs, particularly the essential needs of the world's poor, which must be given absolute priority; and (2), the idea of the limitations imposed by the state of technology and social organization on the ability of the environment to meet present and future needs.
The 2030 Agenda for Sustainable Development is transformative, puts people's equality and dignity at the center, and calls for a change in the style of development that respects the environment. It is a universal commitment acquired by both developed and developing countries within the framework of a global alliance, which considers the means of implementation to carry out change and the prevention of disasters due to extreme natural events, as well as the mitigation and adaptation to climate change [1]. The Sustainable Development Goals (SDGs) are the heart of the 2030 Agenda, with a comprehensive, indivisible perspective and a renewed international collaboration. All the SDGs show an ambitious vision of sustainable development, integrating the economic, social, and environmental dimensions.
The SDGs are a planning and monitoring tool for all countries at the national and local levels. Their long-term vision supports each country's path toward sustainable, inclusive development in harmony with the environment through public policies and planning, budgeting, monitoring, and evaluation instruments [2]. The complex and interrelated problems of environment and development require a simultaneous analysis of the different dimensions of development processes. Therefore, new methods and tools are needed to analyze these processes and provide a comprehensive development vision. One of the new methodologies for this type of research is the analysis of the Sustainability Window (SuWi) [3, 4, 5, 6].
The Sustainability Window is a tool to assess the sustainability of development in its three dimensions simultaneously (environmental, economic, and social). The method provides information on the maximum and minimum economic development required to maintain the direction of social and environmental development towards more sustainable objectives. In this sense, SuWi's analysis is based on the approach of the Brundtland Commission. It allows for analyzing the dynamics of the sustainability of societies using different indicators and periods and can be easily used for comparative analysis. Furthermore, sustainability trends can be linked to different sustainability policies to analyze their effectiveness.
Sustainability Window can be used to analyze sustainability transitions in developing economies, for example, as explained by Geels et al. (2016) [7],, Loorbach (2002) (2007) [8], [9],, and Kemp et al. (2005) [10],. This article demonstrates the Sustainability Window approach with Cuban data. Cuba is a compelling case of analysis because, on the one hand, it has exemplary achievements in sectors such as education, as explained, for example, by Hanushek et al. (2012) [11], and in health, demonstrated, for example in Farouq (2019) [12], but on the other hand, it depends on the use of fossil fuels, as exemplified by Andersen et al. (2013) [13]. Based on the selected indicators, the Sustainability Window analysis indicates the minimum economic growth rate to improve social conditions and the maximum economic growth rates that do not exceed environmental development limits. However, the analysis here does not refer to the absolute level of sustainability (usually, this cannot be determined) but rather determines whether the direction of change is towards a more sustainable state. The method can also be used for the analysis of the absolute level of sustainability if it can be determined.
The Sustainability Window analysis results can be visualized with a quantitative approach if used in the analysis of the Doughnut Economy. According to Kate Raworth (2017) [14], “the environmental ceiling consists of nine planetary boundaries, as established by Rockstrom et al. (2009) [15], beyond which lie unacceptable environmental degradation and potential tipping points in Earth systems”. The twelve dimensions of the social foundation are derived from internationally agreed minimum social standards, as identified in the 2015 SDGs. Between the social and planetary boundaries lies an environmentally safe and socially just space where humanity can prosper. SuWi's analysis provides quantitative insights into these boundaries and economic development. The method provides a visual interpretation of the Doughnut and denotes where problem areas of unsustainable development exist.
Before the adoption of the SDGs, the World Wildlife Fund (WWF, https://wwf.panda.org/discover/knowledge_hub/all_publications/living_planet_report_timeline/lpr_2006/), in its 2006report on the progress of countries towards sustainable development, indicated that Cuba was the only country that met the conditions of sustainability based on the Human Development Index as a social indicator and the Ecological Footprint, which measures the number of natural resources used per capita [16].Cuba aspires to build a prosperous, sustainable, profoundly humanistic, and democratic socialist society, as expressed in the Constitution of the Republic of Cuba. National Assembly of People's Power (https://www.gacetaoficial.gob.cu/sites/default/files/goc-2019-ex5_0.pdf), despite the application and intensification of the US government's economic, commercial, and financial blockade policy for more than 60 years.
The blockade prevents Cuba from accessing financing from the main international financial institutions and maintains fierce financial persecution of those resources the country has been able to access. The blockade also prevents financial transactions derived from Cuba's foreign trade. This is the result of the application of Title III of the Helms-Burton Act, which reinforces the extraterritorial nature of the sanctions against Cuba (in general, on the impacts of US sanctions on poverty, see Neuenkirch et al. (2016) [17]).
Cuba's strategic purpose is the integral development of the human being with high values and ethical principles, fundamental to progressively consolidating the bases of new social relations. These elements are also reflected in several guiding documents of the nation, such as the Bases of the National Plan for Economic and Social Development to 2030: Vision of the Nation, Strategic Axes and Sectors (https://planipolis.iiep.unesco.org/sites/default/files/ressources/ultimo_pdf_32.pdf). These documents are decisive for the sustainability and prosperity of the Cuban nation, in broad coherence with the objectives and goals of the 2030 Agenda. The National Economic and Social Development Plan for 2030 (https://www.mep.gob.cu/es/documento/agenda-2030-para-el-desarrollo-sostenible-plan-nacional-de-desarrollo-economico-y-social), establishes six strategic axes. These are designed under a systemic approach, which articulates the economic and social development proposal and contributes from its area of influence to achieve that purpose in the long term.
According to the national plan of the 2030 Agenda for Cuba, economic, social, and environmental sustainability is associated with development. It requires growth rates and economic structures that ensure prosperity with social justice and equity in harmony with the environment, the rational use and preservation of natural resources, and the care and enrichment of the nation's heritage. Furthermore, the sustainable increase in production is seen as a fundamental premise to raise the level and quality of life gradually, the full realization of the human being and his individual, family, and collective project through a fair and equitable distribution of wealth, advancing in the eradication of social inequalities (https://sustainabledevelopment.un.org/content/documents/279522021_VNR_Report_Germany.pdf).
Methodology and data
The Sustainable Development Reports, where compliance by most countries in the world with the SDGs (figure 1), can be seen, Cuba appears in 40th place out of 163 countries, the second country in level of compliance in the Latin American region and the Caribbean.

Based on the conditions in Cuba, the analysis of the Sustainability Window is carried out to evaluate the country's development around three fundamental pillars of the Green Economy: (i) Low-carbon development, (ii) resource efficiency, and (iii) social inclusion. Different indicators have been used in the analysis to compare their ease of use and provide a broader view of the development of the Green Economy.
International organizations, research centers, and statistical offices have developed different sets of indicators of sustainability (see comparison by Schoenaker, Hoekstra & Smiths (2015) [19]). As a result, various indicators have been used in this research. The Sustainable Society Index (SSI) [20] (http://wikiprogress.org/data/dataset/datatables) has been the primarydata source for the analysis. In addition, statistical data from the UN (https://unstats.un.org/sdgs/metadata/), UNDP data such as the Human Development Index [21], IEA data [22], on energy and CO2 emissions, and UNESCO data [23], on education. Specifically, the SSI dataset integrates human, environmental, and economic well-being indicators to form a more comprehensive view of development.
The data used in the analysis covers 2006 - 2016, for which SSI data is available. In addition to the SSI database, a "social inclusion" indicator has been calculated to explicitly add this dimension to the analysis. This indicator is based on secondary education completion rate data, including urban/rural, female/male, and East/West dimensions. For the Sustainability Window analysis, all the indicators have been indexed to have the value 1 in the base year of the analysis, 2006. For the indexing, raw data from the SSI indicators have been used. The indicators used in the analysis are shown in table 1.The construction of the Sustainability Window (for more details on the method, see Luukkanen, et al. (2015) [4]), can be explained using a visual method.
The Sustainability Window is the space on the X-axis between the minimum sustainable economic growth (social sustainability) and the maximum sustainable economic growth (environmental sustainability). On the Y-axis are the variables that describe social development and environmental development. Different indicators approximate these variables. All the indicators used in the analysis -economic, social, and environmental-are indexed to have the value 1 in the base year.
The development of the variables is presented as a function of time in the XY graph; in this case, the values of the last year, 2016, of the indexed indicators are used for the analysis. It is also possible to analyze the development of the Sustainability Window as a function of time (see Luukkanen et al. (2015) [4]), called dynamic sustainability, which can be used for trend analysis and construction of future scenarios.
In figure 2, point A is the starting point of the development. This represents the index point for environmental stress (Env0) and economic development (GDP0). Line r1 indicates the environmental stress productivity of GDP in the base year. The environmental stress in the last year of analysis is Env1, and the corresponding GDP1is the economic development (point E), so line r2 represents the last year´s productivity. If the sustainability criterion is that environmental stress does not increase, then point F represents the maximum economic development, GDPmax, on line r2, to meet the sustainability criterion.
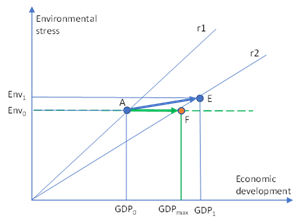
Fig. 2 Defining maximum economic development in the case where environmental stress is not increased
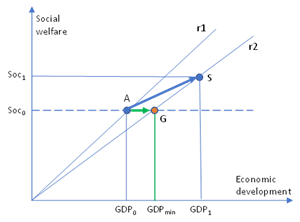
Figure 3, illustrates the procedure to determine the minimum economic development to fulfill the social sustainability criterion. In this figure, point A represents the starting point for analysis, having Soc0 as the social welfare production and GDP0 as the economic development, and line r1 represents the social welfare productivity (for the productivity of different components, see,e.g.,Tamura et al. (2019) [24]). The final year of analysis is indicated with point S with social welfare Soc1 and GDP1, and the social welfare productivity is indicated with line r2. The sustainability criterion is that the social welfare should not decrease, which means that point G on line r2 represents the minimum economic development, GDPmin, to fulfill the sustainability criterion.
When the previous cases of environmental and social sustainability analyses are combined, we can define the minimum and maximum economic development to fulfill social and environmental sustainability criteria, the definition for the Sustainability Window.
In figure 4, the Sustainability Window is presented by combining the previous analyses. In this figure, the environmental stress productivity line r2 determines the maximum economic development GDPmax and the social welfare productivity line r3 the minimum economic development GDPmin to fulfill both sustainability criteria.
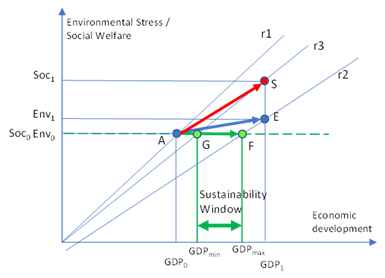
Fig.4 Defining Sustainability Window with maximum economic development GDPmax to fulfill environmental sustainability criterion and minimum economic development GDPmin to fulfill social sustainability criterion
In the case of Cuba, the example of analysis of the SustainabilityWindow has been carried out using GHG emissions (environmental dimension of low-carbon development) and years of healthy life (social dimension of social welfare) in the context of economic development (GDP). The decisive criterion for environmental sustainability is defined when GHG emissions are not growing (see discussion on strong sustainability in Vehmas et al. (2007), [25] and Kaivo-oja et al. (2014 a, b) [26-27]). In this analysis, we also utilize the weak sustainability criterion for CO2 emissions, which states that the emissions produced per GDP should not increase. The weak sustainability criterion can be used in this case because Cuba's CO2 emissions per capita arevery low. On the other hand, the criterion for social sustainability in this analysis is that the “Healthy life years” should increase.
The indexed “Healthy life years”are indicated in figure 5, with the blue line for 2006 - 2016, between points A and B. Indexed GHG emissions divided by GDP (weak sustainability) are indicated with the orange line for the same period, between A and E. Line r1 indicates the indexed GDP productivity for the “Healthy life years” (how much indexed healthy life years are produced per unit of GDP) and for GHG emissions (how much GHG emissions are produced per unit of GDP) for the reference year 2006. Line r2 indicates the “Healthy life years” productivity of GDP in 2016, and line r3 indicates the GHG productivity of GDP in 2016.
To achieve social sustainability in 2016 concerning 2006, the ‘Healthy life years’ should not decrease (development towards a more sustainable direction). With r2 productivity, the minimum GDP to have the same level of ‘Healthy life years’ (point C) is marked with GDPmin. This determines the minimum level of economic output to prevent a decrease in healthy life years. Therefore, the analysis determines the lower limit of the Sustainability Window, GDPmin. Concerning environmental sustainability, line r3 determines the maximum GDP to keep the growth of GHG/GDP below the value of the reference year (development towards a more sustainable direction). At point D in the figure, the weak environmental sustainability criterion is fulfilled,which determines the upper limit, the maximum economic growth, GDPmax, for the Sustainability Window.
In this practical case, Cuban economic development seems to be within the Sustainability Window for 2006 - 2016. Therefore, according to the analysis, the maximum sustainable economic growth (GDPmax) could have been about 15 % higher between 2006 and 2016 than the real economic growth (GDPreal) (the difference between D and E in figure 5).Another example of Cuban development is illustrated in figure 6. In this example, we use “Social inclusion” as the indicator for social welfare and “Consumption of global hectares” as the indicator for environmental stress. The environmental indicator is now used for analyzing strong sustainability, referring to the absolute value of the consumption of global hectares. The environmental indicator, “Consumption of global hectares”, is taken from the SSI database. The development of the indicators is shown in figure 6, from 2006 to 2016. With these indicators, the real GDP development in Cuba is within the Sustainability Window.

Fig. 5 Weak Sustainability Window for Cuba using “Healthy life years” (blue line) as a social indicator, “GHG intensity of GDP” (GHG/GDP) (orange line) as the environmental indicator (weak sustainability), and GDP as the economic indicator. “Healthy life years” productivity of GDP (line r2) determines the minimum economic growth (GDPmin) to fulfill the social sustainability criterion (“Healthy life years” should not decrease) in point C. The “GHG intensity of GDP” should not increase, and the line r3 (GDP productivity of the intensity) determines the maximum GDP growth (GDPmax) in point D in order not to increase productivity. The real GDP growth (points B and E) is within the Weak Sustainability Window (GDPmin<GDPreal<GDPmax)
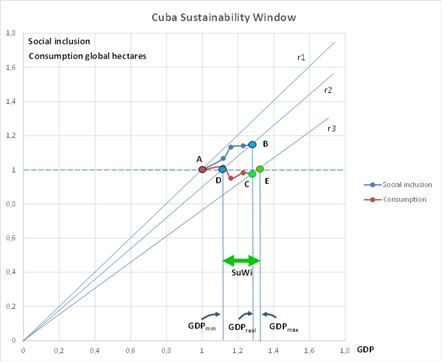
Fig. 6 The sustainability window (Strong sustainability) for Cuba uses ‘Social inclusion’ as the social welfare indicator (blue line) and ‘Consumption of global hectares’ as the environmental stress indicator (red line), and GDP as the economic indicator. All the indicators are indexed (point A), and their evolution until 2016 is indicated by the blue line (up to point B) and the red line (up to point C). Social inclusion productivity (line r2) in 2016 determines the minimum economic development (GDPmin, point D) not to decrease social welfare. In 2016, line r3, consumption productivity determined the maximum economic development (GDPmax, point E) not to increase environmental stress. In this case, the real GDP development in 2016 is within the Sustainability Window (GDPmin<GDPreal<GDPmax)
Results
Similar Sustainability Window analyses have been conducted using several SSI and other database indicators. When the pairwise results, the quantified “Sustainability Window”, of all the social and environmental indicators pairs are arranged in a radial diagram, we can visualize sustainability in a doughnut form.
In this analysis, we have used the following indicators, listed in table 1, to illustrate the method:
Table 1 Indicators used in the construction of the doughnut model for Cuban development
| Social indicators | Environmental indicators | Economic | ||
|---|---|---|---|---|
| Food | Sufficient Food | Forest | Biodiversity forest area | GDP |
| Drink | Sufficient to Drink | Conservation | Biodiversity protected area | |
| Edu | Education | Water | Renewable Water Resources | |
| HLY | Healthy life years | Consu | Consumption of global hectares | |
| Gend | Gender equality | Energy | Energy use | |
| Inc | Income distribution | Intens | Energy savings | |
| Emp | Employment | CO2 | Greenhouse gases | |
| Socinc | Social inclusion | Ren energy | Renewable energy | |
| HDI | Human Development Index | Organic | Organic farming | |
| EduPT | Education Pupil-Teacher ratio | Sanitation | Safe sanitation | |
The weak sustainability doughnut model for Cuba (figure 7), shows that the weak environmental sustainability criteria are fulfilled when the selected indicators are used. But, unfortunately, this means the real GDP growth has been lower than the maximum sustainable GDP growth defined by the environmental sustainability criteria (environmental stress productivity should not increase). This can be seen in figure 7, where the red line indicating real GDP growth is within the blue line indicating maximum economic development. Social sustainability, indicated by the green line in figure 7, is usually fulfilled. This means the real GDP growth has been significant enough to improve social welfare measured with the chosen indicators. In the case of “Education” and “Income distribution”, the social sustainability criteria are not fulfilled.
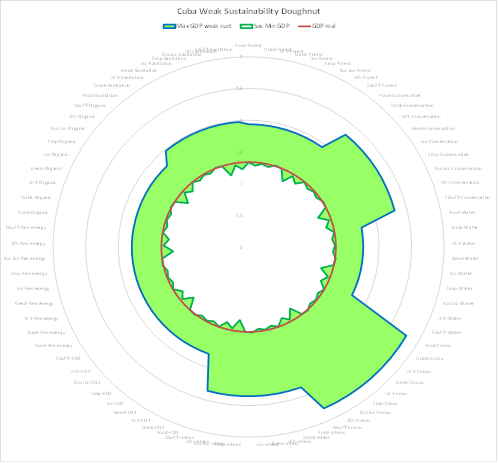
Fig.7 Doughnut model for weak sustainability analysis of Cuban development in 2006-2016. The blue line indicates the maximum economic development to fulfill the environmental sustainability criteria, and the green line indicates the minimum economic development to fulfill the social sustainability criteria. The red line indicates the real GDP growth level during the analyzed period. Green area, sustainability doughnut illustrates the possible area for sustainable development.
In the case of “Education”, the statistics used for the SSI database may not provide a correct view of the development because of the differences in the definition and statistics of secondary education in different countries. Also, the statistics describing ‘Income distribution’ in Cuba may not be reliable because of the changes in the economic structure, the increase in the share of private economic actors, and the coverage of the statistics. However, social sustainability criteria are fulfilled regarding the other indicators of social welfare development.
The strong sustainability doughnut (figure 8), indicates that Cuba has problems fulfilling all the sustainability criteria. Economic growth is within the sustainability criteria regarding “Consumption of global hectares”, “Biodiversity”, “Protected areas”, "Biodiversity, forest area”, and "Sanitation" and on the edge of sustainability regarding “CO2 emissions” and “Renewable energy”. On the other hand, the decisive sustainability criteria are not met regarding “Renewable water”, “Energy intensity”, “Energy use” and “Organic farming”. The environmental stress productivity has not decreased fast enough regarding these indicators to allow the amount of economic growth that has taken place. The other interpretation is that economic growth should have been slower to reach sustainability. The social sustainability criteria are in this analysis the same as in the weak sustainability analysis.
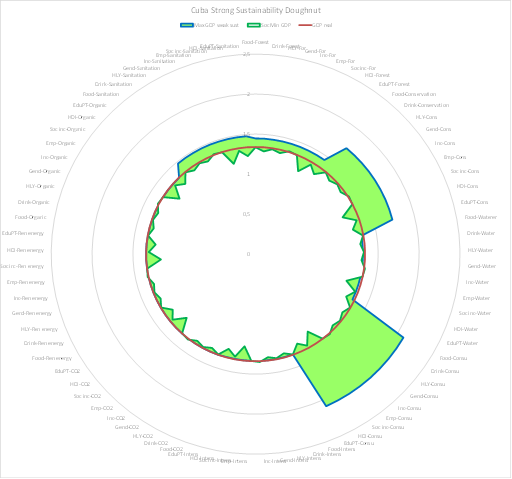
Fig. 8 Doughnut model for strong sustainability (absolute reduction in environmental stress) analysis of Cuban development in 2006-2016. The blue line indicates the maximum economic development to fulfill the solid environmental sustainability criteria, and the green line indicates the minimum economic development to fulfill the social sustainability criteria. The red line indicates the real GDP growth level during the analyzed period. Green area, sustainability doughnut illustrates the possible area for sustainable development
Conclusions
Sustainability Window (SuWi) method provides a novel approach for analyzing sustainability simultaneously in social, environmental, and economic dimensions in a quantitative way. The simultaneous analysis in different dimensions provides possibilities for comprehensive analyses where the interactions between different sectoral developments are revealed, and the problematic areas can be detected. This makes it possible to consider the policy responses in sectors of the economy and direct interventions in the areas most urgently needed. Furthermore, simultaneously analyzing development in different policy areas can lead to more balanced policies and timely actions compared to one-sector analyses.
The developed quantitative illustration of the doughnut economy provides a new visualization. It clearly illustrates the problematic areas of development and can be utilized to communicate the complex development problem. The visualization is crucial when policy planning includes actors from different areas and backgrounds to receive feedback from larger stakeholder groups.For the analysis, the use of absolute versus relative sustainability is essential. In many cases, it is impossible to determine whether absolute environmental stress levels are sustainable. In this way, the use of relative sustainability as a basis of the analysis is motivated. The direction of change towards a more sustainable state can be used as a criterion for many indicators where the absolute level of sustainability cannot be determined. It is possible to utilize absolute levels of sustainability in the SuWi analysis by placing the target at the reference level and not the base year level and determining Sustainability Window accordingly.
The SuWi method and the related doughnut economy analysis can be utilized for comparative analyses of different countries. It can also be used for provincial or local level analysis if suitable indicator sets are available. The quality of the indicators is naturally crucial for the reliability of the analysis results. Indicator sets, including the different dimensions of the development, social, environmental, and economic, are needed for a comprehensive analysis to reveal potential trouble areas where policy actions should be directed.
The availability of the indicator sets and time-series data for different countries, areas, and sectors is vital for future policy planning, and the work on the UN Sustainable Development Goals indicators is of enormous importance in this respect.The advanced SuWi method and the doughnut model can be used to analyzedevelopment dynamics. The changes in the width of the Sustainability Window as a time function provide trend analysis information. This can function as a basis for scenario construction and future policy planning. The gap analysis (see Luukkanen et al. (2018) [28]), provides information on the areas where efficiency development is needed. This is relevant for policy planning and illustrates the magnitude of actions required.
Our analyses of the Cuban case illustrate the usefulness of the developed approach. Weak sustainability, meaning that the intensity of environmental stress is not increasing, is achieved in Cuban development in the dimensions measured with the indicators. The robust sustainability criteria (absolute reductions of emissions) are; however, not all achieved. The criteria are too strict for many developing countries where the environmental stress measured,such as CO2 emissions or energy use, is still very low. The social development in Cuba seems sustainable concerning most of the used indicators. However, the social indicators are often not so easily measured, and in this respect, relative sustainability, development towards a more sustainable direction, is a preferable option.

