SciELO - Scientific Electronic Library Online

 
vol.44 número2Análisis de la utilización de tubos de aluminio para riego como ducto eléctrico para una instalación soterradaAnálisis empírico de resiliencia de las fuentes energéticas de la economía cubana entre los años 1971-2050 utilizando HHI y LKI índice de autoresíndice de materiabúsqueda de artículos
Home Pagelista alfabética de revistas  

Servicios Personalizados

Articulo

Indicadores

  • No hay articulos citadosCitado por SciELO

Links relacionados

  • No hay articulos similaresSimilares en SciELO

Compartir


Ingeniería Energética

versión On-line ISSN 1815-5901

Energética vol.44 no.2 La Habana mayo.-ago. 2023  Epub 02-Ago-2023


Artículo de investigación científica y tecnológica

Diversity and resilience of the Cuban economy. Commercial portfolio analysis based on the HHI and LKI

Diversidad y resiliencia de la economía cubana. Análisis de la cartera comercial en base a los índices de HH y LK

0000-0002-2401-6299Jari Roy LeeKaivo-ojaI  *  , 0000-0002-1540-3895Jarmo VehmasI  , 0000-0002-2893-824XAnaely SaundersI  , 0000-0003-0223-9827Jyrki LuukkanenI 

I University of Turku, Finland Futures Research Centre. Finland

RESUMEN

This empirical article analyzes the commercial exchange portfolio of the Cuban economy by studying the data on Cuban foreign trade activities. It combines measures from the Herfindahl-Hirschman Index (HHI) and the Lauraéus-Kaivo-oja Index (LKI) to identify key changes and trends in the export and import patterns of trade relationships at the country level. The article shows the results and key findings of the index-based analyses, as well as the export and import structures of the Cuban economy and trade. Especially this type of analysis provides a good knowledge base for smart specialization strategies of the Cuban economy. The results indicate that export-driven strategies need re-assessment from a resilience perspective. A more diversified export portfolio would be a smarter solution than the current export portfolio concentration rate. In the case of the import strategy, a re-assessment is not needed because Cuba's import portfolio is already highly diversified.

Key words: Resilience; smart specialization strategy; export; import; concentration; portfolio; diversification; Herfindahl Hirschman Index; Lauréaus-Kaivo-oja Index

ABSTRACT

Este artículo empírico analiza la cartera de intercambio comercial de la economía cubana a partir del estudio de los datos sobre las actividades del comercio exterior cubano. Combina medidas del Índice Herfindahl - Hirschman (HHI) y el Índice Lauraéus - Kaivo-oja (LKI) para identificar cambios y tendencias clave en los patrones de exportación e importación de las relaciones comerciales a nivel de país. El artículo muestra los resultados y hallazgos clave de los análisis basados en índices, así como las estructuras de exportación e importación de la economía y el comercio cubanos. Especialmente este tipo de análisis proporciona una buena base de conocimiento para las estrategias de especialización inteligente de la economía cubana. Los resultados indican que las estrategias impulsadas por las exportaciones necesitan una nueva evaluación desde una perspectiva de resiliencia. Una cartera de exportaciones más diversificada sería una solución más inteligente que la actual tasa de concentración de la cartera de exportaciones. En el caso de la estrategia de importación, no es necesaria una reevaluación porque la cartera de importaciones de Cuba ya está muy diversificada.

Palabras-clave: Resiliencia; estrategia de especialización inteligente; exportación; importación; concentración; cartera; diversificación; Índice Herfindahl Hirschman; Índice Lauréaus-Kaivo-oja

Introduction

In this study, we focus our analyses on the central question of economic resilience and smart specialization strategy. Examining the dynamics of a country’s innovation and economic growth dynamics, the authors like Frenken, et al. [1], point out that the diversity of sectors in different regions is important and the strength of the links between the elements of that diversity. Organizations compete by expanding their knowledge areas and ability to use more components of the knowledge space and industrial production.

This means that diversification promotes the diversity of innovative activities and the creation of new radical innovations through cooperation between different sectors of the economy. This kind of aspect is highly relevant to the Cuban economy and society. The ongoing global digitalization and globalization open up new opportunities to identify the strengths and priorities of economic and scientific-technological development in countries and regions. Nowadays, this is done through research on smart specialization strategies (S3). Also, the sustainability of smart specialization strategies is gaining more attention nowadays (S4), especially in the European Union.

One such direction is determining the level of specialization of the country’s economic sectors, i.e., industry [2, 3, 4, 5, 6]. In essence, they are inseparable from analyzing the industry's structure. These methodologies have always been given significant attention in the scientific literature [7, 8, 9]. This fact was caused by the changing situation in trade relations ‒ changes in the degree of concentration of economic operators and states, the conditions of entering global markets, growth in the range of production, change in the degree of integration and diversification of enterprises, and also, finally in export and import strategies [10, 11, 12, 13].

Methodology of the study shortly

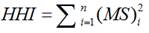
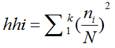
Being a commonly accepted measurement of market concentration, the HHI measures the ratio of firm size to the industry size as a proxy for the degree of competition among them (Herfindahl 1950, Hirschman 1964, Adams 2017). As noted above, the HHI index is defined as the total squared market shares of all firms within the industries at stake. The result of this exercise may range from 0.0 to 1.0, thus spanning a continuum ranging from the prevalence of a considerable number of tiny firms to a situation defined by only a monopolistic firm. HHI increases are typically understood as indicators of decreases in competition and increases in market power [14, 15, 16, 17]. One key advantage of the HHI vis-à-vis the C.R is that the former gives more weight to larger firms as it accounts for relative firm size distributions in each market. In fact, the former’s calculation differs from the latter’s insofar as an equation (1), for determining the HHI is as follows [18]:

(1)

Full background reviews of HHI analyses can be found in [19]. Data is collected fromthe OEC database (https://oec.world/en/profile/country/cub). Again, we find that the HHI is calculated by squaring each firm's market share and then totaling up the resulting numbers. The original reason why Lauraéus and Kaivo-oja [20], started their further development of the HHI is that this indicator does not account for size differences among the analyzed categories. At the same time, the authors concluded there to be good reasons for avoiding such potential calculational biases. The so-called S3 methodology includes many special methods and planning tools. Comparative advantage, resilience level, and innovation potential are typically measured [21, 22, 23, 24, 25, 26, 27, 28].

The new methodology for export and import portfolio analysis: Expanding the HHI toward the LKI

In the HHI, the Lauraéus-Kaivo-oja Index (LKI) is based on the subsequently outlined reasoning. First, Lauraéus and Kaivo-oja [19], support the argument shown in equation (2):

(2)

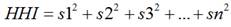
Which can be written using the mathematic equation (3):

(3)

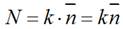
Where by The sample size is = N, The count of different categories in the sample = k, and The average value of the sample classes = .

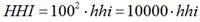
Yet, there is a way to remove the “1002”-part of the equation, as we can replace percentages with the decimals of 0.01-0.99, corresponding to 1-99%. Thus, we also avoid calculational problems related to values 0-10000, which are less intuitive than percentage values. Thus, we may create the index hhi, which means the HHI index (see equation (4)), without 1002.

(4)

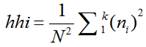
As we take out the 1002 out of the equation, have replaced the HII with the “hhi”, whose equation (5) is:

(5)

Which is equal (see equation (6)) to:

(6)

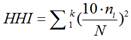
Yet, as the total quantity of the sample is = N, which is equal to the number of different classes in the sample, the total sum in the sample classes may be expressed as follows (equation (7)):

(7)

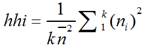
Consequently, we may argue that if the “hhi” may be expressed as shown in equation (8):

(8)

Then it may also be represented as equation (9):

(9)

Whereby refers to 1 over k numbers of categories within the sample. Yet, the issue is that this might generate a distorted analysis of key trends as if one has different numbers of categories in one’s sample, then one is incapable of comparing these categories with one another, for otherwise, it will distort the analysis [20]. Take the example of a sample consisting of 34 categories of goods and 11 categories of services .

In this case, the fewer the classes, the bigger the percentage added to the “hhi” index. Thus, why such percentages should be added to an index arises. If all numbers of the samples are in one class, then . Thus, one may safely remove and retain a more informative and pertinent trend curve [20].

The Lauraéus-Kaivo-oja Index (LKI)can be represented with the equation (10):

(10)

If the maximal diaconal standard deviation is correctly expressed as , then the divisor must be (k-1).

Thus, appears to be the wrong divider, whereas the right one seems to be (k-1) n2.

Thus, the new novel LKI indicator must be as shown in the equation (11):
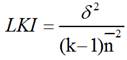
(11)

The LKI index is the square of standard deviation over the completely divided square of standard deviation (see [20]). The next section reports key results based on the HHI and the novel LKI indicators.

Results of HHI and LKI analyses

In this section, we report some key findings of our analysis. We have performed data analyses of export and import in Lithuania. First, we report the Herfindahl-Hirschman Index analysis of the Lithuanian export and import data. This analysis is based on the OEC database (https://oec.world/en/profile/country/cub). The Data pool covers 24 countries’ export and import data of the Cuban economy. It gives a robust picture of recent economic activities in the Cuban economy. In figure 1, we can observe trends in the structure of the export portfolio, and in figure 2, we see the import portfolio.

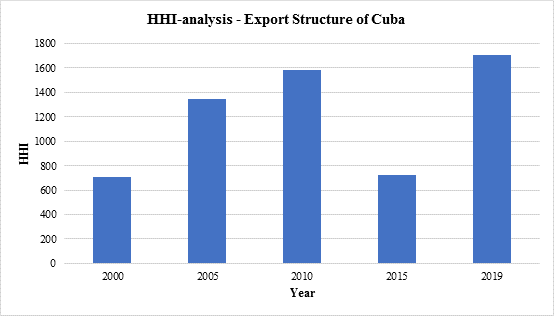
Fig. 1 Herfindahl-Hirschman Analysis of the Export Structure of Cuba. Years 2000, 2005, 2010, 2015, and 2019 

We can observe that the Cuban export portfolio was not diversifiedin 2000-2010, but in 2015 itdiversified, but again concentration trend continued.

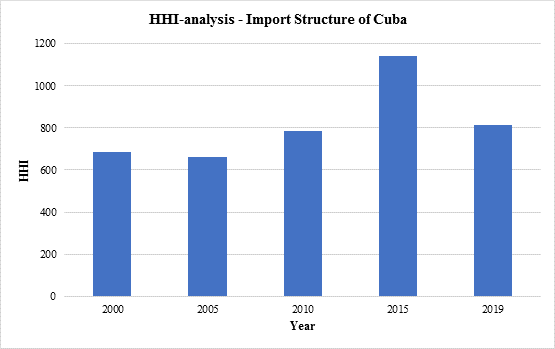
Fig. 2 Herfindahl-Hirschman Analysis of the Import Structure of Cuba. Years 2000, 2005, 2010, 2015 and 2019 

We can observe that after 2005 concentration trend of Cuban import activities continued till 2015, but 2019 slightly became more diversified in 2019. Further more, we can note that based on HHI analyses, the export portfolio of the Cuban economy is more concentrated than the import portfolio of the Cuban economy.

In figure 3, we report the results of the LKI analysis of the Cuban economy. This index-based analys is reveals that after 2005, the concentration of export structures increased considerably in the Cuban trade. However, in 2019, the concentration trend decreased slightly, almost at the same level as in 2010.

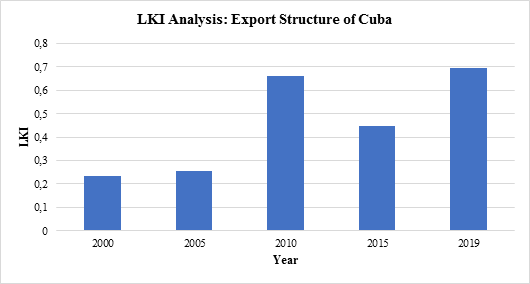
Fig. 3 Lauraéus- Kaivo-ojaAnalysis of the Export Structure of Cuba. Years 2000, 2005, 2010, 2015 and 2019 

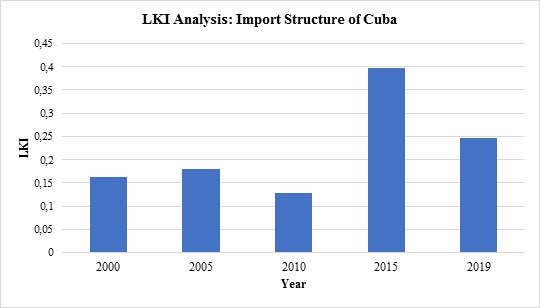
In figure 4, we report the results of the LKI analysis of the Cuban economy. We can observe that after 2005 low concentration trend of Cuban import activities continued till the year 2010, but in 2015 it changed slightly to become more concentrated but dropped to a lower level.

We can note thatbased on LKI analyses, the export portfolio of the Cuban economy is more concentrated than the import portfolio of the Cuban economy. The results are similar to HHI analyses.

In general, based onempirical analyses, we can note that resilience challenges of trade are more challenging in the field of export than import. This indicated that economic dependency problems are linked more to export than import activities.

Fig. 4 Lauraéus - Kaivo-ojaAnalysis of the Import Structure of Cuba. Years 2000, 2005, 2010, 2015 and 2019 

Conclusions

This empirical study provides results of export and import structures of the Cuban economy and trade. Results are based on Herfindahl-Hirschman (HHI) and Lauraéus-Kaivo-oja (LKI) analyses. These results give knowledge-based background for the Cuban economy's export and import strategies. Especially these kinds of analyses give a sound knowledge base for smart specialization strategies of the Cuban economy. Results indicate that export-led strategies need some re-assessment from the resilience perspective of the Cuban export strategy. A more diversified export portfolio would be a smarter solution than the current concentration rate of the export portfolio. There is less need for re-assessment in the import strategy field because Cuba's import portfolio is already very diversified.

Acknowledgments

Funding from the Academy of Finland for the project “Cuban energy transformation Integration of Renewable intermittent sources in the power system” (IRIS), decision n:o 320229, is kindly acknowledged.

References

1.  Frenken, K.; Van Oort, F.; Verburg, T. “Related variety, unrelated variety and regional economic growth”. Regional studies, 2007, vol. 41, n. 5, p. 685-697. DOI: https://doi.org/10.1080/00343400601120296. [Accessed 10 Nov 2020]. Available at: Available at: https://www.tandfonline.com/doi/abs/10.1080/00343400601120296 1.  [ Links ]

2.  Brunner, H-P.; Calì, M. “Dynamics of manufacturing competitiveness in Asia: analysis through export data”. ERD working paper series, 2006, n. 77, p. 1-27. ISSN: 1655-5252. [Accessed 10 Nov 2020]. Available at: Available at: https://www.adb.org/publications/dynamics-manufacturing-competitiveness-south-asia-analysis-through-export-data 2.  [ Links ]

3.  Capasso, M.; Stam, E.; Cefis, S. “Industrial dynamics and economic geography”. Regional Studies, 2015, vol. 49, n. 1, p. 5-9. [ Accessed 10 Nov 2020]. Available at: Available at: https://aisberg.unibg.it/retrieve/e40f7b89-b076-afca-e053-6605fe0aeaf2/Capasso_Stam_Cefis_Industrial%20Dynamics_RegStudies.pdf 3.  [ Links ]

4.  Hongxia, CH.; Guoping, LI. “Empirical study on the effect of industrial structure change on the regional economic growth of Beijing-Tianjin-Hebei Metropolitan Region”. Chinese Geographical Science, 2011, vol. 21, n. 6, p. 708-714. DOI: 10.1007/s11769-011-0478-9. [Accessed 10 Nov 2020]. Available at: Available at: https://link.springer.com/article/10.1007/s11769-011-0478-9 4.  [ Links ]

5.  Szirmai, A.; Ren, R.; Bai, M. “Chinese manufacturing performance in comparative perspective, 1980-2002”. Economic Growth Center. Center Disscusision paper, No 920. 2005 [Accessed 10 Nov 2020]. Available at: Available at: http://www.econ.yale.edu/growth_pdf/cdp920.pdf 5.  [ Links ]

6.  Misra, A. “Growth and Structural Change in Manufacturing Industries Since 1980-1981 to 2001-2002”. Journal of Industrial Economics, Forthcoming. 2006, p. 14. [Accessed 10 Nov 2020]. Available at: Available at: https://ssrn.com/abstract=945577 6.  [ Links ]

7.  Jenissen, B.; et al7.  . “Aspects of structural change in Australia”. Productivity Commission: research paper. 2010[ Accessed 10 Nov 2020]. Available at: Available at: https://www.pc.gov.au/research/completed/structural-change/strctchg.pdf 7.  [ Links ]

8.  Tikhomirova, G. “Analysing charges in industry structure”. CSES working paper, 11. United Nations Framework Convention on Climate Change (UNFCCC). (n.d.). 1997. [Accessed 10 Nov 2020]. Available at: Available at: https://unfccc.int/resource/docs/convkp/conveng.pdf 8.  [ Links ]

9.  Schott, P. (2004). “Across-product versus within-product”. Specialization in international trade. Quarterly Journal of Economics, 2004, vol. 119, n. 2, p. 647-678. [Accessed 10 Nov 2020]. Available at: Available at: https://www.jstor.org/stable/25098696 9.  [ Links ]

10.  Carlton, D.W.; Perloff, J. M. “Modern industrial organization”. New York: Published by Harpercollins College Div. 1994, 2. Ed, p. 973. ISBN: 978-0673469021. [Accessed 10 Nov 2020]. Available at: Available at: https://books.google.com.cu/books/about/Modern_Industrial_Organization.html?id=IaW6AAAAIAAJ&redir_esc=y 10.  [ Links ]

11.  Sabonienė, A. “Lithuanian export competitiveness: comparison with other Baltic States”. Inžinerinėekonomika - Engineering Economics, 2009, vol. 2, n. 62, p. 49-57. [Accessed 10 Nov 2020]. Available at: Available at: https://www.researchgate.net/publication/228624446_Lithuanian_Export_Competitiveness_Comparison_with_other_Baltic_States 11.  [ Links ]

12.  Sabonienė, A. “The Evaluation of the Potential of Lithuanian Manufacturing Industry Structure on the basis of CI Index”. InžinierinėEkonomika - Engineering Economics, 2010, vol. 21, n. 4, p. 399-407. [Accessed 10 Nov 2020]. Available at: Available at: https://www.researchgate.net/publication/228409547_The_Evaluation_of_the_Potential_of_Lithuanian_Manufacturing_Industry_Structure_on_the_basis_of_CI_Index 12.  [ Links ]

13.  Hirschman, A.O. “National Power and the Structure of Foreign Trade”. University of California. Berkley. 1950, p. 194. ISBN: 978-0520301337. [Accessed 10 Nov 2020]. Available at: Available at: https://www.ucpress.edu/book/9780520301337/national-power-and-the-structure-of-foreign-trade 13.  [ Links ]

14.  Hirschman, A.O. “The paternity of an index”. American Economic Review, September 1964, vol. 54, n. 5, p. 761. [Accessed 10 Nov 2020]. Available at: Available at: http://www.u.arizona.edu/~rubinson/copyright_violations/Paternity_of_an_Index.pdf 14.  [ Links ]

15.  Herfindahl, O.C. “Concentration in the U.S Steel Industry”. Columbia University. New York, USA. 1950, vol. 11, n. 2[ Accessed 10 Nov 2020]. Available at: Available at: https://www.worldcat.org/es/title/concentration-in-the-steel-industry/oclc/5732189 15.  [ Links ]

16.  Adams, C. “What is the Herfindahl Hirschman Index (HHI), and why would you use it? ” 2010. Modern analyst. [ Accessed 10 Nov 2020]. Available at: Available at: https://www.modernanalyst.com/Careers/InterviewQuestions/tabid/128/ID/1003/What-is-the-Herfindahl-Hirschman-Index-HHI-and-why-would-you-use-it.aspx 16.  [ Links ]

17.  Rhoades, S. A. ‘‘The Herfindahl-Hirschman Index’’. St. Louis, MO: Federal Reserve Bank of St. Louis. 1993, p. 188-189.[ Accessed 10 Nov 2020]. Available at: Available at: https://ideas.repec.org/a/fip/fedgrb/y1993imarp188-189nv.79no.3.html 17.  [ Links ]

18.  Rinkevičiūtė, V.; Martinkutė-Kaulienė, R. “Impact of market concentration on the profitability of Lithuanian banking sector”. Business: Theory and Practice, 2014, vol. 15, n. 3, p. 254-260. DOI: https://doi.org/10.3846/btp.2014.25. [Accessed 10 Nov 2020]. Available at: Available at: https://journals.vilniustech.lt/index.php/BTP/article/view/8368 18.  [ Links ]

19.  Lauraéus, T.; Kaivo-Oja, J. “New transparent way to perform competition, market structure, and IPR portfolio analyses: Analysis of the dynamics of trademark competition in Finland as a case example”. Journal of Business Management and Economics, 2017, vol. 5, n. 12, p. 8-23. [Accessed 10 Nov 2020]. Available at: Available at: https://www.utupub.fi/handle/10024/169131 19.  [ Links ]

20.  Foray, D. “Smart specialization strategies and industrial modernization in European regions-theory and practice”. Cambridge Journal of Economics, 2018, vol. 42, n. 6, p. 1505-1520. DOI: https://doi.org/10.1093/cje/bey022. [Accessed 10 Nov 2020]. Available at: Available at: https://academic.oup.com/cje/article-abstract/42/6/1505/5123974?redirectedFrom=fulltext 20.  [ Links ]

21.  Foray, D.; et al21.  . “Guide to research and innovation strategies for smart specialization (RIS 3)”, Smart Specialisation Platform. Seville: IPTS. Spain. 2010 [Accessed 10 Nov 2020]. Available at: Available at: https://s3platform.jrc.ec.europa.eu/en/w/guide-on-research-and-innovation-strategies-for-smart-specialisation-ris3-guide- 21.  [ Links ]

22.  Benner, M. “From clusters to smart specialization: Tourism in institution-sensitive regional development policies”. Economies, 2017, vol. 5, n. 3, p. 26. DOI: https://doi.org/10.3390/economies5030026. [Accessed 10 Nov 2020]. Available at: Available at: https://www.mdpi.com/2227-7099/5/3/26 22.  [ Links ]

23.  Brennan, L.; Rakhmatullin, R. ”Global Value Chains and Smart Specialisation Strategy”. Retrieved from Publications Office of the European Union, Luxembourg, 2015. ISSN 1831-9424. ISBN 978-92-79-54181-0. DOI 10.2791/44840. [Accessed 10 Nov 2020]. Available at: Available at: https://op.europa.eu/en/publication-detail/-/publication/c756898c-b379-11e5-8d3c-01aa75ed71a1/language-en 23.  [ Links ]

24.  Asheim, B. “Smart specialization, innovation policy, and regional innovation systems: what about new path development in less innovative regions? ”. Innovation: The European Journal of Social Science Research, 2019, vol. 32, n. 1, p. 8-25. DOI: https://doi.org/10.1080/13511610.2018.1491001. [Accessed 10 Nov 2020]. Available at: Available at: https://www.researchgate.net/publication/325917014_Smart_specialisation_innovation_policy_and_regional_innovation_systems_what_about_new_path_development_in_less_innovative_regions 24.  [ Links ]

25.  Caragliu, A.; Del Bo, C.F. “Smart specialization strategies and smart cities: An evidence-based assessment of European Union policies”. In The rise of the city. Edward Elgar Publishing, 2015. DOI: https://doi.org/10.4337/9781783475360.00009, p. 55-84. [Accessed 10 Nov 2020]. Available at: Available at: https://ideas.repec.org/p/mil/wpdepa/2013-17.html 25.  [ Links ]

26.  Mccann, P.; Ortega-Argilés, R. “Smart specialization, entrepreneurship, and SMEs: issues and challenges for a results-oriented E.U regional policy”. Small Business Economics, 2016, vol. 46, n. 4, p. 537-552. DOI: https://doi.org/10.1007/s11187-016-9707-z 26.  . [Accessed 10 Nov 2020]. Available at: Available at: https://link.springer.com/article/10.1007/s11187-016-9707-z 26.  [ Links ]

27.  Bikker, J.A.; Groenveld, J.M. “Competition and concentration in the EU Banking Industry”. Kredit and Kapital, 2000, vol. 33, p. 62-98. DOI: 10.3790/ccm.33.1.62 [Accessed 10 Nov 2020]. Available at: Available at: https://www.researchgate.net/publication/4810053_Competition_and_Concentration_in_the_EU_Banking_Industry 27.  [ Links ]

28.  Kaivo-Oja, J., et al28.  . “Smart Specialization Strategy and its Operationalization in the regional policy: Case Finland”. Business28.  , Management and Education28.  , 2017, vol. 15, n. 1. DOI:10.3846/bme.2017.362. [Accessed 10 Nov 2020]. Available at: Available at: https://www.researchgate.net/publication/318258961_Smart_Specialization_Strategy_and_its_Operationalization_in_the_Regional_Policy_Case_Finland 28.  [ Links ]

Received: January 22, 2023; Accepted: April 03, 2023

*Autor de correspondencia: jari.kaivo-oja@utu.fi

The authors declare that there are no conflicts of interest.

Jari Roy Lee Kaivo-oja: Research design. Mathematical modeling and simulation of the models. He participated in the analysis of the results, writing the article's draft, the critical review of its content, and final approval.

Jarmo Vehmas: Research design. Mathematical modeling and simulation of the models. He participated in the analysis of the results, writing the article's draft, the critical review of its content, and final approval.

Anaely Saunders Vázquez: Research design. Mathematical modeling and simulation of the models. She participated in the analysis of the results, writing the article's draft, the critical review of its content, and final approval.

Jyrki Luukkanen: Research design. Mathematical modeling and simulation of the models. He participated in the analysis of the results, writing the article's draft, the critical review of its content, and final approval.

Creative Commons License