


 Servicios personalizados
 Inglés (pdf)
 Articulo en XML
 Referencias del artículo
 Enviar articulo por email
 Citado por SciELO
  Similares en
SciELO
Similares en
SciELO 
 Permalink
Introduction
This paper focuses on Cuba and its resilience analysis of energy sources. The analysis covers the years 1971-2018. We also analyze the domestic energy resilience level till the year 2050 in a future energy scenario. The concept of ‘resilience’ has frequently come up in discussions about the impact of COVID-19 on the energy sector. Also, other external economic shocks are testing resilience in the energy sector in economies. However, the actual meaning of resilience can be hard to pin down. The term seems to be being used increasingly, at the risk of being overused and losing real meaning. A general assumption among energy experts is that renewable energy systems are more resilient than non-renewable energy systems.
Energy systems with high percentages of renewables are better able to resist global shocks than those based on fossil fuels. Energy systems which are controlled locally are less susceptible to the adverse effects of crises elsewhere. A sound and resilient global energy system can effectively guarantee average production and other green research and development activities [1, 2]. National and regional sustainability and risk management are increasingly relevant issues for decision-makers. These kinds of discussions are in the background of this empirical energy sector study, which focuses on the resilience analysis of the Cuban energy sector. The article predicts that renewable power production should continue to grow while fossil fuel demand collapses during the Covid-19 crisis. Nonetheless, in the current situation, falling investments are threatening new renewable projects in Cuba and the world. From this particular future perspective, it is wise to monitor the use of different energy sources in the Cuban economy.
Methodology
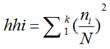
Being a commonly accepted measurement of market and portfolio concentration, the HHI measures the ratio of firm size to the industry size as a proxy for the degree of competition among them [3, 4, 5, 6]. As noted above, the HHI index is defined as the total squared market shares of all firms within the industries at stake. The result of this exercise may range from 0.0 to 1.0, thus spanning a continuum ranging from the prevalence of a considerable number of tiny firms to a situation defined by only a monopolistic firm/unit. HHI increases are typically understood as indicators of decreases in competition and increase in market power [7, 8, 9]. One key advantage of the HHI vis-à-vis the C.R. is that the former gives more weight to larger firms as it accounts for relative firm size distributions in each market. However, the former’s calculation differs from the latter’s insofar as the equation for determining the HHI is as follows (see equation (1)):
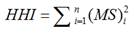 (1)
(1)
Total background reviews of HHI analyses can be found in various references, especially in [9]. Data is collected from the updated International Energy Agency database (https://www.iea.org/data-and-statistics/data-tools/energy-statistics-data-browser?country=WORLD&fuel=Energy%20supply&indicator=TESbySource). Again, and we find that the HHI is calculated by squaring the market share of each firm competing in the market and then totaling up the resulting numbers. The original reason why Lauraéus and Kaivo-oja [8], started their further development of the HHI is that this indicator does not account for size differences among the analyzed categories. At the same time, the authors concluded there to be good reasons for avoiding such potential calculational biases.
The new methodology for export and import portfolio analysis: Expanding the HHI toward the LKI
In the HHI, the Lauraéus-Kaivo-oja Index (LKI, [8]) is based on the subsequently outlined reasoning. First, Lauraéus and Kaivo-oja hold that see in equation (2):
 (2)
(2)
which can be written using the mathematic equation (3):
 (3)
(3)
Where by The sample size is = N, The count of different categories in the sample = k, and The average value of the sample classes =  .
.
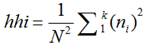
Yet, there is a way to remove the “1002”-part of the equation, as we can replace percentages with the decimals of 0.01-0.99, corresponding to 1-99%. Thus, we also avoid calculational problems related to values 0-10000, which are less intuitive than percentage values. Thus, we may create the index hhi, which means the HHI index (see equation (4)) without 1002.
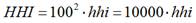 (4)
(4)
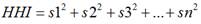
As we take out the 100 2 out of the equation, have replaced the HII with the “hhi”, whose equation (5) is:
 (5)
(5)
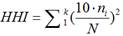
Which is equal (see equation (6)) to:
 (6)
(6)
Yet, as the total quantity of the sample is = N, which is equal to the number of different classes in the sample, the total sum in the sample classes may be expressed as follows (equation (7)):
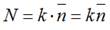 (7)
(7)
Consequently, we may argue that if the “hhi” may be expressed as shown in equation (8):
 (8)
(8)
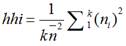
Then it may also be represented as equation (9)
 (9)
(9)
Whereby  refers to 1 over k numbers of categories within the sample. Yet, the issue is that this might generate a distorted analysis of key trends as if one has different numbers of categories in one’s sample, then one is incapable of comparing these categories with one another, for otherwise, it will distort the analysis [7]. Take the example of a sample consisting of 34 categories of goods (
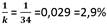 ) and 11 categories of services
  ).
).
In this case, the fewer the classes, the bigger the percentage added to the “hhi” index. Thus, why such percentages should be added to an index arises. If all numbers of the samples are in one class, then  . Thus, one may safely remove and retain a more informative and pertinent trend curve [7].
The Lauraéus-Kaivo-oja Index (LKI) can be represented with the equation (10):
 (10)
(10)
If the maximal diaconal standard deviation is correctly expressed as δ 2=(k-1) n -2, then the divisor must be (k-1).
Thus,  appears to be the wrong divider, whereas the right one seems to be (k-1) n2.
Thus, the new novel LKI indicator must be as shown in the equation (11):
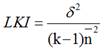 (11)
(11)
It follows that the LKI index is the square of standard deviation over the completely divided square of standard deviation (see [8]). In the next section, we report key results based on the HHI and the novel LKI indicator.
Energy resiliency analysis results of HHI and LKI analyses
In this section,we report key results and findings of energyresiliencyanalysis of the Cubaneconomy. In figure 1, we report a long-run resilience trend of total energyconsumption in Cuba measured by the Herfindahl-Hirschman Index.
In figure 1, we can observe thatresilience,measured by the HHI trend, wasquite favorable in Cuba from 1971-2007, but after the year 2007 situation becamelessresilientwhen HHI jumped to 0,4 levelwhen HHI reacheditslowestlevel of 0,25 in years 2001-2007.
Again, after 2014 resilience, diversification of energy sources increased, probablybecause of the high price of oil and otherfossil fuels. An informedguessisthat all these changes in the HHI resiliencelevel are linked to external shocks that the Cuban economy has faced through out history.

Figure 2, shows that resilience, measured by the LKI trend, wasquite favorable in Cuba from 1971-2007; after 2007,the situation became less resilient when LKI jumped almost to the 0,6 level. Again, after the 2007-2008 alarming resilience problems, diversification of energy sources increased, probably because of the high pricelevel of oil and other fossil fuels. The LKI analysis provides more sensitive results than the previous HHI analysis (figure 1). Again, an informed guess is that all these changes in the LKI resilience level are linked to the Cuban economy's external shocks faced in history. In figure 3, we report the results of the HHI analysis of domestic energy consumption in the Cuban economy.

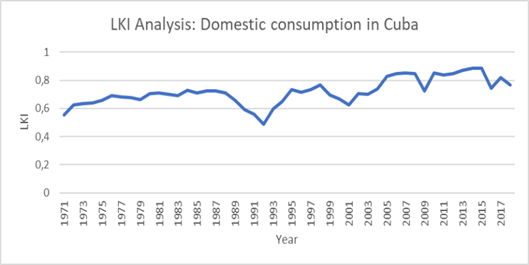
Figure 3, shows that the resilience of domestic consumption has been relatively stable in Cuba, which is a good result. There have not been many complexrisk situations in domesticenergyresilience. Further more, the HHI trend of house hold energy consumption has declined, indicating an improvement in resilience in domestic energy consumption in Cuba. In figure 4, we report the results of the LKI analysis of domestic energy consumption in the Cuban economy.
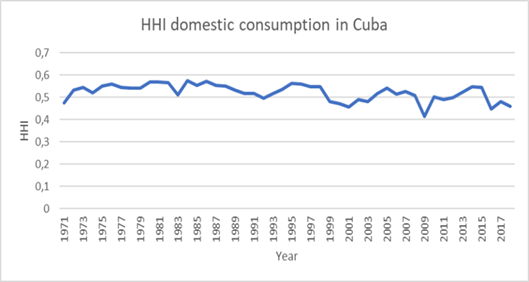
Figure 4, shows someinterestingthingsthat can make a new scientificdiscovery. The more sensitive analysis of LKI provides slightly different results than traditional HHI analysis, which includes the possibility of statistical measure mentbiases. The novel LKI analys is informs us that domestic energy resilience problems have increased gradually in the long run, historical perspective in the years 1971-2018. The external shock of the Soviet Union collapse can beseen in changes in the long-run trend between 1998 and 1994. This energy resilience change was not sowell observed in the HHI resilience analysis. It isalso important to note that the high LKI level indicates serious domestic energy resilience problems.
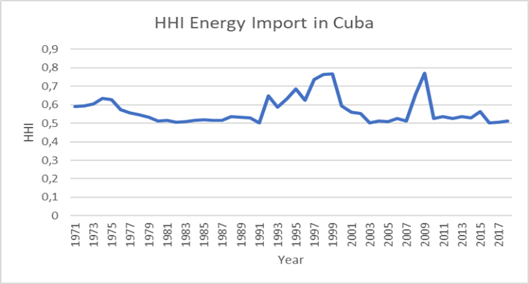
In figure 5, we report the results of the HHI analysis of import energy consumption in the Cuban economy. In this figure, we can easily observe the peak moments of import energy resilience problems in the Cuban economy. The Soviet Union´s socioeconomic collapse and,later, the global financial crisis created two destructive historical resilience crises in the Cuban economy. However, we can also note that resilience has been relatively stable in the long run, being about on HHI 0,6 level.
In figure 6, we report the results of the LKI analysis of import energy consumption in the Cuban economy.Compared to figure 5, the more sensitive LKI analysis provides more information to us.
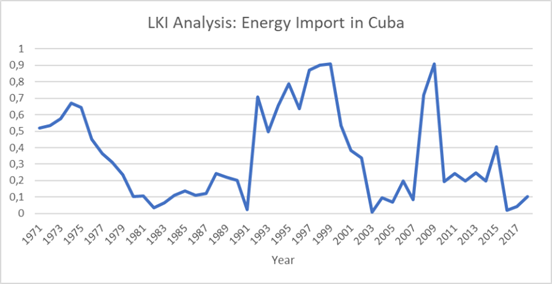
A novel LKI analysis reveals new information regarding Cuba's energy import resilience challenges. The analysis results suggest that there would have been more significant fluctuations in the resilience levels compared to what the HHI analysis told us in figure 5. This new scientific result and findings hould certainly be investigated further. There can also bestatistical and measure men terrors, which may explain these strong fluctuations. However, we can observe dramatic changes after the Soviet Union´s collapse and during the global financial crisis in Cuba.
Resiliency analysis results of HHI and LKI analyses for years 2019-2050
In this section, we report the results of futuristic scenario analyses of the Cuban energy economy. These results are based on the International Energy Association´s statistical analyses, which reported the IEA's domestic energy source scenario.
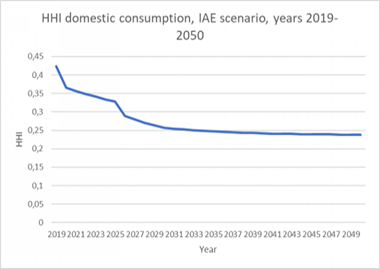
Figure 7, showsthat the general expectation isthat Cuba willimproveitsenergyresiliencefrom HHI 0,435 (2019) to HHI 0,25 (2050). This HHI energy resilience analysis result indicates more positive future prospects for Cuban domestic energy resilience.
When we observe figure 8., we can seethat the general expectation isthat Cuba will improve its energy resilience from HHI 0,7 (2019) to HHI 0,2 (2050). This findingis, of course, a very positive expectation of energy resilience.

Conclusions
In this article, we have assessed the resilience of Cuba's energy economy through three primary empirical analyses, using the Herfindahl-Hirschman index and the Lauraéus-Kaivo-oja index. The results and findings are interesting and raise many urgent needs for further research. Increasing resilience in the energy sector is one key strategic energy policy issue. This is a challenge for all critical decision-makers in Cuba. Therefore, concerning this strategic key sustainability challenge, the results are relevant.
The empirical results presented in this Cuban energy resilience study indicate that the disintegration and the collapse of the Soviet Union and also the global financial crisis had significant impacts on the resilience of the energy economy in Cuba. External and international shocks have been bad drivers for energy resilience in Cuba.

