


 Servicios personalizados
 Español (pdf)
 Articulo en XML
 Referencias del artículo
 Enviar articulo por email
 Citado por SciELO
  Similares en
SciELO
Similares en
SciELO 
 Permalink
Introduction
The Cuban electricity system relies on fossil fuel combustion in large condensing power plants (termoeléctricas) and internal combustion engines using fuel oil and diesel. About 95 % of electricity production is based on fossil energy. However, Cuba plans to reduce carbon emissions and use more renewable energy sources. In the Third National Communication to UNFCCC, Cuba states that to achieve a change in the energy mix, increase energy efficiency, and reduce GHG emissions, the incorporation of renewable energy sources such as solar PV, biomass, and wind, in electricity production is needed [1] and the Council of Ministers approved, in 2014, the "Policy for the prospective development of renewable sources and efficient use of energy”, aimed at making the most of renewable resources available nationwide [1].
The fire at the Matanzas oil storage in August 2022 and several problems in the old power plants have highlighted the need to transform the electricity system. The Cuban authorities have discussed possibilities to find ways to develop a 100 % renewable electricity system [2]. In the Cuban case, where hydropower resources are minimal, and biomass resources cannot cover the electricity demand, solar PV and wind power use becomes crucial. However, integrating these variable renewable energy sources into the electricity system faces some techno-economic challenges. In the electrical system, the electricity supply must equal the electricity demand every second. When the load (electricity demand) varies throughout the day and year, and the supply of solar PV and wind power varies according to the weather conditions, the balancing has to be carried out using controllable power sources and loads when the share of variable solar and wind production increases in the system, balancing power production faces more significant challenges.
The balancing of supply and demand can be carried out in several ways. Controllable power plants, such as fossil-based thermal, biomass, and hydropower plants, can change their power output to balance supply and demand. Different types of power plants can respond to the required changes at different change rates. For example, Hydropower, gas turbines, and ICE power plants are faster than steam power plants. The required change rate of balancing power depends on how fast the electricity demand changes (load curve changes) and how fast the variable energy sources change their outputs. In this article, we look at the required changes in electricity production from the point of view of balanced supply and demand in the future Cuban electricity system.
Energy storage can be essential for balancing supply and demand in a system with a high share of variable renewable energy sources. For instance, energy storage can be in batteries, pumped hydro storage, compressed air storage, flywheels, or a power-to-gas-to-power (P2G2P) system. P2G2P technology involves using excess electricity to produce hydrogen that can be stored in the gas network and later converted into power again. This article analyzes the use of pumped hydro storage for balancing the electricity system because it seems to fit the local requirements in the Cuban case. This article analyzes possible scenarios for reaching a 100% renewable electricity system by 2050. We concentrate on constructing scenarios for electricity consumption in different sectors of the economy and building backcasting scenarios for electricity supply to meet targets for the share of renewable energy in the production mix.
The scenario construction in this article is carried out using the CubaLinda model [3]. The model structure is shortly presented in the next section. The CubaLinda model is used for constructing hourly consumption scenarios till 2050 and then looking at different options to cover the demand with renewable sources. The two production scenarios are based on the increase in solar PV and wind power investments in different locations in Cuba and the wind and solar radiation potentials in these locations. The scenario approach used here is the so-called backcasting scenario [4], where first the target, in this case, 100 % renewable electricity production, is set, and then different options for reaching the target are analyzed using the CubaLinda model by changing the different input data (like investments in power plants).
Desarrollo
Cubalinda Model
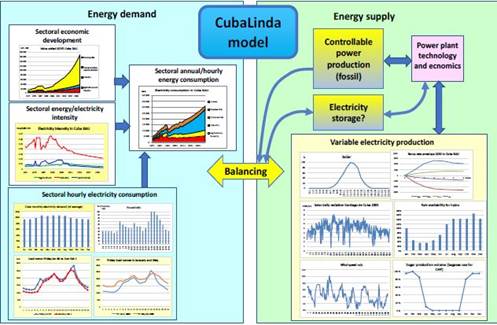
CubaLinda model is a so-called accounting framework model with which scenarios can be constructed for the energy demand and supply sides. The electricity demand and supply are modelled hourly. The model balances electricity supply and demand. The historical power plant data is from the National Statistical Office of Cuba [5], and the sectoral energy consumption figures are from the International Energy Agency IEA statistics [6]. The sectoral economic data of value added is from UN Statistics [7].
The Linda model is based on the so-called intensity approach using the Kaya identity to calculate CO2 emissions [3]. The main balancing components of the model are illustrated in figure 1. The energy demand for electricity and fuels is based on the constructed scenario for economic growth in different sectors and electricity and fuel intensities in different sectors of the economy. The hourly electricity demand is constructed based on user-given load curves for sectors and the future scenarios of the changes in load curves and the growth in sectoral consumption. The sectoral load curves are constructed separately for weekdays and weekends and the different months of the year.
Electricity supply scenarios are constructed based on user-given investments in different power plants. The solar PV power plants are situated in different provinces, and the incoming radiation is obtained from the MERRA database using renewables.ninja website [8]. The model uses hourly data from 2019 for different locations and combines the incoming radiation data with the installed PV capacity in different provinces defined in scenarios. The wind power production is based on wind speed information and its conversion to electricity output in the MERRA database for 2019 [9], for different planned wind farm locations. As a result, wind power capacity will be invested in these locations in the scenarios.
The model uses controllable power plants to balance the supply and demand of electricity. The first balance option is electricity storage, in this case, pumped hydro storage. It will carry out balancing, and fossil ICE and gas turbine power plants will be used if there is not enough capacity in the pumped hydro storage. According to Montes Calzadilla in his master's thesis “Modeling of the Energy Transition in the Cuban National Electric System using the IRENA FlexTool software” in 2019, there is a potential pumped hydro storage capacity in the Eastern part of about 7800 MW in 13 locations, in the central part about 1850 MW in four locations, and the Western part, about 3300 MW in eight locations. The estimated potential in these 25 locations is almost 20 000 MW with 5 hours of operation as an average in generation (discharge) mode, which could result in a maximum generation of 100 GWh/Day.
The CubaLinda model constructs scenarios for different sectors of the economy and calculates the fuel used in different sectors, related CO2 emissions, and electricity production costs (Levelized Cost of Electricity, LCOE) based on user-given information of future investment costs, operation and maintenance costs, and fuel cost for different power plant types and fuels. The model also calculates the required ramping rates (need for maximum change in power production per hour) and load duration curves to assess types of power plant capacity investments.
Scenario construction for renewable integration - towards 100% renewables
The CubaLinda model has been used to construct different future scenarios to analyze the changes in electricity consumption and production when lots of new solar PV and wind power capacities are installed. First, we have constructed a base scenario until 2050 concerning economic development and electricity demand. Then, based on it, we have used the backcasting scenario method [4], to analyze the possibilities of reaching the 100 % renewable scenario. In the backcasting scenario construction, the target for the end-year situation is the starting point. Then, the model input data is modified to see the possibilities for reaching the target.
Scenario 1
The economic development in Cuba in the first scenario is assumed to follow a similar pattern to historical development in the main production sectors. Therefore, the development of value-added and electricity consumption in Scenario 1 are shown in figure 2.
This figure also shows the installed power plant capacity and electricity production by different power plants in scenario 1. It must be specified that ‘New technology’ means internal combustion engines (ICE) using diesel or fuel oil.
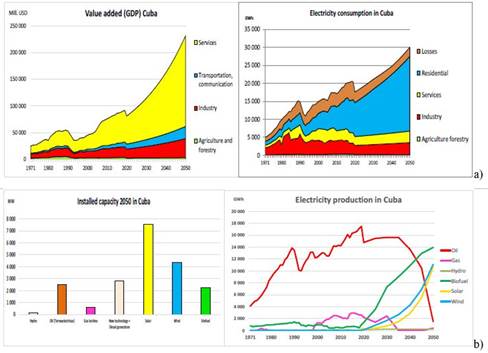
Fig. 2 Scenario 1:a) Economic development and electricity consumption in Cuba in different sectors of the economy; b) Installed power plant capacity and electricity production by different types of power plants
The electricity consumption in Scenario 1 is also shown in figure 2. The growth in electricity consumption in different sectors is based on economic development and the changes in electricity intensity. Here we assume considerable growth in the residential sector, including the consumption in the rented apartments for tourists (casa particular), private restaurants, and other small private businesses.
In this scenario, there is a considerable increase in solar and wind power investments and pumped hydro storage with a capacity of 40 000 MWh.
Biofuel, wind, and solar productions are increasing considerably, while oil-based production decreases fast due to investments in renewable capacity. It is assumed that termoeléctricas do not generate in this scenario in 2050 because of the fast response needed for the residual production and the form of the residual load duration curve, which implies that there is no room for baseload production. In this scenario, wind and solar capacity growth after 2024 is assumed to be 10 percent annually until 2050.
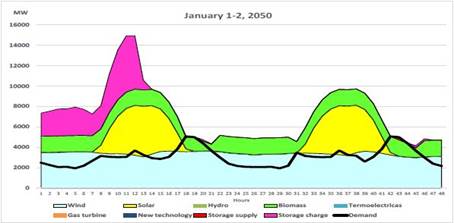
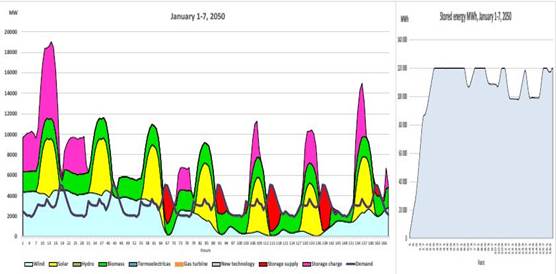
Figure 3, shows the electricity production and consumption during the first two days of 2050. The wind speed (from the reference year 2019) is relatively high, enabling lots of wind power production. During the first seven hours of the first day, wind production exceeds the electricity demand, and the extra production is stored in the pumped hydro storage. Biomass is used for power production, even though wind production covers the demand because industrial Combined Heat and Power (CHP) production is needed for heat production. During the daytime, solar power increases production and enables additional electricity storage despite the increasing demand.
During the evening peak consumption time, wind, solar, and biomass production are not enough to cover the demand, and that is why a little bit of supply from the storage is needed for balancing. The second day of January is quite similar to the first day, and we can see that all the electricity consumption is covered with renewable sources during these days. The storage is not charged during the peak solar production on the second day because the storage capacity is already total (see figure 4).
Looking at the first week of January (see figure 4), we notice that renewable sources cannot cover all the demand on January 5th, 6th, and 7th. During these days, the wind speed decreases (in the reference year), and renewable production is too low to cover the demand even though biomass production uses the total available capacity. As a result, the storage capacity needs to be used to balance production and consumption, as shown in figure 4.
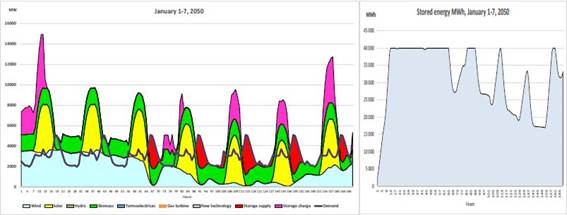
Figure 5, shows the situation on August 25-31. It shows that the amount of wind and solar capacity, biomass capacity, and assumed storage capacity is not enough to reach the 100% renewable energy target because the wind speed is meager during that period. Also, solar PV production is low, and biomass production cannot cover the demand. This indicates the need to use fossil energy to cover the electricity demand.
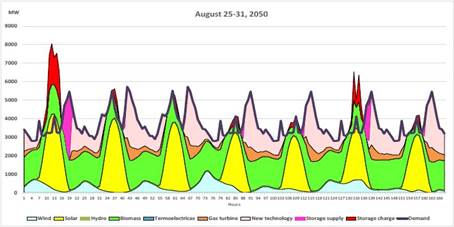
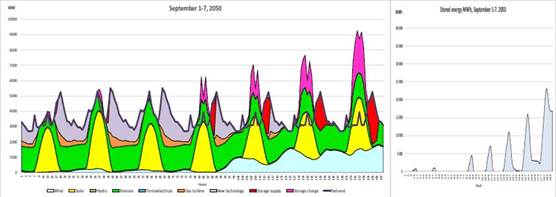
The energy storage is almost empty during the August 25-31 period. However, the low wind period continues during the first days of September, and fossil energy supply is needed to balance the supply and demand, as is shown in figure 6. During this week, the wind speed increases, and at the end of the week, the storage capacity will get some energy during the daytime.
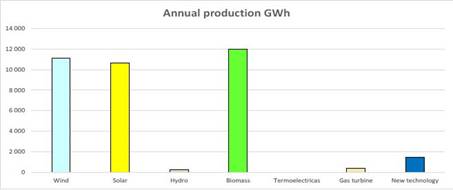
The annual electricity production of different energy sources in Scenario 1 is shown in figure 7. In this scenario, renewables dominate production, and their share of the total annual production is 95 %. Biomass has the highest share of production (about 12 000 GWh), followed by wind power (about 11 000 GWh). Solar PV production is about 10 600 GWh, fossil-based ICE production (New technology) about 1 500 GWh, and gas turbines about 400 GWh. The hydro production is very low due to the low installed capacity. In this scenario, the storage supply is about 3 200 GWh, and the storage charge is 3 700 GWh.
Scenario 2
In Scenario 2, the economic development is equivalent to Scenario 1, but wind and solar investments have increased. In this scenario, we have also increased pumped hydro storage capacity from 40 000 MWh to 120 000 MWh. The electricity consumption in this scenario is the same as in Scenario 1. The installed power plant capacity in 2050 in this scenario is shown in figure 8.
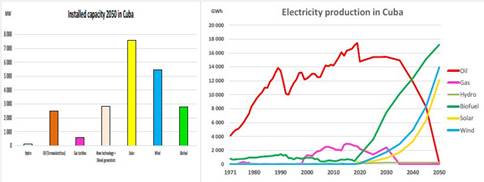
Fig. 8 Total installed power plant capacity and electricity production from different power sources in 2050 in Scenario 2
The increase in wind capacity in this scenario is considerable. The growth of solar PV capacity is assumed to be 10 percent per year after 2024, and wind capacity is assumed to increase by 11 percent per year after 2024. Electricity production with different power sources in Scenario 2, is shown in figure 10 too. Again, we can notice that the share of fossil production decreases fast after the introduction of added renewable capacity and almost reaches zero by 2050. The annual electricity production in 2050 from different power sources in Scenario 2, is shown in figure 9. Fossil energy sources still cover part of the consumption, but the share of renewable sources in this scenario is already 99.6%.

When we look at the electricity production and demand in the first week of January 2050, in this scenario, we can find out that the renewable energy capacity, together with the increased storage capacity, is sufficient to produce all the needed electricity, as can be seen in figure 10. However, there is considerable overproduction of electricity in this scenario on some days. The storage capacity is not large enough to store all the excess energy, and the storage capacity reaches its maximum limit on the second day of the operation.
When the wind speed reduces during August-October, the renewable capacity is insufficient to produce all the required electricity, as shown in figure 11 a), for the last week of August 2050. During this period, the stored energy capacity partly increases during the daytime when solar production increases. However, the low wind speed and the resulting low production of wind power cannot produce enough to cover the demand, and fossil production is required.In early September, the wind speed is still meager (in the reference year data), and fossil energy is needed to cover the demand, see figure 11 b).
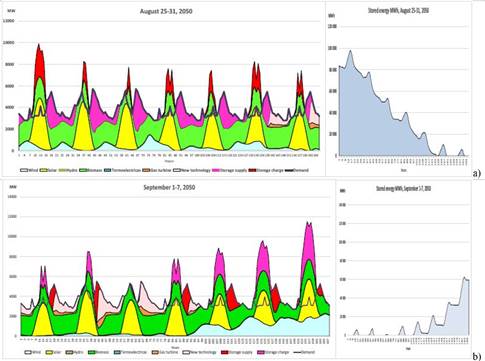
Fig. 11 Scenario 2: a)Electricity supply and demand and stored energy during August 25-31, 2050. b) Electricity supply and demand and stored energy during September 1-8, 2050, in Scenario 2
Ramp rates and duration curves
Ramping rate describes the need to change power output from power plants during the changing load. Different types of power plants can change their power output at different change rates, and power plants using combustion engines or gas turbines are faster than steam power plants consisting of steam boilers and turbines. Hydropower also provides fast ramp rates. In this sense, the pumped hydro capacity is suitable for balancing supply and demand and compensating for the fast wind and solar production changes. The ramp rate envelope shows the required maximum rates for different time windows (1-6 hours) for changing the power output up and down. It also shows the average ramp rate up and down.
The ramp rate envelope for the residual power production (demand minus wind, solar, and biomass production). In Scenario 2, in 2050, the maximum ramp rate in one hour is about 1500 MW up and down in this scenario. In two hours, the maximum ramp rate up is close to 7000 MW/2h and down slightly less than 4000 MW/2h. The maximum ramp rate up in three hours is over 9000 MW/3h. These ramp rates show how fast changes occur when lots of supply is from variable renewable sources, and at the same time, the consumption is also changing. The situation is especially problematic when the evening peak consumption occurs when solar production decreases fast. In this scenario, the maximum storage supply power is about 4000 MW, requiring a vast power plant capacity in the pumped hydro storage.
In Scenario 2, the share of fossil energy in electricity production is only 0.4 %. To reach a 100% share of renewable energy, investments in solar energy and storage capacity should be increased considerably, or biomass capacity should be increased. The problem with the increase in biomass capacity is biomass availability [10]. Additional possibilities would be to use municipal waste for electricity production and to produce biogas for electricity generation. These resources are, however, relatively small in Cuba.
One possible option to increase the share of renewable energy in electricity production is to utilize biodiesel or bio-oil in the existing diesel generators and fuel oil plants. The amount of biofuel in this form is calculated with the CubaLinda model. In Scenario 2, the amount of electricity produced with fossil energy will be about 180 GWh in 2050. If this is produced with a diesel motor with an efficiency of about 40%, the fuel requirement is about 450 GWh, about 39 ktoe. If the price of biodiesel is about 1500 USD per ton, the fuel cost for the production would be about 58 million USD.
This would, however, reduce the same amount of fossil oil consumption so that the total cost would not be very high. Assuming the regular diesel price is 1000 USD per ton, the price difference to using biodiesel instead of regular diesel to produce 255 GWh would be about 20 million USD.
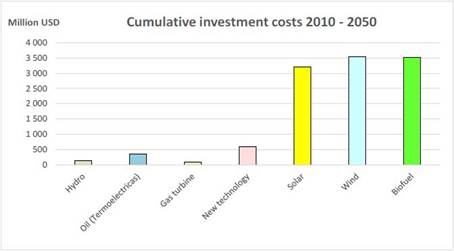
An approximation of cumulative investment costs for Scenario 2 during 2010-2050 is given in figure 12. The cumulative investment costs are calculated based on assumptions of sharply reducing costs of solar PV and wind power investments. Solar PV investment costs are assumed to reduce from 1500 USD/kW in 2010 to 400 USD/kW in 2050, and the wind power investment costs from 1500 USD/kW in 2010 to 600 USD/kW in 2050. In addition, the capacity factor of wind power production is assumed to increase due to the new types of wind power plants with considerably higher hub heights. The investment costs of fossil and biofuel power plants are assumed to remain constant.
General considerations
The target of a 100% renewable electricity system is challenging for Cuba. Some of the challenges are related to the economics of the energy system. Switching to a 100 % renewable system requires significant wind and solar power plant investments. This is not easy for Cuba, struggling with economic problems caused mainly by the US blockade. International climate change funds could provide one possibility for obtaining resources for investments if the industrialized countries will fulfill the obligations of the Paris Agreement and the promises given in the Glasgow COP26 negotiations. Using renewable energy sources instead of fossil energy will naturally decrease the fuel costs of electricity production. However, the investment's required payback time depends on future investment and fuel costs.
In addition to the investments in power production, there will be a need to invest in the electricity transmission and distribution grid. Most of the wind production potential and planned capacity are situated in the Eastern part of the country, while most of the consumption is in the Western part. This will result in a need to increase the power transmission capacity. If part of the investments is carried out decentralized, especially in the case of solar PV, the need for increased transmission could even be reduced. On the other hand, the estimated increase in electricity consumption will naturally increase the need for added transmission and distribution capacity.
One of the challenges is the required investments in energy storage capacity. Required ramp rates for balancing the power system with a high share of variable renewable generation require much controllable capacity both on the generation and consumption side. The analyzed amount of storage capacity is vast, especially compared with the total capacity of the generation system. In these scenarios, we assumed pumped hydro storage to balance supply and demand. According to National Electric Union (UNE) estimations, the theoretical potential for large-scale pumped hydro capacity exists in Cuba, up to 20 000 MW and 100 GWh. Battery storage can provide the grid's fast balancing and frequency control advantages. Still, their role in ample energy storage is implausible if their future prices will not decrease radically.
One possible technical solution to medium- and long-term energy storage is power-to-X-to-power technology (P2X2P), where electrolysis produces hydrogen and, together with carbon, converted to ammonia, methane, or some other storable medium to be reconverted back to electricity when needed. Conversion with carbon benefits from existing infrastructure like the natural gas network and internal combustion engines, but hydrogen can also be used without conversion, for example, in industrial sites.
The challenges of conversion include high costs and poor efficiency. Producing the hydrogen required for producing 1 MWh of storable fuel energy takes 1.9 MWh of electricity. Conversion losses and costs of carbon capture increase the cost. Fuel cells can be used as part of this technology. Their conversion efficiency varies from 40% to 60% depending on the fuel (hydrogen or reformed fuel, for example, methane). Using fuel cells is also possible in the transport sector, where the decarbonization requirement exists.
The Cuban power system is an island system. This makes balancing supply and demand even more difficult because the isolated power system is relatively small and sensitive to disturbances. Moreover, this balancing task will become even more complicated when the synchronous generation of massive turbine-generator systems of termoeléctricas will be replaced by switched converter-connected solar and wind generators having no natural inertia. This will make the system prone to severe frequency fluctuations in the system. In addition, reduced system inertia increases the need for fast responding controllable capacity.
There are also many opportunities for developing the Cuban energy system towards a 100 % renewable electricity system. Cuba has vast solar and wind energy resources, and their utilization will become cheaper with decreasing global prices. In addition, distributed production from renewable sources provides some protection against hurricanes and other impacts of climate change. However, considering the increasing climatic disturbances, planning the installation of renewable energy sources has to be carried out.
Demand-side management can provide possibilities for balancing, especially if electric transport increases and the charging and discharging of vehicles is carried out using innovative technology. One possibility for demand-side management is to use variable electricity prices, which directs demand towards high renewable production periods. This type of policy requires hourly-based smart electricity metering and changes in the tariff structures. Energy efficiency improvement is essential to enhance the possibility of reaching a 100 % renewable energy system. In many cases, improving efficiency is a cheaper alternative than investing in new production capacity.
Conclusions
The power system infrastructure in Cuba is old and needs new investments. Thus, investing in a new sustainable power system infrastructure does not replace adequate capacity.The scenarios constructed with the CubaLinda model show it can reach 100% renewable electricity production in Cuba. However, it requires significant investments in solar PV and wind production and investments in energy storage to balance the variable production and the variable demand. Nevertheless, the scenarios indicate that it is possible to construct a roadmap to a 100% renewable system.

