


 Servicios personalizados
 Español (pdf)
 Articulo en XML
 Referencias del artículo
 Enviar articulo por email
 Citado por SciELO
  Similares en
SciELO
Similares en
SciELO 
 Permalink
Introduction
There are various methodologies and procedures for making forecasts depending on the forecast horizon, which ranges from a few minutes to periods of 24 hours, 1 week and even months. In them, the forecast of solar radiation has been essential, first of all, and for which there are various works that refer to it using various methodologies, for example:
The total power generation in the country is between 2.5 and 3.0 GwHdaily, there is a project to increase the contribution of renewable energy sources to about 30% to 34% of this figure in the next few years. The main source of this amount corresponds to wind and solar generation, which are clean and rather reliable technologies, but bear the characteristic of being fluctuating, depending on the prevailing atmospheric conditions, particularly the wind speed, cloudiness and to a less extent, the temperature. When dealing with such a large fraction of renewable sources in the system, it becomes indispensable to have an accurate forecast of their effective contribution, so the planned generation from all sources can be tuned to meet the estimated demand for each day.
Dynamic numerical weather models based on the integration of the partial derivative equations system of Navier Stokes [5], can deliver forecasts of the main atmospheric fields over three dimensional grids with resolutions varying from tens of meters to hundreds of kilometers and a vertical reach from the surface of the Earth up to highest levels of the atmosphere. Numerical weather models can be global models, when they cover the whole surface of the Earth, or regional models, when they cover a limited area. To start running, models need a set of initial conditions, which consist of the values of atmospheric variables at the initial time of the forecast, these values are gathered from a huge diversity of monitoring and sounding techniques, then they are interpolated to the points of the node’s grid. Global models do not require lateral boundary conditions, but regional models do, usually they are obtained from previous runs of global models.
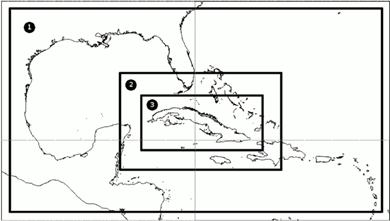
An operational forecast system(SisPI, by its acronym in Spanish) [6, 7, 8], based on the numeric weather forecast model WRF (Weather Research and Forecasting) [9], has been implemented at the Center of Atmospheric Physics of the Institute of Meteorology in Havana. It is run four times a day, at 0000, 0006, 0012 and 0018 hours UTC, coinciding with the Global Forecast System (GFS, by its acronym in English) global model runs, from which initial and boundary conditions are taken. The forecast system is configured as a set of three nested domains, as shown in figure 1, the outer domain has a horizontal distance of 27 km between grid points, the second or middle domain has a distance of 9 km and the third or inner domain has a 3 km distance.
Only the outer domain gets its boundary conditions from the global model, which has a distance between points of 50 Km, and is downloaded from the National Centers for Environmental Prediction (NCEP, by its acronym in English) web site https://nomads.ncep.noaa.gov/gribfilter.php?ds=gfs_0p50. The other domains get their boundary conditions from their immediate outer domain. The two outer domains run together in a scheme known as two way nesting, where in the process of integration, the inner domain modifies the values of the outer domain’s grid. The third domain is run in a one way scheme, it does not modify the values of the second domain. Forecast lengths are 72 hours for the 2 outer domains with outputs every three hours and 48 hours for the 3 km domain, with hourly outputs. All this forecast information is written in binary NETCDF files in the form of 2D and 3D matrices for every variable at every time step for the three domains. Utilities have been developed that produce the corresponding maps and graphics, which are shown at the Institute web site http://modelos.insmet.cu/sispi/.
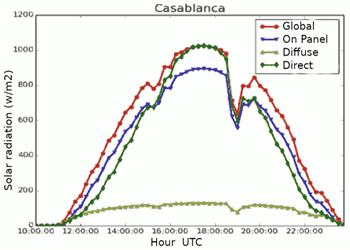
Among the output variables of the model there is a set related to solar radiation that includes instant and accumulated fluxes of direct, diffuse and global radiation at the surface for short and long wave bands. These values are calculated taking into consideration the interaction of radiation with absorbing gases and aerosols in the atmosphere, as well as the cloud cover generated by the own model. Figure 2, shows the daily fluxes of direct, diffuse and global radiation, as well as radiation over a panel tilted 15 degrees South, forecasted by the WRF model 24 hours in advance for Casablanca station. The output interval in this case was 15 minutes.
Based on these operational forecasts, a scheme has been implemented that estimates the hourly generation and integrated daily total output for the next day from a set of PV facilities scattered over the national territory.
Materials and Methods
Given the location of Cuba at 75o west, the 12 hours UTC run of the operational SisPI system is chosen for the generation forecast, as it starts at 7 or 8 AM in local time and delivers its hourly forecast for the next two days. The WRF model is designed to run in parallel over the MPI (Message Passing Interface) platform, in the early stages it took about 5 hours to complete the forecasts, in the current hardware system it takes only about 1 hour and 30 minutes.
The hourly global solar radiation values at the PV parks positions is interpolated from the 3 km grid of the 3rd domain forecast for the next day. There are several ways to calculate the power generation of a PV park (Mw) given the solar radiation input [10], some of these methods require quite detailed information from the facilities. Since hourly values of solar radiation measured at the parks as well as power generation is delivered by the National Charge Dispatch Office in daily reports, regression equations between power generation and solar radiation can be built for each park, which allow to estimate the generated power given the forecasted solar radiation. The regression equation applied has the form: (See equation (1)):
 (1)
(1)
Where:
G |
Generation in MW |
Rad |
Solar Radiation W/m2 |
Sh |
Sin of the solar height angle |
Aij |
Fitted coefficients |
As equation (1), shows, the generation has been defined not only as a function of the incoming solar radiation, but also of tee sin of the sun height angle, this dependence can contribute to explain some physical issues such as the spectral shift to shorter wavelengths around noontime and, indirectly, the effect of the panels higher temperature near noon.
The fitting process is performed for each PV park every day, taking solar radiation and generation data reported, and solar height angles which are calculated from the location, date and hour of the reports, as there can be some quality problems with the data.
The regression procedure is performed twice, first it involves all available data in the previous 60 days and the estimation error is calculated, then all points where the difference between the reported and the estimated values exceed the estimation error are withdrawn from the data list and a new regression set of coefficients is calculated. These dependencies reflect the main characteristics of each PV park, such as their different sizes, technical conditions or aging of panels, as well as the periodically varying meteorological and astronomical characteristics that influence the solar generation process. Figure 3, shows plots of estimated vs. reported values for three PV parks with different total generation capacity.
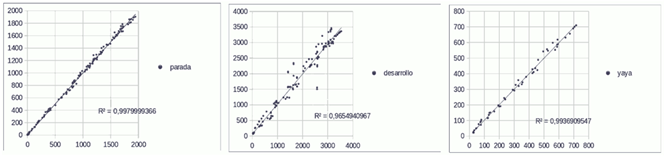
Fig. 3 Estimated vs reported values of generation, as a function of solar radiation and sin of solar height angle for PV parks “Parada”, “Desarrollo” and “Yaya”
These parks maximum generation outputs are 2.2 MW, 4.4 Mw and 1.0 MW respectively.
Results and discussion
Figure 4, shows the forecasted hourly generation outputs for a set of PV parks for the following day, according to the method described above. With the current configuration of the SisPI system, these values are available on a web page, “http://modelos.insmet.cu/static/models/ascii_data/dnc/” as a comma separated values text file before 8:00 AM, in this case these are the values for January 29, 2022, delivered on January 28, 2022
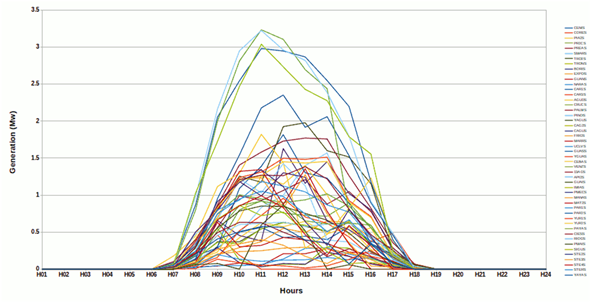
As mentioned above, the PV generation forecast it is implemented in the 12 h GMT run of the SisPI operational forecast system as it has the most convenient timing for delivering the results. A wind farms generation forecast based on the wind output of SisPI is also included in this run. These two services increase by a little less than 15 minutes the average computer time of the 12 H run, respect to the other three 0H, 6H and 18H, which is not operationally critical.
The data reports from PV parks that are received every day from the National Charge Dispatch Office have been used to assess the forecast errors in both solar radiation and power generation at each PV park. Data for a given day are compared with the forecast made the day before. Figure 5, shows the hourly distributions of relative (A, B) and root mean square (C, D) errors for forecasted values of solar radiation in w/m2 (A, C) and generation in Mw (B, D) for a set of 7 PV parks over a period from February 2018 to Jun 2018. As it shows, relative errors behave similarly for radiation and generation, with the latter being a little higher; this indicates that the process of estimating the generation values from radiation data for each park contributes little to the overall errors, being the solar radiation estimates from WRF the main source of error. The hourly behavior has maximum values towards the early morning and late afternoon hours; this is a consequence of values of radiation and generation being smaller at these hours. It also noticeable that relative errors are higher at the end of the diurnal period than in the morning, this is likely due to the fact that while mornings are more frequently clear, afternoons are more affected by convective cloudiness. Mean square errors are bigger shortly after midday and smaller towards the early morning and late afternoon, while radiation errors are rather similar for different parks, generation errors vary widely between them depending mostly on their maximum output capacity.
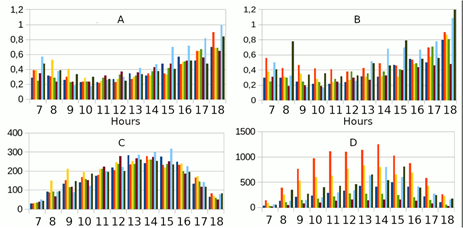
Fig. 5 Relative (A,B) and absolute (C,D) errors for solar radiation (A,C) and generation (B,D). Solar radiation is in Kw/m2 and generation in kW
The WRF model at the core of the SisPI forecast system has been subject to sensitivity studies [11] and subsequently configured to give the best possible forecasts of precipitation, particularly convective precipitation associated to cell development, easterly waves, cold fronts and other weather events of mid-scale. Solar radiation, however, requires further tuning since shallow cloudiness, which doesn’t contribute to much to precipitation, can have an important effect in solar radiation, and the model, in its current configuration, does not reproduce well this kind of cloudiness. Other aspects, such as the interaction of radiation with atmospheric aerosols can also be improved.
Conclusions
An operational generation forecast system has been implemented for PV parks connected to the National power grid. It relies on generation and solar radiation data reported at the parks for developing the dependency of generation on solar radiation. The WRF numerical model that is run operationally at the Center of Atmospheric Physics, supplies the solar radiation forecasted values. The system takes about 15 extra minutes over the operational SisPI run at 12:00 GMT, but this includes also the wind power generation forecast, which is performed at the same time. Though there are 68 PV parks listed, due to the poor quality of the data received from many of them, forecasts are made daily for about 30 parks, which report steadily. The critical variable in most cases of bad data is the solar radiation.
The relative forecast errors for individual parks is 40% or below until 14 hours, when cloudiness becomes more critical and solar values start to decline. Though the forecast information being supplied to DNC is already useful in the overall generation planning, there is still room for improvement, particularly in the solar radiation produced by the numerical model, which is so far the most critical source of error. WRF has a huge amount of configuration options which can be explored in search of better radiation forecasts and an experiment in this regard is currently underway. The system is running operationally since the beginning of 2020.

