


 Servicios personalizados
 Inglés (pdf)
 Articulo en XML
 Referencias del artículo
 Enviar articulo por email
 Citado por SciELO
  Similares en
SciELO
Similares en
SciELO 
 Permalink
Introduction
As of January 2020, a 24 to 48-hour power generation forecasts for photovoltaic and wind farms was operationally implemented at the Center of Atmospheric Physics (CFA, by its acronym in Spanish) at INSMET. This information is necessary for the National Load Dispatch Office (DNC, by its acronym in Spanish), of the Ministry of Energy and Mines, so the fluctuating contribution of these sources can be taken into account in the balance calculations between power generation and demand. It has been possible to maintain the forecast service up to the present, with some interruptions due to technical issues.
A detailed description of the system, as well as a preliminary evaluation has been published in a previous work.With the establishment of an information exchange system between the DNC and the INSMET, which allows the automatic transmission of daily wind, solar radiation and power generation, data, as well as other meteorological variables from the wind and photovoltaic farms to the INSMET and the respective forecasts from INSMET to the DNC, a series of data and forecasts of more than 3years has accumulated, which allows an evaluation of the performance of the forecast system. Nominally there is a list of 69 PV parks in operation, but in practice, due to problems in the quality and consistency of the reports, the daily number of parks for which the forecast is made ranges between 25 and 50.
The forecast system is based on the WRF numerical model (Weather Research and Forecasting) [1], which has been installed and configured according to regional conditions and is the core of the SisPI forecast system developed at the CFA [2, 3], which provides operational meteorological numerical forecasts that contribute to the general forecast service of the INSMET. In this way, the power generation forecasts are implemented as additional services of the SisPI system. The WRF model within SisPI is configured as an arrangement of 3 domains of integration. The outer domain (domain 1) has a distance between nodes of 27 km, with the center at 22.3 degrees’ north latitude and 79.1 degrees’ west longitude; it has 145 points in the east-west direction and 84 points in the north-south direction. The intermediate domain (2) has a distance between points of 9 km, 262 points in the east-west direction and 130 in the north-south direction and the third domain, which is the one from which the generation forecasts are made, has a distance of 3 km and dimensions of 469 points in the east-west direction and 184 in the north-south direction. Figure 1, shows the described domain configuration.

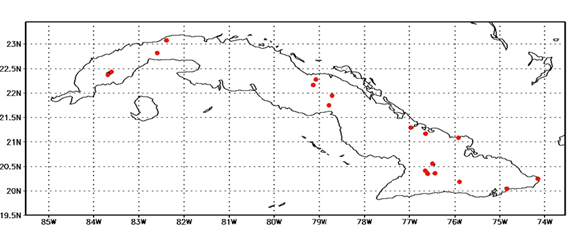
During the months of April, May and June of 2020, a great variety of meteorological conditions occurred, with days, mainly in April, almost completely devoid of cloudiness and others, in May and June with abundant cloudiness and rain; this has allowed a comprehensive evaluation of the system under different atmospheric conditions. For the evaluation of the photovoltaic generation forecast, as well as the result of the changes and adjustments made for its improvement, a sample of 40 days was selected between April and June 2020, which includes days with zero or very low cloudiness, days with average cloudiness and very cloudy days, a selection of 20 PV parks was also made based on the consistency of the reported solar radiation and power generation data series which, at the same time, represented the eastern, central, and western regions of the country. The positions of the selected PV parks are shown on figure 2
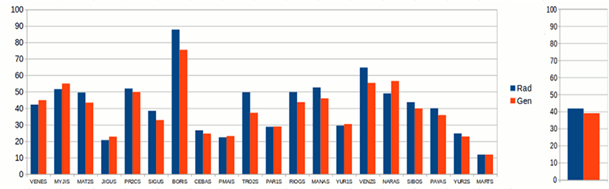
The most important feature revealed by the evaluation of photovoltaic generation forecasts is the overestimation of values with respect to the reported data, this situation occurs more intensely on cloudy days, but it is also noticeable even on clearer days, although to a lesser extent. The value of generation in each park is calculated from the forecast of solar radiation provided by the WRF model. A simultaneous analysis of the outputs of radiation and generation by parks, shown in figure 3, reveals that the overestimation in percent of generation is almost identical to that of radiation, that is, the error in photovoltaic generation is fundamentally caused by the error in the forecast of solar radiation. The average relative errors of the daily sums of radiation and generation among the selected parks were 40 % for the complete sample, in the subset of mostly clear days they were 15 % and for the cloudiest days the errors reached 84% in radiation and 78 % in generation.
Materials and methods
There are several reasons why the model can overestimate solar radiation, among these the most important is the underestimation of cloudiness. Also the selection of the method by which the information of the generated cloudiness is taken into account in the calculation of the radiation. Another influencing factor is how correctly the attenuation effect of atmospheric aerosols is calculated. The first two causes appear mostly on cloudy days while the last one affects cloudy and clear days equally. Numerical forecast models apply different schemes or parameterizations [4], to calculate cloudiness and precipitation, depending on the resolution of the working domains. When dealing with high resolution, where the distance between nodes is less than the dimensions of cloud systems, the microphysics parameterization drives the evolution of condensation nuclei and the process of formation and growth of raindrops and other hydrometeors, so the process of integration of the model generates by itself the zones of convective development.
When the resolution is low and the distance between nodes is larger, the integration scheme cannot generate correctly the convective systems. In this case, cumulus parameterizations are used, which, based on the information provided by microphysics, and other elements such as humidity, temperature and wind profiles, calculate the probability of convective development and the resulting cloudiness and precipitation. The two cited mechanisms reproduce mainly highly developed cloud systems, which make the greatest contribution to precipitation. However, in addition to these systems, low-development cloudiness is also generated in the real atmosphere, which does not make a large contribution to precipitation, but plays a very important role in the radiative balance, in both long-wave and short-wave spectral bands. As this type of cloudiness is not well represented by the aforementioned convective development schemes, starting on versions 3.3 and 3.5 of the WRF model, mechanisms have been introduced to generate these so-called "unresolved clouds" or unrepresented cloudiness [5, 6].
Previously, only one of the cumulus parameterizations also included the generation of shallow cumulus or “shallow convection”. The new options are not tied to the cumulus parameterizations and can be applied even without these being active, as is the case when working at sufficiently high resolutions, but where a mechanism for generating the shallow clouds is still necessary. Turbulent exchange processes that occur in the atmospheric boundary layer can also generate low-altitude cloudiness; these processes are incorporated into the model by boundary layer parameterizations, although not all of them take cloudiness into account. The interaction processes of solar and thermal radiation with the atmospheric components and the terrestrial surface are described by the radiation parameterizations. They are divided into short-wave, which deal with UV and visible solar radiation, and long-wave, which deal with thermal radiation from the infrared up to the microwave zone.
Although in neither case a detailed spectral analysis is made, the methods use different bands of wavelengths, taking into account the interaction processes that predominate in each one. In the case of aerosols, the so called “aerosol optical depth” or AOD is used as a measure of the attenuation caused by aerosols as radiation passes through the atmosphere, this can be defined in different ways in the model, together with other optical parameters. A climate database that is included in the model (Tegen Climatology, introduced in version 3.5) can be used, numerical values can be directly defined as constants or maps read from external files (version 3.6) or use an advanced climatology (Thompson's water/ice-friendly climatological aerosol [7, 8], version 3.8). Along with the interaction with gases and aerosols, the radiation parameterizations have to resolve the effects of cloudiness, as generated by the model. For this, several calculation schemes have been defined, which have been incorporated between versions 3.0 to 3.8 [4].
Experiments
Although the version of the WRF model that is being used in wind and photovoltaic generation forecasts is currently 3.8.1, the implemented configuration is, essentially, the one established at the beginning of the system implementation, based on version 3.5 and tuned for best results in precipitation. Given the results of the evaluation made to the photovoltaic generation forecasts, a study of the performance of the model as changes are made to some parameterizations and configuration options has been carried out, exploring some of the variants incorporated more recently, as well as others available in earlier versions, which could have an impact on the calculation of solar radiation.
11 experiments were carried out, in which successive changes of options and parameterizations that could be relevant were made. The set of 40 days and 20 parks cited above was used as the basis of comparison, so in each experiment, forecasts were generated for all parks and selected days and the values of dispersion (mean square error) and mean displacement were calculated, as well as the correlation and relative error of the daily sums between the predicted radiation and generation values and those reported at the PV parks.
The 11 experiments carried out, in chronological order, were the following:
Experiment 1: The BMJ (Betts-Miller-Janjic) cluster parameterization was introduced. Being a domain with 3 km distance between nodes, it should not require the activation of a cluster parameterization and the current operating scheme does not include it, but there are studies [9, 10, 11], that report a better performance in the precipitation forecast with BMJ activated at 3 km. However, in this case the prognosis did not improve. The activation of this parameterization caused a decrease instead of an increase in cloudiness, with the consequent increase in the overestimation of radiation and power generation.
Experiment 2: One of the shallow cumulus schemes, (Bretherton and Park) was activated, with a favorable result in reducing the mean overestimation, but with a notable increase in the execution time of the experiment.
Experiment 3: The interaction method between the calculation of radiation and the generated cloudiness was changed, applying an option [12] that was introduced in version 3.7. A slight improvement was obtained in the overestimation, without changes in execution time.
Experiment 4: The boundary layer parameterization was changed to MYNN2 (Nakanishi and Niino). The model documentation reports a mechanism introduced in version 3.8 [4] that allows the radiation calculation to take into account the additional cloudiness generated by this parameterization. However, the forecasts did not show better performance over the previous configuration.
Experiment 5: From a study of the behavior of the AOD index in the Camagüey station, an aerosol option was selected, which allows to directly define a value of this index, in this case, taking into account the average value reported in Camagüey for the interval of days chosen, an AOD value of 0.18 was defined, greater than the one implicitly used by the model, of 0.12. This experiment produced, as expected, a moderate bias reduction for both clear and cloudy days.
Experiment 6: The third option of aerosols was applied. Although the previous option had slightly improved the result, the documentation reports that this new option, incorporated in version 3.8 with an advanced climatology, also works in combination with the Thompson microphysics option, which is the one being used in the operational forecast. However, the evaluation was lower than that of the previous experiment.
Experiment 7: The shallow cumulus option applied from experiment number 2 was replaced by another option, incorporated into the WRF in version 3.5 from the GRIMS (Global/Regional Integrated Modeling System), this change produced a very slight improvement in overestimation, while considerably reducing forecast computation time.
Experiment 8: The microphysics parameterization used (Thompson) was modified. This scheme has 2 ways of defining the concentrations of condensation nuclei (CCN) with which the forecasts start, the simplest option, which is the implicit one, uses constant quantities, but it is also possible to introduce a climatic spatial distribution or even time-varying distributions. In this case, the climatic distribution was enabled. The result, however, did not produce appreciable changes in the performance of the model for the days of the sample.
Experiment 9: The boundary layer parameterization defined in experiment four was replaced by the YSU (Yonsei University scheme). As reported in the model documentation, the GRIMS shallow cumulus scheme, introduced in Experiment 7, interacts directly with this parameterization. A small improvement in the results was obtained and also a small decrease in the execution time.
Experiment 10: This experiment did not involve changes to the model setup. There are published research results that report an improvement in solar radiation forecasts applied to photovoltaic generation when the variable solar radiation is averaged over an area around each park. As previously described, the work domain of the system has a resolution of 3 km. To estimate the value of solar radiation in each park, a two-dimensional linear interpolation is made between the grid points of the model closest to its position. In this experiment, the interpolated value was substituted for the average of all model grid points located in a circular area around the park, with a given radius. The forecasts for radii of 5, 10 and 15 km were compared. The results of using averaged values did not significantly improve the forecasts for 5 Km radii and in the cases of 10 and 15 Km they wear worse.
Experiment 11: The Thompson microphysics parameterization was replaced by the Morrison 2 moments scheme which is used in the operational configuration of SisPI, producing a slight improvement in the results and a notable reduction in the processing time.
Results and discussion
Experiments 2, 3, 5, 7, 9 and 11 produced small, gradual improvements in the overestimation, the cumulative effect of all the changes lead to a reduction in the relative error of the daily sums of 23 % in the complete set of days and PV parks of the work sample. For the subset of clear days, the relative error decreased by 3 % while for the group of cloudiest days the reduction was 36 %. Figure 4, shows that in all the parks in the sample there was a decrease in the relative errors of the daily generation sum, although uneven among them. Likewise, it is observed how the reduction is greater in the set of cloudy days. Despite this, the errors are still higher on these kind of days.
The fact that the data reported in the parks are instant hourly values introduces a large variability in them and in the correspondence with the values generated by the model, especially in the presence of cloudiness. If reported data were hourly accumulated values, both statistics would improve, but for now, although the radiation outputs of the model and the calculated photovoltaic generation can be produced in the form of hourly accumulated values, the reports from PV parks consist of instant hourly values of both solar radiation and power generation.
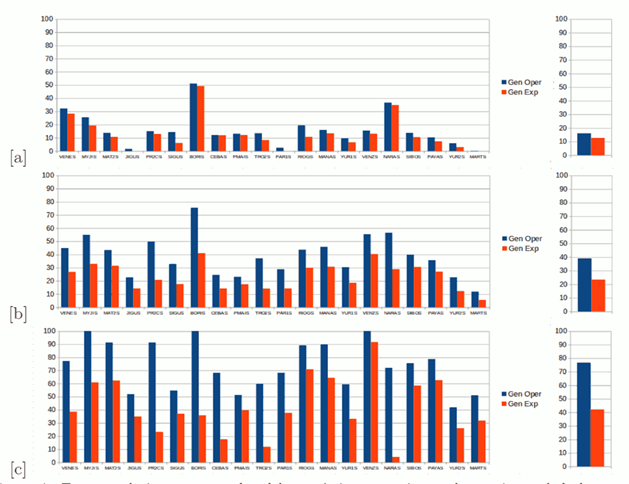
Fig. 4 Relative errors for clear days a) whole set of days b) and cloudy days c) for each PV Park obtained with the original settings of the WRF model and the settings resulting from the experiments
Taking into account that a limited sample of days and parks has been considered, the error figures obtained in the experiments are only approximations of the actual errors of the new configuration. Even so, the number of parks and the diversity of atmospheric conditions included in the set of days allow to consider the errors obtained as representative for practical purposes. With the application of the changes made in the experiments to the operational forecast, there would be, on average, relative errors of 23 %in the daily sums, considering all kinds of weather conditions. For clear days the error would be 13 % and for days with abundant cloudiness the error would be around 42 %. Figure 4 can contrast the improvement obtained with respect to the initial operating configuration.
Conclusions
The set of changes applied to the configuration of the WRF model has produced a significant improvement in the forecast of photovoltaic power generation. Many of the changes consisted on enabling new options and features that have been incorporated to the model in the later versions. The modifications in the WRF configuration scheme do not produce an important increase of the computer time it takes to run the model. If the reported values at the PV parks should consist of hourly accumulated values rather than instant values, the error figures would be better.

