


My SciELO
 Custom services
Services on Demand
Journal

Article
 English (pdf)
 Article in xml format
 Article references
 Send this article by e-mail
Indicators
-
 Cited by SciELO
Related links
-
 Similars in
SciELO
Similars in
SciELO
Share

 Permalink
Ingeniería Electrónica, Automática y Comunicaciones
On-line version ISSN 1815-5928
EAC vol.38 no.1 La Habana Jan.-Apr. 2017
ORIGINAL ARTICLE
Modeling and Event-Driven Simulation of a Photovoltaic System Controlled with Two Configurations of Perturb & Observe Maximum Power Point Tracking
Modelado y simulación orientada a eventos de un sistema fotovoltaico controlado con dos configuraciones de seguimiento del punto de máxima potencia con Perturbe & Observe.
Guillermo Gallo, Juan Ruiz, Mario Bolaños, Gustavo Osorio, Fabiola Angulo
Facultad de Ingeniería y Arquitectura, Universidad Nacional de Colombia Campus La Nubia, Manizales, Colombia.
ABSTRACT
In this article, a photovoltaic system is modeled and simulated in order to compare two different approaches of maximum power point tracking control structures. First, the system uses a Perturb & Observe maximum power point tracking control directly applied to the duty cycle, and its simulations results are compared with the experimental ones obtaining a good agreement. Then, an average current-mode control structure is coupled to the maximum power point tracking controller and simulations are performed for both systems. The system that incorporates current-mode control exhibits better response when perturbations are present, improving the settling time and reducing the steady-state oscillations.
Keywords: Solar Energy, Piecewise Linear Analysis, Average Current Control Mode, DC/DC Power Converters, Maximum Power Point Tracking.
RESUMEN
En este artículo se modela y simula un sistema fotovoltaico con el objeto de comparar dos estructuras de control para el seguimiento del punto de máxima potencia, lo cual se hace en dos partes. En la primera parte, el sistema se controla con el algoritmo de seguimiento del punto de máxima potencia llamado Perturbe & Observe, el cual se aplica directamente al ciclo útil. Así mismo, se obtienen resultados de simulación que se comparan con los resultados experimentales presentándose una alta concordancia. En la segunda parte, al algoritmo de seguimiento del punto de máxima potencia se le acopla una estructura de control en modo de corriente promediada, y se comparan a través de simulaciones la robustez de ambos sistemas ante perturbaciones. El sistema que incluye el control en modo de corriente presenta una mejor respuesta tanto en el tiempo de establecimiento como en las oscilaciones de estado permanente.
Palabras Claves: Energía solar, análisis lineal suave a trozos, control en modo de corriente promediada, convertidores de potencia DC/DC, seguimiento del punto de máxima potencia.
1.- INTRODUCTION
Photovoltaic (PV) energy is a locally available renewable resource with a lower carbon footprint which becomes essential to counteract the environmental impacts caused by the growing use of the conventional fossil fuels. In addition, recent efforts seek to make the use of this kind of energy more feasible improving the efficiency of the system and formulating governmental policies to encourage its use. For instance, the solar PV global capacity has increased from 16 GW in 2008 to 227 GW in 2015 [1], and its study has become more attractive to researches of different fields.
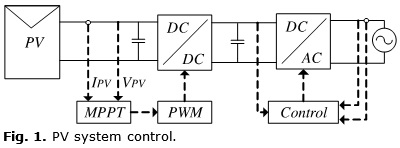
A PV system is mainly composed by the elements shown in Figure 1. The PV source transforms the sunlight into electricity, it has a nonlinear behavior with a Maximum Power Point (MPP) described by the current-voltage curve (I-V) and the power-voltage curve (P-V) [2-5]. The MPP is constantly changing according to the environmental conditions; hence it is necessary to adopt an intermediate stage between the PV source and the load, known as a Maximum Power Point Tracking (MPPT) system. MPPT guarantees the highest energy harvesting possible. The load may be represented by a resistance in the case of a non-regulated DC bus, or it can also be represented by a constant voltage load, in the case of a regulated DC bus or a battery, [6, 7].
The MPPT system is composed mainly of a DC-DC converter [8], controlled by an MPPT algorithm [9-12] which is capable of matching the electrical characteristics of the connected load to the MPP characteristics located in the P-V curve. There are some works in the literature where the MPPT algorithm directly affects the duty cycle of the converter [13], presenting an inadequate voltage or current regulation such that the converter presents an increased switching stress and losses [14]. Other works in the literature present the MPPT systems accompanied by control structures that improve the performance of its steady and transient states [14, 15]. For instance, the presence of a proportional and integral controller can reduce losses and stress, and can improve the settling time of the converter and avoids oscillation and overshoot [16, 17].
In this work, a PV System was modeled and simulated in order to compare two different approaches of MPPT control structures (Figure 2). First, the system was controlled with Perturb & Observe MPPT which is directly applied to the duty cycle and the simulations results were performed and compared with the experimental results. Then, an average current- mode control structure was coupled to the MPPT, improving the settling time and reducing the steady-state oscillations. For these tests, an event driven simulation based on hybrid systems that includes the complete PV source dynamics is proposed. The hybrid systems combine the structures of differential equation systems with discrete maps [18]. This kind of approach may present sliding dynamics that introduces simulation issues [19, 20]. In order to solve this problem, the equations that describe the sliding zones are found and considered in the modeling.
This paper is organized as follows. In section 2, a brief description of Perturb & Observe MPPT, the modeling and identification of the panel, and the hybrid model of the whole system for each control configuration are presented. In section 3, the numerical and experimental results and the comparison between the two control configurations are studied. In section 4, the corresponding conclusions and future work are discussed.
2.-PERTURB & OBSERVE MAXIMUM POWER POINT TRACKING
Solar panels are formed by arrays of solar cells, which convert radiation from the sun into useful electricity. each cell has only one MPP, and it depends on external factors such as temperature and radiation. The MPPT is done by varying the operating point of the panel in such a way that the solar system can deliver the maximum possible power. One way to change the operating point of the panel is by varying the load that is connected to its terminals. Load variations are controlled by a DC-DC power converter, which has the characteristic of increasing or reducing the resistance sustained at the panel terminals, by modifying the duty cycle.
To track the MPP means a breakthrough in improving the efficiency of photovoltaic systems. Although several methods exist in the literature, one of the most widely used algorithms is the Perturb and Observe (P & O), thanks to its performance and simplicity. This algorithm is based on perturbing a control parameter by small steps and observing the changes of the power, forcing the system to iterate around the MPP.
The fundamental principle of the control strategy is to obtain the digital PWM signal through continuous iteration of the duty cycle around an operation point. The algorithm starts by taking note of voltage VPV and current IPV at the terminals of the PV panel in order to calculate the power delivered by the source. After perturbing the duty cycle, it is necessary to measure the power again. If the system power increases, the MPPT algorithm perturbs the duty cycle in the same direction, otherwise, the perturbation is in the opposite direction.
The systems considered in this work are shown in Figure 2. They consist of two photovoltaic MPPT systems based on a boost converter structure that feeds a resistive load. The PV system exhibits a high nonlinear complexity due to the characteristics of the PV source and the nonlinear elements such as the semiconductors in the DC-DC converter. Therefore, its modeling and simulation may result in a challenging problem. For instance, different approaches have been proposed in the literature such as the linearization of the PV system and the simplification of the PV module in a constant voltage or a constant current source, [14, 21-23]. However, in order to have a deeper understanding of the system, a modeling approach that includes not only the complete dynamics of the PV source, but also the high frequency components of the DC-DC converter should be taken into account.
2.1.-POTOVOLTAIC SOURCE MODELING
A photovoltaic panel can be mathematically modeled by theoretical equations based on an equivalent circuit, leading to different models that vary in complexity and precision. In order to describe the electrical behavior of the PV source, the five parameters model of Figure 3 is used. This model is the most widely used in the literature [24, 25], where a current source is used to model the incident radiation, the diode models the polarization phenomenon and the resistances RS and RP represent the power losses by connections in series and in parallel.
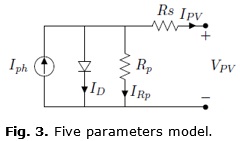
The mathematical equation that describes the model of the 5 parameters is given by the equation (1):
where:
IPV: Current at the terminals of the panel.
Iph: Photo-generated current.
VPV: Voltage at the terminals of the panel.
RS: Equivalent series resistance.
RP: Equivalent parallel resistance.
Is: Saturation current of the diode.
a: Diode ideality factor.
Ns: Number of cells connected in series.
VT: Thermal diode voltage.
The equation (1) is an implicit one and it is usually solved using numerical methods, such as Newton Raphson. However, from a simulation point of view, this approach may lead to longer simulation times and convergence problems. Therefore, it is necessary to express the equation (1) in an explicit way, using the Lambert W approach [26].
On the other hand, the PV arrays do not exhibit a linear relationship V-I, and parameters such as parasitic resistances RP and RS need to be adjusted with experimental data or with special devices because most commercial panels do not provide this information. In [24] the parameters of RP and RS are calculated from an iterative process that adjusts the V-I curve with the basic data provided by the manufacturer, such as short circuit current, open circuit voltage, current and voltage at the MPP and maximum power. In this way, it is possible to estimate the parameters for a reliable model of the solar panel without resorting to specialized measuring devices. We used the solar panel SYK50-18M. Table 1 shows its characteristic data at standard test conditions; temperature of 25°C and radiation of 1000 W/m2.
The graphs in Figure 4 were simulated with parameters RP and RS obtained as is shown in [24]. In Figure 4(a) and 4(b) show the V-I and V-P curvs, respectively, for a variant radiation. Figures 4(c) and 4(d) show the behavior of the source under temperature variations.

2.2.-HYBRID SYSTEM MODELING
Both systems of Figure 2 present three configurations or states depending on the values (ON, OFF) of the diode and the transistor (Table 2).

Figure 5 depicts the three circuit configurations of both solar systems.
The whole system can be expressed as:
where x: = [x1 x2 x3] T and i ∈ {1,2,3}. x1 is the inductor current, x2 is the voltage at the terminal of Cin and x3 is the voltage at the terminals of Cout. The matrices A and B are different for each control structure.
2.2.1.-FIRST CONTROL STRUCTURE
This system is third order and its matrices Ai and B are defined as follows:

where f(x2) is the explicit solution of the equation (1) using the Lambert W approximation, [26]. f(x2) gives the value of the panel current (IPV) for an input voltage, x2. The whole system may be represented by the hybrid automaton shown in Figure 6. In this automaton, the states si are associated to the matrices Ai and B. The conditions of transition are defined as: c1,2: u = 0; c2,1: u = 1; c2,3: x1 = 0; c3,1: u = 1. The variable u is defined as follows:

vc is the control signal with which the duty cycle is calculated.

2.2.2.-SECOND CONTROL STRUCTURE
In this case, we add a new state variable x4 corresponding to the integral of the error. Ai and B matrices are defined as follows:


Vref is calculated by the MPPT algorithm. This system can be represented by the hybrid automaton shown in Figure 6. The states si are associated to the matrices Ai and B. The conditions of transition are the same as the previous system. Furthermore, the variable u is defined by the equation (5). vc is defined as:

Where kp, ki and M are control constants. In this system, a sliding dynamic appears. This dynamic is defined by the states s1 and s2. The transition between these states is defined by the control variable vc and the ramp signal vramp. When the control signal is over the ramp signal, the DC-DC converter works in the state 1 (s1). In other case, the DC-DC converter works in the state 2 (s2). There are some parameters values that force the vc signal to slide on the ramp signal, which can block an event-driven simulation [18]. To overcome this drawback, a Filippov method is used to formulate a new field that flows onto the ramp, [19].
3.-NUMERICAL AND EXPERIMENTAL RESULTS
This section shows the simulation results and their comparison to the ones obtained experimentally for the first control structure. It also compares the system response to perturbations when both control structures are used.
Two main tests show the validity of the operation of the method P&O. The first is a sweep by varying the duty cycle of the PWM (0% - 100%), in order to observe what percentage of the cycle is at the MPP. The second test verifies that the algorithm finds the MPP and stays near to this point.

Simulations and experimental results were obtained using radiation 550W/m2, load of 25Ω and the parameters shown in Table 3. In Figure 7(a) and 7(b) a duty cycle sweep is performed from 0 % - 100 %, the signal is represented by ReferencePWM which moves of 0-10, being 10 the 100 % of D. A very good relationship between the simulated data and the data acquired experimentally is observed.
Figures 8(a) and 8(b) show how the MPPT algorithm achieves the MPP in simulation and also experimentally. The arrival times at MPP are very close and the differences lie in the impossibility to maintain constant radiation and temperature because the test took place under atmospheric conditions.
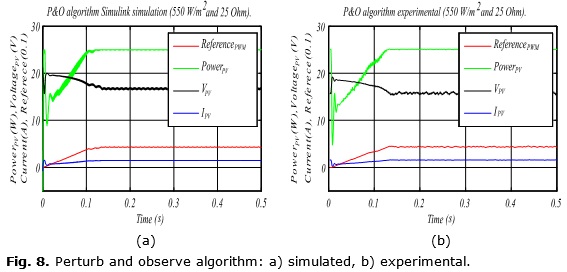
Figure 9 shows a zoom of the duty cycle signal. The values vary periodically around the MPP, even though the graphics vary somewhat, there is concordance between the numerical and experimental results.
Tests with other radiation levels are also depicted, for example in Figure 10 a MPPT for a radiation of 390W/m2 and a load of 50Ω are shown.
To compare the response to perturbation in power reference of both control structures a set of simulations were performed, using the parameters of the Table 3. The parameters of the PI controller are: kp=0.5, ki=100, and M=2. Figure 11 shows the response to perturbations in the two control structures when the power reference changes from 50W to 15W at time 0.2s and from 15W to 40W at time 0.4s. It can be seen that the second control structure presents better settling times and lower steady-state oscillations.
4.-CONCLUSIONS
In this work, simulation and experimental results of a photovoltaic system conformed by a solar source, a boost power converter, a Perturb and Observe algorithm and a purely resistive load are presented. The system was controlled with two MPPT structures. The first structure acts directly on the duty cycle of the converter. In the second structure, the MPPT control is coupled with an average current-mode control structure. The last structure improves the settling time and the steady-state oscillations of the converter; however, a sliding dynamic can appear. This kind of dynamics can rapidly deteriorate the semiconductors due to high switching frequencies. For this reason, it is necessary to tune the current-mode controller properly. Another alternative is to implement a peak current mode controller, which ensures a switching per ramp cycle.
ACKNOWLEDGEMENTS
This work was supported by Universidad Nacional de Colombia - Manizales, projects 28528 and 22546, Vicerrectoría de Investigación, DIMA under Contract no. FP44842-052-2016. Guillermo Gallo acknowledges financial support provided by "Programa doctoral de becas Colciencias, convocatoria 617-Doctorados en Colombia". Juan Ruiz acknowledges financial support provided by "Programa Nacional de Jóvenes Investigadores - convocatoria 645 - Colciencias", special agreement No. 0200 – 2014.
REFERENCES
1. Ren PS. Renewables 2016 global status report. Paris (France): REN21 Secretariat. 2016.
2. Mahmoud Y, El-Saadany EF. A Photovoltaic Model With Reduced Computational Time. IEEE Trans Ind Electron. 2015;62(6):3534–44.
3. Chin VJ, Salam Z, Ishaque K. Cell modelling and model parameters estimation techniques for photovoltaic simulator application: A review. Applied Energy. 2015; 154:500–19.
4. Tian H, Mancilla-David F, Ellis K, Muljadi E, Jenkins P. A cell-to-module-to-array detailed model for photovoltaic panels. Sol Energy. 2012;86(9):2695–706.
5. Barth N, Jovanovic R. Optimization and temperature dependence of the parameters of single and double diode electrical models for PV panels. Sol Energy Mater Sol Cells. 2016;513:87–98.
6. López J, Jr SIS, Donoso PF, Morais LMF, Cortizo PC, Severo MA. Digital control strategy for a buck converter operating as a battery charger for stand-alone photovoltaic systems q. Sol Energy. 2016;140:171–87.
7. Farahat MA, Metwally HMB, Mohamed AA. Optimal choice and design of different topologies of DC e DC converter used in PV systems , at different climatic conditions in Egypt. Renew Energy. 2012;43:393–402.
8. Rashid MH. Power Electronics Ciruits, Devices, and Applications. 4th Ed. Pearson/Prentice Hall; 2014. p. 526-530.
9. Verma D, Nema S, Shandilya AM, Dash SK. Maximum power point tracking (MPPT) techniques: Recapitulation in solar photovoltaic systems. Renew Sustain Energy Rev. 2016;54:1018–34.
10. De Brito MAG, Galotto L, Sampaio LP, De Azevedo Melo G, Canesin CA. Evaluation of the main MPPT techniques for photovoltaic applications. IEEE Trans Ind Electron. 2013;60(3):1156–67.
11. Rezk H, Eltamaly AM. A comprehensive comparison of different MPPT techniques for photovoltaic systems. Sol Energy. 2015;112:1–11.
12. Liu L, Meng X, Liu C. A review of maximum power point tracking methods of PV power system at uniform and partial shading. Renew Sustain Energy Rev. 2016;53:1500–7.
13. Femia N. Power Electronics and Control Techniques For Maximum Energy Harvesting in Photovoltaic System. Boca Ratón (FL):CRC Press; 2013.
14. Villalva MGG, de Siqueira TGG, Ruppert E. Voltage regulation of photovoltaic arrays: small-signal analysis and control design. IET Power Electron. 2010;3(6):869.
15. Mamarelis E, Petrone G, Spagnuolo G, Member S. Design of a Sliding-Mode-Controlled SEPIC for PV MPPT Applications. IEEE Trans Ind Electron. 2014;61(7):3387–98.
16. Villalva MG, Gazoli JR, Filho ER. Analysis and simulation of the P&O MPPT algorithm using alinearized PV array model. 2009 Brazilian Power Electron Conf. 2009;189–95.
17. Venturini RP, Scarpa VVR, Spiazzi G, Buso S. Analysis of limit cycle oscillations in maximum power point tracking algorithms. In: 2008 IEEE Power Electronics Specialists Conference. 2008. p. 378–84.
18. Acary V, Bonnefon O, Brogliato B. Nonsmooth Modeling and Simulation for Switched Circuits. Vol. 69. Springer; 2011. 33-105 p.
19. Filippov AF. Differential Equations with Discontinuous Rgihthand Sides. Kluwer Academic Publishers; 1988.
20. Hernández GG. Simulación de sistemas suaves a trozos empleando máquinas de estado finito= Simulation of piecewise smooth systems using finite state machines. bdigital.unal.edu.co. (cited 2016 Sep 12); Available from: http://www.bdigital.unal.edu.co/7186/
21. Urtasun A, Sanchis P, Marroyo L. Adaptive voltage control of the DC/DC boost stage in PV converters with small input capacitor. IEEE Trans Power Electron. 2013;28(11):5038–48.
22. Espinoza-Trejo DR, Bárcenas-Bárcenas E, Campos-Delgado DU, De Angelo CH. Voltage-oriented input-output linearization controller as maximum power point tracking technique for photovoltaic systems. IEEE Trans Ind Electron. 2015;62(6):3499–507.
23. Cai H, Xiang J, Wei W. Modelling , analysis and control design of a two-stage photovoltaic generation system. IET Renew Power Gener. 2016;10:1195–203.
24. Villalva MG, Gazoli JR, Filho ER. Analysis and simulation of the P&O MPPT algorithm using alinearized PV array model. 2009 Brazilian Power Electron Conf. 2009;189–95.
25. Aoun N, Chenni R, Nahman B, Bouchouicha K. Evaluation and Validation of Equivalent Five-Parameter Model Performance for Photovoltaic Panels Using Only Reference Data. Enginery Power Eng. 2014; 6(9):235-45.
26. Efstratios I, Batzelis IAR, Papathanassiou SA. An Explicit PV String Model Based on the Lambert Function and Simplified MPP Expressions for Operation Under Partial Shading. IEEE Trans Suntainable Energy. 2014;5(1):301-312.
Received: 8 de septiembre del 2016
Approved: 14 de enero del 2017
Guillermo Gallo, Facultad de Ingeniería y Arquitectura, Universidad Nacional de Colombia Campus La Nubia, Manizales, Colombia. E-mail: ggalloh@unal.edu.co.

