


Meu SciELO
 Serviços customizados
Serviços Personalizados
Journal

Artigo
 Inglês (pdf)
 Artigo em XML
 Referências do artigo
 Enviar este artigo por email
Indicadores
-
 Citado por SciELO
Links relacionados
-
 Similares em
SciELO
Similares em
SciELO
Compartilhar

 Permalink
Ingeniería Electrónica, Automática y Comunicaciones
versão On-line ISSN 1815-5928
EAC vol.38 no.3 La Habana set.-dez. 2017
ORIGINAL PAPER
Reducing Vector Space Dimensionality in Automatic Classification for Authorship Attribution
La Reducción de la Dimensionalidad del Espacio Vectorial en la Clasificación Automática para la Atribución de Autoría
Antonio Rico-Sulayes
Universidad de las Américas Puebla, Cholula, Puebla, Mexico.
ABSTRACT
For automatic classification, the implications of having too many classificatory features are twofold. On the one hand, some features may not be helpful in discriminating classes and should be removed from the classification. On the other hand, redundant features may produce negative effects as their number grows therefore their detrimental impact must be minimized or limited. In text classification tasks, where word and word-derived features are commonly employed, the number of distinctive features extracted from text samples can grow quickly. For the specific context of authorship attribution, a number of features traditionally used, such as n-grams or word sequences, can produce long lists of distinctive features, a great majority of which have very few instances. Previous research has shown that in authorship attribution feature reduction can supersede the performance of noise tolerant algorithms to solve the issues associated with the abundance of classificatory features. However, there has been no attempt to explore the motivation of this solution. This article shows how even in the small collections of data characteristically used in authorship attribution, the frequency rank of common elements remains stable as their instances accumulate and novel, uncommon words are constantly found. Given this general vocabulary property, present even in very small text collections, the application of techniques to reduce vector space dimensionality is especially beneficial across the various experimental settings typical of authorship attribution. The implications of this may be helpful for other automatic classification tasks with similar conditions.
Key words:Vector space modelling, Classifying features, Feature reduction
RESUMEN
Para la clasificación automática, el exceso de rasgos clasificatorios tiene dos implicaciones. Por un lado, los rasgos pueden no ser útiles para discriminar clases y deberían ser removidos. Por otro lado, los rasgos redundantes pueden tener efectos perjudiciales conforme el número de los mismos crece y su impacto negativo debería ser minimizado o limitado. En la clasificación de texto, donde se suelen utilizar rasgos que son palabras o se derivan de éstas, el número de rasgos extraídos puede crecer rápidamente. Para el caso específico de la atribución de autoría, diversos rasgos tradicionalmente empleados, como los n-gramas o secuencias de palabras, producen largas listas de elementos, la mayoría de los cuales tienen muy pocas instancias. Investigaciones previas han mostrado que la reducción de rasgos puede superar a algoritmos resistentes al ruido en la solución de los problemas asociados con la abundancia de rasgos clasificatorios en esta tarea. Sin embargo, falta mostrar la motivación de esta solución. Este artículo muestra como incluso en las pequeñas colecciones de texto típicas de la atribución de autoría, el rango de frecuencia de los rasgos comunes permanece estable mientras sus instancias se acumulan y nuevas palabras poco comunes son constantemente encontradas. Dada esta propiedad del vocabulario general, presente incluso en colecciones de texto pequeñas, la aplicación de técnicas de reducción de dimensionalidad del espacio vectorial es especialmente benéfica bajo las diversas condiciones experimentales de la atribución de autoría. Las implicaciones de esto podrían ser útiles para otras tareas de clasificación automática con condiciones similares.
Palabras claves: Modelado de espacio vectorial, Rasgos clasificatorios, Reducción de rasgos
1.- A CLASSIFICATION TASK WITH MANY FEATURES AND FEW INSTANCES
Authorship attribution is a text classification task that has been targeted for a number of years in both the social sciences and in computer science [1]. In the latter field, however, the assignment of an anonymous text to a subject within a list of potential authors is performed by means of automated methods. As an automatic classification problem, authorship attribution has two main stages. First, it is necessary to predetermine a number of authorship features that distinguish authors based on their text production. Then, in a second stage, these features are used by a classifier to assign anonymous texts to specific subjects in a cohort of potential authors.
In the predetermination of discriminatory authorship features, authorship attribution researchers have produced numerous proposals of new features throughout the years. Almost two decades ago, a survey of more than 300 articles targeting this classification task found over 1,000 features proposed in the literature [2]. This number has increased immensely as feature engineering has attempted to automate the identification and tagging of feature instances. Some of the new features especially suited for automatic tagging can produce long lists of features very rapidly. An example of these kinds of features are n-grams, sequences of words (or other adjacent textual elements, such as characters), widely used in authorship attribution [3-8]. These types of sequences can easily render several thousands of distinctive features even in relatively small-scale text collections. The production of long lists of features in small-scale text collections is particularly important to the task of authorship attribution because, as pointed out in [10,11], modest-sized corpora have frequently been used in this task. Partly because of the feature proliferation that characterizes authorship attribution – even when it targets small corpora – research has suggested that the predetermination of features is the most important factor to improve the classification accuracy in this task, over any subtle classifying algorithm tune-up [12,13].
As an answer to the problem of having too many features in text classification tasks in general, reduced feature lists have been produced in an attempt to single out and then apply highly discriminatory features during the classification [14,15]. Small sets of especially discriminatory features can improve the accuracy of classification tasks because they avoid the noise introduced by both redundant and poorly discriminating features. These less than optimal features are particularly inefficient when applied to new data. The potential solution behind feature list reduction has also been widely echoed in authorship attribution studies [16-19]. An alternative solution for dealing with the noise of long feature lists is the use of state-of-the-art classifying algorithms especially resistant to this noise [14]. A clear example of this type of algorithm, support vector machines (SVMs) have been widely employed in authorship attribution [3,4,7,8,15-18].
A comparison of the two aforementioned possibilities has been made in [20-21]. These studies have concluded that using feature reduction techniques renders the highest accuracy. Also when these techniques are combined with certain machine learning classifiers, they can even supersede the results of state-of-the-art, noise-resistant algorithms. However, these studies do not attempt to interpret the reasons why vector dimensionality reduction seems to be the best option in the particular task of authorship attribution. These studies have not explored whether the use of feature reduction is always beneficial or if it improves results under certain limited conditions. This article aims at filling these gaps in the literature. In this respect, it should also be mentioned that there is a recent study that deals with the topic of feature reduction and its benefits for the classification task [22]. However, it works with a very different type of data, tweets in Arabic, and it aims at comparing the results of various feature reduction techniques. This study main contribution is to show that a combination of features from all reduction techniques renders the best results for their Arabic data.
In order to explore whether feature reduction is always beneficial under varied conditions, the use of the most successful classification methods in the task currently available will be compared with the application of these same methods combined with the most extensively used feature reduction techniques. These experimental conditions will be tested on a number of small-scale corpora assembled from a larger collection of data of organized crime-related social media users’ contributions. After analyzing the composition of the various corpora here assembled, this research study offers an interpretation of why the use of feature reduction techniques renders better results than methods that exclude them in the classification task. To the best of my knowledge, there is no study that aims to offer an interpretation for this.
2.- A SET OF EXPERIMENTAL CORPORA
In order to test the performance of several algorithms, previously identified not only as common but also as the most successful ones in an extensive research survey, a number of corpora were drawn from a larger collection of data. This general collection was the result of harvesting a number of crime-related Mexican social media sites which were launched and became popular in 2010 [13, 21]. From the data retrieved from this type of social media, a cluster of 41,571 messages posted at the beginning of this internet phenomenon was explored. After preprocessing this cluster, 37,571 messages posted by 1,026 signed users were extracted to identify the most prolific users of original, self-produced content. Choosing randomly 40 of these users, and 2,000 words of original text from each, 39 corpora were created using from as few as two individuals to as many as 40 in each of them. Each individual’s text collection was further subdivided into four roughly equal aggregated samples, between 478 and 541 words in length. Therefore, each corpus contained between eight and 160 text samples to classify or assign to some subject. Given these figures, it is also worth noting that all 39 corpora were rather modest in size, compared to the collections of data common in other tasks, such as those related to topic classification or topic spotting. For the purpose of demonstration, out of the 39 corpora created Table 1 below shows only the corpora with an even number of subjects, along with the total number of tokens and features in each of them. As seen in the middle column of the table, the corpora used for the classification experiments described in the next section had between 4,096 and 82,243 tokens, respectively, for the smallest corpus with two individuals and eight samples, and the largest one with 40 subjects and 160 text samples. These figures show not only the consistency in the size of the selection of original text per individual, but also that even in the largest corpora, the size of the collection is rather small in terms of tokens. This is especially true when we compare this task with other applications of text classification that usually have both, few categories and massive amounts of data, such as spam removal or explicit content detection [14].

As for the total number of features per corpus, the 39 corpora assembled were automatically tagged for all of them. These features included several previously used [20], lexical, syntactical, and structural elements. Among the lexical elements, a list of all unigrams or types was included, plus a more limited predefined list of 132 functional-word bigrams, trigrams, and four-grams. Although the list of n-grams of superior order (where n is greater than one) is rather short, just the list of unigrams shows that even a simple list of differentiated lexical elements can grow quickly in the small-scale corpora here utilized. This list has 1,290 unigrams in the smallest corpus with 4,096 tokens, and as many as 12,996 in the corpus with 82,243 tokens. Therefore, in the smallest corpus the total number of unigrams or types is almost a third of the total number of tokens, and in the largest corpus it is about a sixth of all tokens. Namely, since these corpora are rather small, the expected logarithmic growth of unigrams is not obvious. Eventually, as text collections grow, the list of types is expected to represent a smaller proportion of the total number of words in the collection [14]. However, this is not present in small-scale corpora and this is one of the reasons why feature reduction is particularly important (as later shown in this article) for the task of authorship attribution. Also in Table 1, the rightmost column shows the total number of features for the selected corpora. Besides the above-mentioned list of unigrams and the fixed, 132-element list of superior order n-grams, the addition of 19 structural features and nine more lexical ones renders the figures in this column. As can be seen, the smallest corpus with two authors produced a 1,450-feature list and the largest corpus with 40 authors, a list of 13,156 classificatory elements.
Regarding the limited number of authors used in these experiments, [21] surveys over 32 research studies that target authorship attribution and have been published since the turn of the century. In this survey, 31 of these studies have 40 or fewer authors, which is the maximum number of authors targeted in the present study. These small numbers are not seen as a disadvantage in this task, as real-life scenarios usually deal with very short lists of suspects. Because of this, very recent studies on this task such as [22,23] include a very small number of authors, namely 12 and eight, respectively.
3.- CLASIFICATION METHODS
Two important components define the various classification methods evaluated in this article. First, a number of classifying algorithms were chosen among the most successful ones in the wide survey of 32 authorship attribution studies presented in [21]. With an application of 23 different algorithms in this body of research, not only were the most common algorithms identified, but also the most successful ones, as several studies employ more than one and compare their results. Out of the 32 studies mentioned, ten compare different classification algorithms. From this comparison, four algorithms were identified as performing better than others: discriminant analysis (DA), two forms of Bayesian classifiers – a multinomial Bayesian (MB) method and the Bayesian Bernoulli model (BB) –, and Support Vector Machines (SVMs). This survey also showed that the most common baseline algorithm in this task has been the decision tree C4.5, so its Weka implementation J4.8 was also included here. All of the classifiers were run using their default parameters in their software implementations, which were SPSS version 20 for DA and Weka version 3.7.5 for the rest of the algorithms. No changes to these parameters were tested in the current study because, as it has been noted before, research targeting this task has shown that the fine tuning of algorithm parameters is not nearly as important as the original selection of features [12,13] and their eventual reduction [20,22].
Following this idea, the second component that defines the various classification approaches tested here is the use of some feature reduction techniques. As mentioned before, these techniques are common in a number of tasks of information retrieval [14,15] and authorship attribution is no exception. Seventeen out of the 32 studies surveyed in [21] use some feature reduction technique. Among the different forms of feature reduction explored by these studies, the most common ones are some form of frequency (Fr) – relative, absolute or normalized – and information gain (IG). Along with these two techniques found to be the most popular in the literature explored, one more technique was chosen here to be tested in this context: correlation-based feature subset selection (CFS). The reason for this inclusion was that CFS was especially designed to benefit Bayesian classification protocols, such as the MB and BB algorithms here employed, and it has been shown to outperform the other techniques tested in other classification tasks [24]. As for the criteria for applying the first two techniques, any features that rendered an IG score over zero was chosen as well as features with an absolute frequency of at least four instances. The last inclusion criterion for Fr was motivated by the fact that there were four text samples per author, so in order to accomplish a perfect discriminatory feature distribution, i.e. for a feature to appear if and only if it does in a given author’s written production, there should be at least as many features as text samples per author.
Since five classification algorithms (DA, MB, BB, SVMs, and C4.5) were tested on four different sets of features (three reduced with Fr, IG, and CFS, and one non-reduced), there were 20 different classification methods applied to 39 corpora. These settings rendered a total 780 experiments. As one of the motivating research questions in this study was whether reduced feature sets consistently perform better that non-reduced sets, 195 experiments with non-reduced feature sets (five classifiers applied on 39 corpora) were compared with 585 experiments with reduced vectors (five classifiers combined with three reduction techniques on 39 corpora). The results of this comparison are presented in the following section.
4.- RESULTS
All 780 experiments summarized in this section involved the application of one algorithm, which was fed one feature list, in order to identify the authorship of text samples in one corpus. With the purpose of validating the assignment of text samples to different authors, the data was divided into training and testing samples using the standard classification procedure of n-fold cross validation [14]. In n-fold cross validation all events to be classified (text samples in this context) are divided into n sections of even size and n-1 sections are used to create a mathematical model of all classes (authors in this task). Then the events in the remaining nth section are classified completely disregarding the information about what class they belong to. This process is repeated n times leaving out each time a different nth of the data, until all data events are classified without ever looking at their actual classes. For all experiments with at least ten events, a ten-fold cross validation was used; otherwise the total number of events was used to determine the number of folds. The final result of the n-fold cross validation was calculated as its accuracy or the proportion of true positives, i.e., the number of times an event or text sample is correctly assigned to its true class or author divided by the number of possible assignments in a given experiment or experiment set [25]. This measurement corresponds to the figures in the rightmost column of Table 2 below.
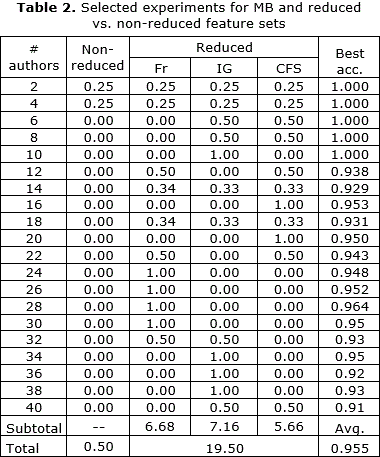
In order to compare the results of applying feature reduction techniques with long, full lists of features automatically tagged, a system was developed to give scores to these two different options. Every time a given classifier was run on a corpus with four different sets (Fr, IG, CFS, or non-reduced), if a set performed better than the others in terms of its accuracy (or true positive rate) it was given one point. If the highest accuracy was achieved by more than one set of features, the point was divided among all sets with that result. Once more for the purpose of demonstration, in Table 2 the scores of the MB classifier, which obtained the best overall results [20], are shown only for corpora with an even number of authors and the four different types of feature sets. At the rightmost end of each row, the accuracy score is also included.

Counting the number of times a feature set obtained the best results within a given corpus, the MB results shown in Table 2 can reach a maximum of 20 points, because this table shows results for the application of this classifier to this number of corpora. For the 20 corpora and 80 experiments shown in Table 2, the non-reduced feature sets obtained a score of 0.50, clearly performing below reduced feature sets, with an accumulated score of 19.5. It should be noted that there has been an attempt to make a fair comparison of the set of non-reduced feature lists against three types of reduced sets. In order to ensure this, a maximum score of one has been assigned in every combination of a corpus and a classifier. Also, all sets have been given a partial, proportional credit for those cases in which they tied with other methods. In this sense, for the data presented in Table 2, the non-reduced feature sets obtained points because they tied in the smallest corpora with all the other classifiers, but they never outperformed any of the reduced sets.
Following the comparison method above described, Table 3 below shows the total score of the various feature sets for all 39 corpora combined with each of the five classification algorithms. Something that should be noted is that the DA experiments row only shows scores for the 10 smallest corpora, which include from two to 11 authors. This is because the DA implementation used here (SPSS version 20) could not handle the very long, non-reduced lists produced by larger corpora. The problem was present even when using the non-graphical, command line interface of this algorithm implementation. For this reason, the total number of combinations between classifiers and different corpora is only 166 and not 195, as 29 experiments with non-reduced feature sets and DA could not be conducted. All experiments with DA and the reduced feature lists were in fact conducted, but since the comparison here is between these reduced sets and non-reduced sets, they have been eliminated from this table.
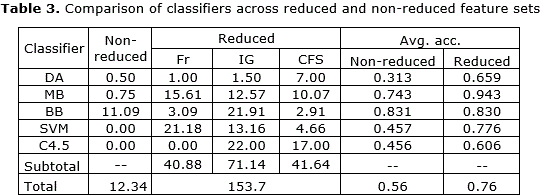
After observing Table 3, a few important facts should be pointed out. Firstly, out of the 166 possible points to be obtained in all experiments successfully conducted, 153.66 were obtained by reduced feature sets, compared to only 12.34 points scored by non-reduced sets. This means that reduced feature sets obtained 92.6% of all possible score points, clearly outperforming the use of non-reduced lists of features. Secondly, essentially all the points obtained by non-reduced feature sets were scored in experiments with the BB classifier. Therefore, this is the only algorithm that seems able to benefit from handling the long list of features itself. Even SVMs, recognized as a state-of-the-art, noise-resistant algorithm [14], did benefit from feature reduction across all experiments. In fact, along with C4.5, this was one of the two classifiers that rendered zero points for the non-reduced feature sets. It is also worth mentioning that the feature reduction technique that obtained the most points was IG, with 71.14 points out of 166. This score is almost twice as large as the score of the two other reduction techniques. Finally, in a number of experimental settings, the best-performing algorithm has been found to be the MB classifier [20]. In the comparison made in the last two columns from left to right, the MB classifier averaged the best results over the 39 corpora and the three reduction techniques, with an overall accuracy of 0.943. This averaged accuracy clearly outperforms all the other classifiers evaluated with either non-reduced or reduced sets.
4.1.- AN INTERPRETATION OF RESULTS THROUGH ZIPF’S LAW
In light of the results presented above, it is possible to conclude that feature reduction techniques are clearly and extensively beneficial under a number of different conditions to authorship attribution. However, the question remains why this is the case. From the beginning of this article, it was mentioned that that text collections have a property that makes common words remain stable in their frequency ranks as more instances of them are constantly observed and new, but rare words are added to the list of distinctive word forms. Formally expressed by Zipf, if a word type w is the most frequent one in a collection, and this is expressed as w1, where the subscript represents the frequency rank, then the frequency of any word types wi, namely the frequency of the ith type, is proportional to 1/i [14]. As expressed in the resulting formula,
wi = 1/i
the relationship between word types and their frequency rank in the collection they belong to represents a reciprocal function, as the functions plotted in Figure 1. When the absolute frequency is plotted against the frequency rank, the resulting reciprocal function describes a rectangular hyperbola, i.e. a curve convex to its origin in quadrant I of a coordinate plane. As shown in Figure 1, this vocabulary property and the expected plot for its defining function can be observed even in the small corpora used in the authorship attribution experiments conducted in this study. Figure 1 includes in two adjacent plots the frequency rank reciprocal function for corpora with two, five, and 10 authors (left plot) and for 20, 30 and 40 authors (right plot). The two plots show the expected rapid growth of rare word types in the selected corpora. For the purpose of demonstration, on the lower left corner of quadrant I, the words with one instance, or hapax legomena, have been eliminated for the largest corpus in each plot.
A simple visual examination of the two plots in Figure 1 reveals how fast all the corpora reach a minimum frequency of one instance for a large proportion of their feature list. In the left plot for corpora with two, five, and 10 authors, the largest corpus reaches the smallest absolute frequency of one in rank 1,621, although it actually contains 4,659 distinctive features. Namely, two thirds of all the features for this corpus have only one instance. Similarly, in the right plot in Figure 1, the largest experimental corpus with 40 authors reaches the one-instance absolute frequency in rank 4,713, while its full feature list is composed of 13,156 different features. For this corpus too, close to two thirds of all features have the minimum absolute frequency.
The fact that a great majority of the features tagged and extracted from all corpora have the lowest possible absolute frequency has direct implications for the use of many feature reduction techniques. As formerly mentioned, a perfect discriminatory feature distribution for a given class implies that some feature appears if and only if it does in that class, and therefore, for this distribution to take place there should be at least as many features as events for that class. In the current experimental settings all classes have more than one event -- they all have four -- and a perfect discriminatory feature distribution is impossible for most of the items on all feature lists. Although multivariate classification techniques do not require a perfect discriminatory feature distribution, plotting the frequency rank reciprocal function allows us to offer a visual interpretation of why feature reduction techniques are beneficial across the board to authorship attribution.
One additional way to formalize the very rapid decrease of the absolute frequency of vocabulary items, as their rank number grows, is using the power law cwi = cik, where k = –1 and c is some constant to define in particular collections. This function is equivalent to log cwi = k log i [14]. Therefore, a log-log graph of Zip’s function log cwi = log c – log i describes a line with slope –1 (as the straight line in Figure 2). The plot of log 10 of the rank against log 10 of the absolute frequency should be close to this line, as it is in Figure 2.
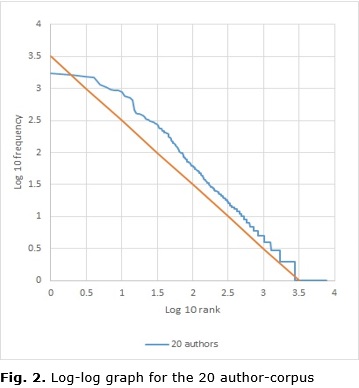
Figure 2 shows how plotting the log-log graph for the corpus with 20 authors describes a line which is not particularly fit to the –1 slope line, but that in general does follow the model predicted by Zipf. Log-log graphs have a number of advantages one being a better visualization of details for both small and large values of y [26,27]. With this kind of graph, it is not necessary to eliminate hapax legomena, as described for Figure 2, to avoid a long line extending over axis x for the large number of features with a frequency or y value of 1. As for large values of y, log-log graphs can also deal better with the skewedness of these values, which is particularly important for linguistic Zipf’s distributions where just a few features may be plotted next to the y axis. In this study in particular, when several corpora with different sizes were plotted on one graph for the frequency rank reciprocal function, as in Figure 2, the higher frequency features for the smaller corpora became very hard to distinguish.
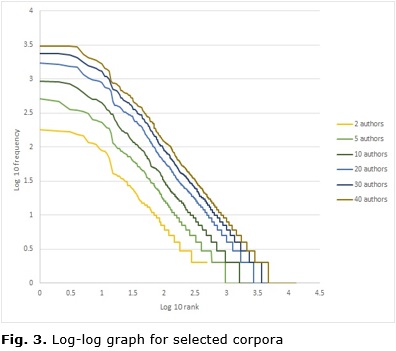
The corpus with 20 authors discussed in Figure 2 is not the only one that follows the model predicted by Zipf for a log-log graph, and the benefits of this type of graphical representation are not exclusive to it. In Figure 3 below, all the corpora formerly selected for Figure 1 have been plotted in a log-log graph, without a –1 slope line, for purposes of simplicity. As shown in Figure 3, all six corpora plotted describe a line close to a –1 slope and reproduce the lexicon properties predicted by Zipf.
Also in Figure 3 below, the log-log graph of Zipf’s function for the six corpora with two, five, 10, 20, 30 and 40 authors has one more advantage over the frequency rank reciprocal function plotted in Figure 2. It allows us to inspect the consistency of several corpora in just one plot, since there is virtually no overlapping among the various functions plotted. This last feature adds to the formerly-mentioned virtues of log-log graphs, in particular the better visualization of small and large values of y for which it allows.
5.- CONCLUSION
If Zipf’s law properties regarding lexicon are at least generally true for the small-scale text collections employed, as it has been formally shown in the last section, an explanation of the results presented here can be offered. Zipf’s prediction of a very fast decrease of the absolute frequency of features, as they rank lower in a frequency-ordered list of elements, has implications for any text classification task. However, when a task of this sort uses very small corpora where the total number of types can represent between a third and a sixth of the number of all tokens (as mentioned in Section 2), and the total number features with the lowest possible frequency represents two-thirds of all items (as shown in Section 4.1), this rapid decrease of feature frequencies has even more significant implications. This is especially true for a task like authorship attribution in which, as the data increases, so does the number of classes. Under these conditions, where there are fewer opportunities for lexical items already in the list of types to be repeated in the various classes of the collection, an evaluation of them for their discriminatory power is particularly useful. As shown in the former section, all classifying algorithms evaluated benefited from being combined with a feature reduction technique. Even the one that showed the least improvement, BB, obtained its best results in 28 out of 39 experiments, almost three-fourths of the time, when combined with a reduced feature set. Other algorithms, such as state-of-the-art SVMs, always perform to their best in combination with these feature reduction techniques. The consistency shown in the experiments performed seems to have a plausible explanation in Zipf’s vocabulary properties.
It only remains to be said that new applications of the findings discussed in the current study should be explored. In the immediate context, some other text classification tasks, such as complex sentiment analysis or argument detection, may also benefit from feature reduction across the board. Beyond the context of text classification, if the conclusion and interpretation here offered hold true for other classification tasks with similar feature distributional patterns, this discussion would prove valuable for the much wider scientific community that exploits automatic classification.
REFERENCES
1. Solan LM. Intuition versus algorithm: The case of forensic authorship attribution. Journal of Law and Policy. 2013;21(2):551-576.
2. Rudman J. The state of authorship attribution studies: Some problems and solutions. Computers and the Humanities, 1998;31:351-365.
3. Graovac J, Kovacevic J, Pavlovic-Lažetic G. Hierarchical vs. flat n-gram-based text categorization: Can we do better? Computer Science and Information Systems. 2017;14(1):103-121.
4. Howedi F, Mohd M. Text classification for authorship attribution using Naive Bayes classifier with limited training data. Computer Engineering and Intelligent Systems. 2014;5(4):48-56.
5. Ishihara S. A likelihood ratio-based evaluation of strength of authorship attribution evidence in SMS messages using n-grams. International Journal of Speech, Language and the Law. 2014;21(1):23-49.
6. Johnson A, Wright D. Identifying idiolect in forensic authorship attribution: An n-gram textbite approach. Language and Law / Linguagem e Direito. 2014;1(1):37-69.
7. Kumar S, Chaurasia MA. Assessment on stylometry for multilingual manuscript. IOSR Journal of Engineering. 2012;2(9):1-6.
8. Naga Prasad S, Narsimha VB, Vijayapal Reddy P, Vinaya Babu A. Influence of lexical, syntactic and structural features and their combination on authorship attribution for Telugu text. Procedia Computer Science. 2015;48:58-64.
9. Baker P, editor. Contemporary Corpus Linguistics. London (UK): Continuum; 2009.
10. Abbasi A, Chen H. Writeprints: A Stylometric Approach to identity-level identification and similarity detection. ACM Transactions on Information Systems. 2008;26(2):1-29.
11. Koppel M, Schler J, Argamon S. Authorship attribution in law enforcement scenarios. Journal of the American Society for Information Science and Technology. 2009;60(1):9-26.
12. Koppel M, Schler J, Messeri E. Computational methods in authorship attribution. In: Gal CS, Kantor P, Saphira B, editors. Security Informatics and Terrorism: Patrolling the Web. Amsterdam: IOS; 2008. p. 111-119.
13. Rico-Sulayes A. Statistical authorship attribution of Mexican drug trafficking online forum posts. International Journal of Speech, Language and the Law. 2011;18(1):53-74.
14. Manning CD, Raghavan P, Schütze H. Introduction to Information Retrieval. New York: Cambridge; 2008.
15. Ramya M, Pinakas JA. Different type of feature selection for text classification. International Journal of Computer Trends and Technology. 2014;10(2):102-107.
16. Altheneyan AS, Menai ME. Naïve Bayes classifiers for authorship attribution of Arabic texts. Journal of King Saud University – Computer and Information Sciences. 2014;26:473-484.
17. Ayogu II, Olutayo VA. Authorship attribution using rough sets based feature selection techniques. International Journal of Computer Applications. 2016;152(6):38-46.
18. Günal S. Hybrid feature selection for text classification. Turkish Journal of Electrical Engineering and Computer Sciences. 2012;20(2):1296-1311.
19. Savoy J. Feature selections for authorship attribution. Proceedings of the 28th Annual ACM Symposium on Applied Computing. Coimbra; Portugal; 2013.p. 939-941.
20. Rico-Sulayes A. Técnicas de reducción, algoritmos resistentes al ruido o ambos: Opciones para el manejo de rasgos clasificatorios en la atribución de autoría. Research in Computing Science. 2014;80:43-53.
21. Rico-Sulayes A. Quantitative authorship attribution of users of Mexican drug dealing related online forums. PhD Thesis. Georgetown University; 2012. Available in: https://repository.library.georgetown.edu/bitstream/handle/10822/557726/
22. Al-Ayyoub M, Jararweh Y, Rabab'ah A, Aldwairi M. Feature extraction and selection for Arabic tweets authorship authentication. Journal of Ambient Intelligence and Humanized Computing. 2017; 8(3):383-393.
23. Akimushkin C, Amancio DR, Oliveira ON. Text Authorship Identified Using the Dynamics of Word Co-Occurrence Networks. PLoS ONE. 2017;12(1):1-15.
24. Doshi M, Chaturvedi SK. Correlation based feature subset selection (CFS) technique to predict student performance. International Journal of Computer Networks & Communications. 2014;6(3):197-206.
25. Rico-Sulayes A. An Evaluation Measurement in Automatic Text Classification for Authorship Attribution. Revista Ingenio Magno. 2015;6(2): 62-74.
26. Kelly D, Jasperse J, Westbrooke I. Designing Science Graphs for Data Analysis and Presentation. Wellington (New Zealand): Science & Technical Publishing; 2005.
27. Feng C, Wang H, Lu N, Chen T, He H, Lu Y, Tu XM. Log-transformation and its implications for data analysis. Shanghai Archives of Psychiatry. 2014;26(2):105-109.
Received: march 24th, 2017
Approved: september 4th, 2017
Antonio Rico-Sulayes, Universidad de las Américas Puebla, Cholula, Puebla, Mexico. E-mail: antonio.rico@udlap.mx.

