


My SciELO
 Custom services
Services on Demand
Journal

Article
 English (pdf)
 Article in xml format
 Article references
 Send this article by e-mail
Indicators
-
 Cited by SciELO
Related links
-
 Similars in
SciELO
Similars in
SciELO
Share

 Permalink
Ingeniería Mecánica
On-line version ISSN 1815-5944
Ingeniería Mecánica vol.20 no.2 La Habana May.-Aug. 2017
Original Article
Comparative study of the power consumption in two different configurations of medium-length slurry pumping systems
Estudio comparativo del consumo de energía en dos diferentes configuraciones de sistemas de bombeo de relaves de mediana longitud
Max Túlio Castro FerreiraI, Yuneski MasipII, Rodrigo J P de BarcelosI, Jacqueline Pedrera YanesIII, Guillermo VilaltaIV
IFederal University of São João del-Rei, Thermal Sciences and Fluids Department. Minas Gerais. Brasil
IIPontificia Universidad Católica de Valparaíso. Mechanical Engineering School. Valparaíso. Chile.
IIIUniversity of São Paulo, Mechanical Engineering Department. São Paulo. Brazil.
IVFederal University of São João del-Rei, Thermal Sciences and Fluids Department. Minas Gerais. Brasil
ABSTRACT
The hydraulic transport of slurries by means of piping systems is characterized by an elevated power consumption. This study investigates the relationships among the four variables that define the slurry transportation system: length L and diameter D of system and granulometry D50 and concentration Cv of iron ore with aiming to minimize the power requirements. A thermodynamic energetic indicator I, was computed via numerical simulation. Optimization of the computational effort was carried out by using the 2k factorial design. The results show that all variables are significant on the indicator I, with pipe length having the greatest amplitude of variation in the response. The second order interactions indicates that only two combinations are correlated, namely the granulometry and length and diameter and length. Trough the statistical approach, predictive models have been obtained. The results allow designers to identify which of the analysed pipeline system layouts represents the minimum power requirement.
Key words: energetic indicator, slurry pumping, predictive models, numerical simulation.
RESUMEN
El transporte hidráulico de relaves por medio de sistemas de tuberías se caracteriza por un elevado consumo de energía. El presente trabajo investiga la relación entre las variables que definen el sistema de transporte de relaves: la longitud L y el diámetro de la tubería D del sistema y la granulometría D50 y la concentración volumétrica Cv del mineral de hierro con el objetivo de minimizar los requerimientos de consumo de energía. Un indicador termodinámico I fue calculado mediante simulación numérica. La optimización del esfuerzo computacional se realizó a través de un diseño factorial 2k. Los resultados muestran que los cuatro factores estudiados son significativos en el indicador I, siendo L la que presenta mayor amplitud de variación en la respuesta. La interacción de segunda orden, indicó que sólo dos combinaciones de variables están correlacionadas, D50 y L y D y L. A través de esta técnica estadística, modelos predictivos pueden ser obtenidos. Los resultados permiten a los diseñadores identificar cuál de los esquemas analizados presenta el requerimiento mínimo de energía.
Palabras clave: indicador energético, bombeo de relave, modelos predictivos, simulación numérica.
INTRODUCTION
Over the past decades, Brazilian mining industry has been experienced a vigorous growth, playing a major role in the global mining scenario, alongside other countries of BRICS like Russia, India and China. In the year of 2015, the Brazilian production of metallic compounds (as iron, aluminum and gold), reached more than US$ 19,5 billion, being the 62 % associated to the beneficiated iron ore, which has his largest production in the state of Minas Gerais, Brazil. Such a state answers for almost 70 % of the Brazilian traded iron ore. Such huge production is invariably followed by a significant and raising generation of wastes named tailings [1]. In Brazil, the production of iron ore tailings was around 220 million of tons in 2015, corresponding to 44,14 % of the total quantity of tailings produced in the country.
Due to the increasing volume of tailings, the construction of engineered structures to store it became a need. The tailings dams are the most common option of in Brazil. The materials handling among the beneficiating process steps is the activity identified as having the highest potential for energy efficiency improvements and to reach it, hauling operations play a important role [2]. The tailing hauling can be done by different means and important options are the pipeline systems. Transport of solids as slurry, through pumps and pipelines on large scale, has been lately accepted as a cost-effective, technically and economically suitable rather than truck hauling and conveyor belts, mostly when the access to remote areas is a need and there are terrain constraints [3].
Despite the large amount of water and energy usually required, long distance slurry pipelines are highly efficient when compared to other transport alternatives [4]. However, the 46 % of mining operational costs stands for transport operations and the demand for reductions on energy consumption on mining industry is a need [5], reason for which the design of efficient slurry pumping systems is really relevant. Pumps systems are a huge opportunity to improve energy efficiency and reduce carbon dioxide emissions in the mining industry.
Different authors suggest different criteria to evaluate slurry transportation by pipeline systems and to optimize its performance. The pipeline systems optimization have to be carried out considering the slurry rheological properties; particle size and shape and solid concentration, once the performance of pumps when operating with pure water gets reduced in the presence of suspended solids [6]. Numerical tools and computational fluid dynamics (CFD) have been employed to help on these evaluations [3, 6. 7].
Taking into account the variables involved in the slurry transportation, it would be interesting to use an appropriate simulation strategy that allows obtaining objective results for an adequate analysis. The design of experiments (DOE) is the most efficient and applicable statistical methodology to organize the experimentation, allowing the acquisition of the largest amount of information with the fewest number of experiments.
It is well known that slurry transportation systems are characterized by four independent variables; two associated to slurry ore rheology (volumetric concentration, Cv and granulometry D50) and two related to piping system (length and diameter). In this sense, the objective of this work is to obtain, among the four variables characterizing the medium-length slurry systems design, the best combination of variables to minimize the energy requirement.
METHODS AND MATERIALS
Description of the slurry transportation systems
Figure 1 illustrates a schematic representation of the different pumping systems used in this study. The systems consist of two reservoirs, a pumping station and a piping system. According to the objectives of this research, the difference between the two pumping systems, named 1P and PS, is associated to the number of pumps. 1P stands for a system which has only one pump, located at the beginning of the system. In the PS system, two pumps are connected in series and are located at the pumping station also at the beginning of the system.
The reservoir placed to the left in figure 1 is the suction tank, where the solid particles of iron ore are mixed with the carrier fluid (water) to form the slurry that is designated for storage at the tailings´ dam (the reservoir on the right side of Figure 1). Both reservoirs are considered as large tanks, i.e., the velocity of the free surface may be considered as zero, and the pressure on this surface is atmospheric.
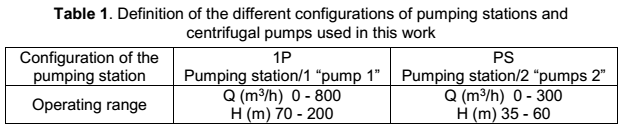
The pumps used in this study are centrifugal pumps. To perform an independent analysis of any commercial manufacturer of slurry pumps, and after a wide and careful review of the technical literature, it was decided to designate the pumps as “pump1” and “pump 2” and to rank them by their operating range. table 1 presents the information for the two different systems and pumps used in this research.
Two independent variables corresponding to slurry transportation systems were defined: the pipe length L and the diameter D. The values selected for these two variables agreed with the criteria used in the mining industry. The selected values for pipe length range between 500 m (lower level) and 2.000 m (higher level). For all cases, the horizontal pipe after the pumping station and the inclined pipe have the same lengths. To keep the system length constant during the simulation, possible adaptations to the length of the final horizontal section length immediately prior to the discharge tank may be applied. The pipe diameter ranges from 8 in (lower level) to 10 in (higher level). A topological elevation of 40 m was kept constant for all cases.
In this study, the pumped media is a non-settling slurry. The slurry has the characteristics of shear thinning and acting like a power law fluid [8]. The main physical properties of iron ore slurry are a function of the volumetric concentration, Cv (%), granulometry, D50 (mm), and iron ore specific gravity (1 unit), which were determined by applying the typical equations from the literature [9]. In the present research, Cv and D50 were considered to range from minimums of 5 % and 100 mm, respectively, to maximums of 10 % and 300 mm, respectively.
Numerical simulations
A demo version of AFT Fathom was used to perform the simulations. The simulations were performed by using the Settling Slurry Modeling (SSL) module that allows, among other capabilities, the modelling of the effects corresponding to pumping fluids containing settling solids.
Although some centrifugal pump manufacturers design such a machine to be specifically used for slurry pumping, their performance curves are defined for water because of the inability to previously define specific operating conditions for slurries. Hence, the first step in the simulation is to define the operating conditions for each of the systems illustrated in figure 1 while considering pure water as the pumped fluid. In these cases, the pumps performance curves are defined in the operational range previously established in table 1. By combining the provided pump information with a simulation, it is possible to obtain all of the operating parameters: volumetric flow rate, head rise, pump power input and efficiency.
The head developed by a centrifugal pump that is handling slurry differs from the head of a pump handling water depending upon the amount, size, shape and specific gravity of solid particles in the slurry. The difference is estimated by the Head Ratio (HR), which is a coefficient defined by the ratio between the head performed by the pump when transporting slurry over the head observed when the fluid is water in the same conditions. Similarly, it is also defined the Efficiency Ratio (ER), which stands for the ratio between the efficiency noticed when transporting slurry and the efficiency for water in the same conditions. Both the HR and the ER can be determined by using Cave’s Abacus [9].
The energetic indicator I, the object of analysis in this study, is defined as follows:
Where Nm is the mechanical power of the pumps, Q is the volumetric flow rate, H is the head, r is the density of the slurry (as a function of Cv, D50 and the specific gravity of the solid), and h is the efficiency of the pump.
Design of experiments
The DOE is a statistical technique enables designers to simultaneously determine the individual and the interacting effects of variables that could affect the output in any process or system. An interaction can be defined as the combined effect of two or more factors in a response [10].
The first steps in this experiment were to define the response, variables, the variables' levels and the type of design to conduct the simulations. For this research, the response is the energetic indicator I. The analysed variables with regard to the piping system were the length L, the diameter D; and the volumetric concentration Cv and the granulometry D50, relative to the slurry’s properties. The levels of these variables were previously defined as well as their lower and higher levels.
The two-level full factorial (2k) is probably the most common and intuitive strategy of experimental design. However, a potential concern when using this type of design is the assumption of linearity of the effects of the factors, which is sometimes compensated by the knowledge of previous studies. Nevertheless, according to the best knowledge of the authors, no previous research results relate to the application of DOE in the energetic assessment or in the design of slurry transportation systems. Therefore, any linearity or trend among the relationships between the factors that define this phenomenon are unknown. For this reason, a Central Composite Design (CCD) technique was used. To apply this technique, central values for each factor were defined: L = 1,000 m, D = 9 in., Cv=7,5 % and D50 = 200 m. A CCD with 4 factors results in a plan comprised of 31 simulations in total.
The statistical software Minitab, Windows release 17.0 standard version, was used to carry out the statistical analysis allowing the determination of the main factors' effects, the factors' interaction effects, the response surface and the response predictive models.
RESULTS AND DISCUSSION
A total of 31 simulations for each system configurations were carried out, and the influence of each the four independent variables on the energetic indicator I were analysed. The value of I obtained in the parametric study has been fit to full quadratic response surface models, which include the main effects of the independent variables, the interactions among them and the quadratic terms.
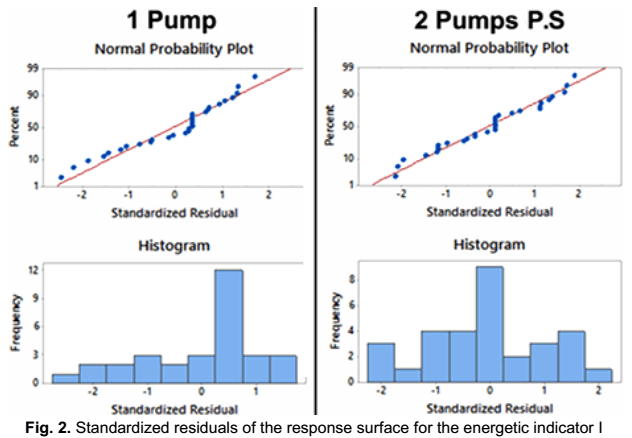
Figure 2 illustrates the normal probability plots and the histograms of the standardized residuals corresponding to the models for I. From these graphs, the accuracy of each model can be assessed. Firstly, it should be noted that most of the residuals for both system configurations (1P and PS) are small and only 2 out, of 31 samples, have an absolute value quite larger than 2, which is the value typically accepted to identify outliers. Secondly, the residuals of the two outputs do not depart substantially from a straight line in the normal probability plot, thus confirming that they are very-nearly normally distributed. Finally, as shown in the histograms, the residuals are centred on the zero value without any noticeable skewness. Hence, the quadratic response surface models employed fit the data satisfactorily.
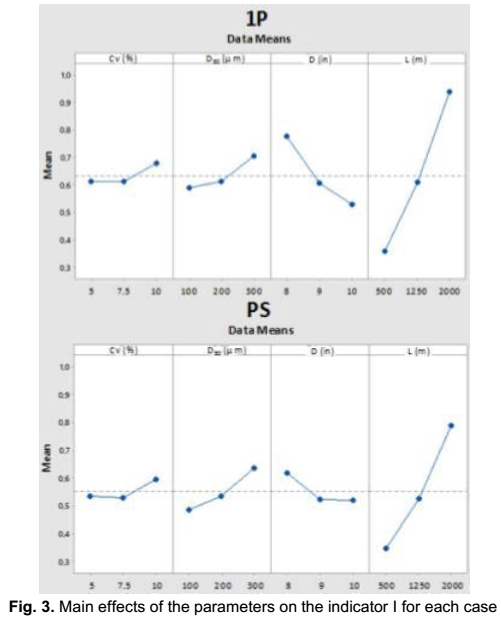
Figure 3 depicts the main effects that the level changes of L, D, D50 and Cv have on I for each of the slurry piping system configurations. Points in the graphs correspond to the arithmetic mean of I, which was calculated for each value of the factors through the 31 experiments, so that the average effect of each variable is evidenced. As shown in figure 3, the behaviour of the response I, due to the variation of the factors from one level to another, has the same trend regardless of the slurry piping system. Among the four variables, L has the greatest amplitude of variation between the highest and the lowest level. The minimum values of I are reached when L, Cv and D50 are in their lower levels and when D is in its higher level.
These results can be best explained from a fluid mechanics point-of-view. The factor L has the greatest effect on the energy consumption for any of the analysed systems. The increase of this factor, from 500 m to 2000 m, keeping other factors equal, promotes a significant increase of approximately 60 % of the indicator I in all cases investigated. This behaviour can be justified by the fact that, when the system length increases, there is a significant increase in distributed head losses, and the pump must thus provide a higher energy (per unit weight) to transport the slurry to the tailings’ dam.
The change in pipe diameter from 8 in. to 10in. promotes an average reduction of 22,4 % of I in all simulations conducted, keeping all other factors constant. This behaviour is due to the reduction of distributed head losses. It is well-known that doubling the pipe diameter can reduce head losses by 27 times. It should be noted that L and D have an inverse influence on head loss. Therefore, when D is increased, the head loss diminishes, and the power consumption is consequently lower.
A change from the lower level to the higher level of granulometry, that is, from 100mm to 300 mm, produces an average increase of I of 24 %, keeping the remaining variables constant. By increasing the granulometry, the size and the weight of the solid grains also increases. To avoid the sedimentation of particles, a greater energy should be supplied to increase the slurry flow velocity.
The volumetric concentration has the smallest effect on I when compared with other factors, wherein an average increase of I of 9,2 % occurs when Cv varies from its lower (5 %) to higher level (10 %). The influence of Cv on I can be explained by the increase of the solid volume in the slurry.
In the present work, a thermodynamic indicator has been proposed. The novelty of this approach it is to consider the energy consumption for transporting iron ore waste in easy and quick way but without take into account any other effects. By the importance of slurry transportation systems energetic characterization, significant research efforts have been devoted towards establishing the appropriate features to ensure the efficient transport of slurries. The slurry system costs are related to efficiency in the energy conversion, wherein ‘efficiency’ has several possible interpretations. These interpretations can be related, for example, to the availability of natural resources, to a better understanding of the processes, or to any other novel approach proposed by considering the importance of using relevant efficiency concepts in calculating the energy cost of pumping liquids [11].
Motivated by a particularly constraining absence of water in Chile, in [12] it is analysed energy efficiency in long-distance slurry transport by considering the cost of water, in addition to energy cost. According to this criterion, when water is considered in the costs of a transportation system, the optimal concentration of the solids to be transported is an increasing function of the throughput. Their results also show the significance of the system length and diameter, despite the different approach used. This result improves early findings, in which the weight of transported material relative to the use of water was not correctly defined [13,14].
Apart from these main effects, the interactions among the factors were also investigated by performing an analysis of variance (ANOVA) of the results. In order to evaluate I considering the interactions among the factors, a significance level was defined. The p-value of each second order interaction was calculated, and those with a value smaller than 0,05 were considered significant (i.e., a confidence interval of 95 %). According to this criterion, it was determined that the only significant interactions on I are those between D50 and L, as well as between D and L, for both pumping systems examined. The interaction between these two pairs of variables is shown in figure 4. At the top of the figure, it is possible to observe the relationship among D50, L and I for 1P and PS system configurations. The granulometry exerts almost no influence when L is at its lower level, but its significance rises noticeably as L goes toward to its higher levels.
At the bottom of the figure, it is possible to observe the relationship among D, L and I for the two system configurations. The value of I diminishes as D increases and L decreases. The indicator I has a minimum value when D is approximately 9 in. for a lower value of L. The curvature of the response surface approximately for 9 in. for an L value of 500 m confirms this effect. Same trend was obtained by [7], by using of a similar layout and positive displacement pumps.
The response surfaces, i.e., prediction models based on the experiments, can be obtained from previous results. These regression models can be used to predict the response I at any point in the space spanned by the variables in the design. Two important parameters should be assessed to validate the investigated models. The first is the coefficient of determination, R2adj, and the second is the standard error of the regression, S. The value of R2adj for all experiments is higher than 90 %, and S is approximately zero. Both parameters meet appropriated values, testifying that the predictive models obtained herein are acceptable models from statistics standpoint.
From an analysis of the main effects of the independent variables and of the interaction among some of these variables, as previously discussed, the predicting models can be built. The resulting models are expressed by equations 2-3 for configurations 1P and PS, respectively:
 (2)
(2)  (3)
(3)The R2adj. and S values for equations 2-3, respectively, are as follows: R2adj.=0,988 and S=0,028 and R2adj.=0,9815 and S=0,026.
It is apparent that these models have two components. The linear part, which is associated with the main effects, and the non-linear term, which corresponds to the interactions between the parameters.
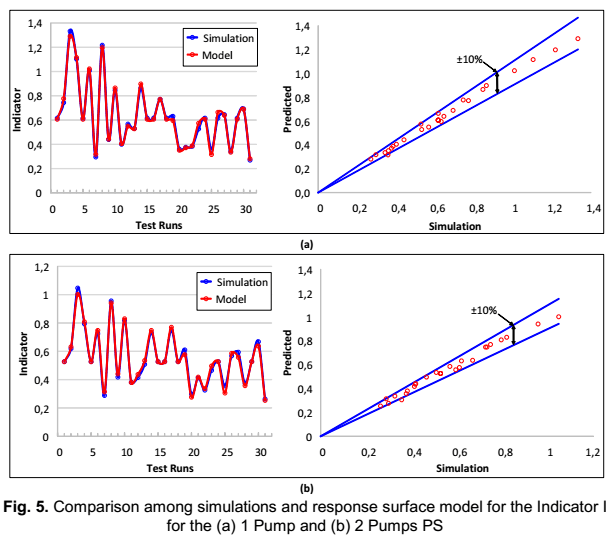
Figure 5 illustrates the comparison between the simulation results and the results obtained via the reduced prediction models. As can be observed in the right side of figure 5, a difference of less than 10 % is obtained in all cases, wherein the fitted values are compared with those obtained in the simulations. These results indicate that a good agreement exists between the models and simulations; therefore, an appropriate response for I can be obtained by using the models.
From the obtained models, and considering the main objective of the present study, the optimal combination of independent variables required to minimize the indicator I was determined under the assessed conditions.
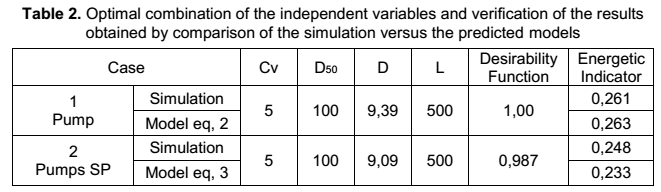
The Standard Interval Global Engine (SIGE) method, as defined by [15], was applied to obtain the optimal combination. Table 2 shows the optimal combinations of the independent variables for the pumping systems analysed in the range of investigated values. From these results, it is possible to observe that the optimal values for optimizing (minimizing) I are as follows: Cv=5 % (lower level), D50= 100 mm (lower level), L = 500 m (lower level) and D varying between 9,39 in and 9,17 in as a function of the pumping system. As is well-known, this value of the diameter is not a normalized value. Earlier statistical analysis established that 9 in. is the optimal value, but from a practical point-of-view, it is not possible to meet this condition. Therefore, a value of 10 in. was selected. This result is in agreement with the physical foundation of the study phenomena, as previously discussed.
It is important to highlight that the desirability function is an indicator that provides an estimate of the extent to which the solution suggested by SIGE meets the requirements of the response I. The desirability function ranges from 0 to 1, where values close to 1 correspond to a good fit between the results obtained via models and simulations [16, 17].
Taking the global results of the optimization into account, it is possible to observe that the indicator I decreases by 11% when the layout with two pumps (PS) is compared with that of only one pump (1P). It is worth noting that in the 1P configuration, the pump has a higher operating range than the pumps used in the PS layout and resulting in a direct economic impact on operating and maintenance costs. However, the results obtained are unable to explicitly demonstrate if the PS configuration meets the most effective combination of factors for minimizing I. Choosing the best configuration will likely depend upon other variables not directly associated with the factors studied here. In this case, factors related to logistical conditions in real situations should be analysed.
An interesting result of this research postulates that between the piping system variables and slurry variables, those related to the piping system are the significant ones.
CONCLUSIONES
The results of this work show that, regardless of the limited interval of values of the studied variables, the results confirm that the new methodology presented herein, which combines numerical simulation and the design of experiments, has a huge potential to offer relevant information. This knowledge must offer to field's professionals important tools decision, allowing the obtainment of an appropriate combination of variables to minimize energy consumption in slurry transportation systems.
ACKNOWLEDGEMENTS
The authors are grateful to the Facultad de Ingeniería of the Pontificia Universidad Católica de Valparaíso-Valparaiso, Chile, for the financial support through the INNOVA-Proyecto Ingeniería 2030.
REFERENCIAS
1. Schoenberger E. Environmentally sustainable mining: The case of tailings storage facilities. Resources Policy. 2016;49:119-28.
2. Awuah-Offei K. Energy efficiency in mining: a review with emphasis on the role of operators in loading and hauling operations. Journal of Cleaner Production. 2016;117:89-97.
3. Kaushal D. CFD modeling for pipeline flow of fine particles at high concentration. International Journal of Multiphase Flow. 2012;43:85-100.
4. Ihle C. A cost perspective for long distance ore pipeline water and energy utilization. Part I: Optimal base values. International Journal of Mineral Processing. 2013;122:1-12.
5. Levesque M, Millar D, Paraszczak J. Energy and mining-the home truths Journal of Cleaner Production. 2014;84:233-55.
6. Tarodiya R, Gandhi B. Hydraulic performance and erosive wear of centrifugal slurry pumps-A review. Powder Technology. 2017;305:27-38.
7. Barcelos R, Araújo E, Vilalta G. Análise da influência das propriedades do minério de ferro no bombeamento de polpas de rejeitos minerais em sistemas com bombas volumétricas via simulação e planejamento de experimentos. In: XV CONEMI – IX SEEMI; Novo Hamburgo, RS: Universidade FEEVALE; 2015. [Citado diciembre de 2016] Disponible en: https://goo.gl/3XMOvy
8. Wood D, Walters T. Operational problems in pumping non-settling slurries resolved using an improved laminar flow pipe fitting loss model. In: 28th International Pumps Users Symposium; Houston, USA: AFT; 2012. [Citado diciembre de 2016] Disponible en: http://www.aft.com/learning-center/technical-papers/359-resolving-
9. Chaves A. Teoria e Prática do tratamento de minérios. Rio de Janeiro, Brasil: Signus; 2009.
10. Pedrera J, Ortiz J, Vilalta J. Significant variables in initial dilution process in submarine outfalls systems. Alternatives comparison. In: International Symposium of Outfall System; Otawa, Canada: Otawa University; 2016. [Citado diciembre de 2016] Disponible en: https://www.researchgate.net/publication/315481088_Significant_variables_in_initial_dilution_process_in_submarine_outfalls_systems_Alternatives_comparison
11. Ihle C, Tamburrino A, Montserrat S. Identifying the relative importance of energy and water costs in hydraulic transport systems through a combined physics- and cost-based indicator. Journal of Cleaner Production. 2014;84:589-96.
12. Ihle C. The least energy and water cost condition for turbulent, homogeneous pipeline slurry transport. International Journal of Mineral Processing. 2016;148:59-64.
13. Wu J, Graham L, Wang S, et al. Energy efficient slurry holding and transport. Minerals Engineering. 2010;23:705-12.
14. Edelin D, Czujko P, Castelain C, et al. Experimental determination of the energy optimum for the transport of floating particles in pipes. Exp Thermal Fluid Sci. 2015;68:634-43.
15. Hansel E, Walster G. Global Optimization using Interval Analysis. New York, USA: Marcel Dekker; 2004.
16. Myers R, Montgomery D. Response Surface Methodology. New York, USA: Wiley Interscience; 2002.
17. Murphy T, Tsui K, Allen J. A review of Robust design for multiple responses. Research in Engineering Design. 2005;15(4):201-15.
Recibido: 17/2/2017
Aceptado: 15/4/2017
Guillermo Vilalta, Federal University of São João del-Rei, Thermal Sciences and Fluids Department. Minas Gerais. Brasil. Correo electrónico: gvilalta@ufsj.edu.br

