


Mi SciELO
 Servicios personalizados
Servicios Personalizados
Articulo
 texto en
  Inglés (pdf)
 Articulo en XML
 Referencias del artículo
 Enviar articulo por email
Indicadores
-
 Citado por SciELO
Links relacionados
-
 Similares en
SciELO
Similares en
SciELO
Compartir

 Permalink
Mendive. Revista de Educación
versión On-line ISSN 1815-7696
Rev. Mendive vol.18 no.2 Pinar del Río abr.-jun. 2020 Epub 02-Jun-2020
Original article
Desertion and graduation. Measuring the efficiency of state universities in Chile
1 Universidad del Bío Bío, Chile
Reducing desertion and increasing graduation in Higher Education has become an imperative for governments, in order to improve equity and address social and economic exclusion of the most vulnerable sectors. In this context, it is intended to measure the efficiency of the 16 Chilean state universities, using a non-parametric model of Enveloping Data Analysis (DEA) with data from the Ministry of Education during the period 2015-2016. The results indicate that the average country efficiency is 81.71% in retention and graduation, where universities in the north are the most efficient, followed by those in the south. Meanwhile, those in the center presented greater variability and inefficiency with respect to the national average. However, it must be considered that universities are multiproduct and must combine their resources for a variety of functions.
Key words: Higher Education; desertion; graduation; efficiency; public sector
Introduction
Several studies on college desertion have focused on the side of the student rather than the side of the own universities. However, to the institutional conditions of universities are attributed a strategic role to lower the desertion- in students and, thus impacting their curricular progress and achieve optimal graduation rates. Although the desertion is a phenomenon whose direct effect the student and its family, there is a consensus that the consequences go beyond the individual level, existing financial effects and organizational institutions of education and less explicit level of society as a whole, such as the lower aggregate educational level and, therefore, its impacts on the productivity, well-being and development of the countries.
For this reason, desertion is a public policy in many countries, especially in Latin American universities, even more with the increase in its coverage, and Chile is not an exception (Ramírez & Grandón, 2018,Vargas & Heringer, 2017). Desertion is a complex process due to multiple causes, which leads to students who start studies do not the complete them and it produces a difference between the number of students entering and the percentage that graduate called the Higher Education. In turn, the responsibility of universities, especially the institutions financed by the State which are instrument and concern public policy (Ferrão & Almeida, 2018), which should not only guarantee the right to access to the Higher Education to its students, but also to propitiate the conditions for obtaining the title corresponding to the studies completed (García de Fanelli, 2015).
To describe the university desertion from the perspective of a student it has been used concepts such as desertion, starting, retirement, academic failure, lack of continuity and lack of completion. In contrast, from a positive perspective we talk about persistence, retention, continuation, completion, among others (Kim & Kim, 2018).
It is known that this phenomenon can be analyzed in different dimensions (Munizaga, Cifuentes & Beltrán, 2018). In general terms, five explanatory factors of desertion are referred to: individual, academic, economic, institutional and cultural (Tapasco-Alzateet al., 2019); being one of the external factors relevant institutional policies that help retention, such as the regulation of the curriculum, quality of teaching and counseling, factors that would tend to reduce the college desertion. In the latter factor that can affect students, there are aspects such as: degree of academic policy, kind of of financing, support resources, nearness and interaction with faculty, interaction with other students, institutional commitment grade to students, quality of the program, type of institution, inefficient institutional management, change of methodologies from school, among others (Munizagaet al., 2018).
In turn,Gitto, Minervini & Monaco (2016) demonstrate that some factors related to supply, such as the structure of university courses, the characteristics of the institution and the reorganization have an impact on the probability of desertion. At the same time, having resources allows generating broad conditions that would improve the quality of life of the students; the physical conditions of a university, such as the age and size of the facilities and the quality of the classrooms influence desertion (Kim & Kim, 2018).
However,Gittoet al.(2016) show, from previous studies, that the type of institution (privateversuspublic), location (ruralversusurban) and size (number of enrollments) of a university do not influence the persistence of students. Furthermore, they point out that desertion rates in public universities seem higher than private ones. It is the attractiveness of institutions focus only on the state level, where one of the main functions inherent in its nature, in its role of serving the public good (Salinas & Tamayo, 2018). What for a private institution is an option, for a state university is part of its mission.
Meanwhile, it has been established that university graduation can be analyzed from global indicators, referring to the stocks of graduates in a given year, or according to the data on flows of graduates in each of the universities (García de Fanelli, 2015). A drop in the graduation rate is explained by the levels of demand of the programs, the conditions of educability and the scarce flexibility of the curricular meshes, which affect the academic trajectories of the student, which reduces the so-called "educational efficiency of the training process" that is generated by the progressive delay and slowing down of the pace of studies (Rodríguez & Castillo, 2015). On the other hand, those universities that are concerned with the institutional conditions that make it possible, through an adequate academic and pedagogical organization, to accompany the students' training paths will allow better graduation rates (García de Fanelli, 2015).
In this context and by virtue of stated problems, the objective of this work is to measure the institutional efficiency, through the desertion and graduation results, of the Chilean state universities as an indicator of their management (Rodríguez-Gómez, et al., 2016). For this, the Data Envelopment Analysis (DEA) methodology was used, which allows comparing which units are the most efficient based on their resources and inputs, adjusted for their size differences(Puertas & Marti, 2019). The latter is relevant, since the performance reports on universities in Chile, as in other realities, providerankingsof results that do not take into account their productive factors, therefore they change reality as it is obvious who can do more with less and taking into account the effective contribution of government resources (Fandel, 2007).
The study has a quantitative approach. Data used for the year 2015-2016 of the sixteen universities in the state of Chile, reported by the Ministry of Education of Chile(MINEDUC, 2018). The data range is available with a lag of two years. With the objective of measuring the level of efficiency, the Non-parametric Data Envelopment Analysis (DEA) model was used(Puertas & Marti, 2019), which allows to correct the differences in size between universities.
DEA methodology for comparing a relationship between input (inputs) and output (outputs) of one or more productive or company units (DMU, for its acronym in EnglishDecision Making Unit). By using this model you can get in formation of the different DMU evaluated and to check whether they are not efficient. With the results it is possible to build an efficient frontier, where the productive units or DMU that reach the maximum level ofoutputswith theinputsused are on the frontier, so that it is possible to determine which DMUs are inefficient by observing the distance that they are from the border.
The model is based on two approaches:inputsandoutputs. The two most widely used versions are the DEA-CCR model, which uses constant returns to scale and the DEA-BCC model, which uses variable returns to scale.
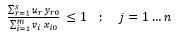
The DEA model in its CCR variant is expressed as follows:

Subject to the following restrictions:

Model BCC, named for its authors, also known as VRS (Variable Returns to Scale), evaluates the efficiency considering variable returns of scale, and indicates the value of the Pure Technical Efficiency (ETP). The BCC model incorporates the concepts of economy of scale into the CCR model, and also proposes comparing DMUs that operate on a similar scale. Thus, the efficiency of a DMU is obtained by dividing its productivity by the highest productivity among DMUs with comparable size.
Mathematically, to analyze the efficiency using the BCC oriented model, either to theinputsor theoutputs, the following restriction must be added to the formula of the CCR model:

After obtaining, both Global Technical Efficiency (ETG) as Pure Technical Efficiency (ETP), it can be determined the Scale Efficiency (EE), through the following formula:

Given this, it is considered that the pure technical inefficiency arises from the excessive use of resources to produce a given level ofoutputs;on the other hand, the Scale Inefficiency arises when the Global Technical Efficiency is lower than the Pure Technical Efficiency. For the resolution of the DEA model, the R software (version 3.5.1) was used, using the "Productivity" package.
Variables
The variables of the production function were obtained from the databases of the MINEDUC, using the various reports available from the Information System of Higher Education (SIES). To control the size of the institutions, per capita indicators were used with estimates of the total population.
In connection with the variables associated with the production function it was based on efficiency indicators teaching for the university level and taking into account previous studies for DEA (Alcaraz-Ochoa & Bernal-Domínguez, 2017; Sagarra, Mar-Molinero & Agasisti, 2017; Tavares & Angulo, 2017), including four variables input(X) and two variablesoutput (Y) as detailed below:
X1:Non-academic staff for every 100 students (Pers_No Aca), a quantitative variable that corresponds to the sum of the total number of administrative support officers. For size adjustment purposes the value was divided by the number of undergraduate students.
X2: Tax financing per capita 2015 M $ (End_student), quantitative variable that corresponds to the resources from the State as of December 31 of the year to each university, obtaining an amount per student.
X3:Academic JCE grade for every 100 students (Acad_JCE), quantitative variable corresponding to the total sum of official plants and hire of academic full - time grade and whose value was divided by the number of undergraduates.
X4:Infrastructure by Mt 2/ undergraduate student (Infrastructure), a quantitative variable that corresponds to the total sum of square meters available for each undergraduate student.
X5: Accredited undergraduate courses (Carrer_Acred), a quantitative variable that corresponds to the percentage of quality-certified courses.
The choice of output variables is based on the study ofBreu and Raab (1994), who analyzed 25 universities and 25 schools of art in the United States, using variables: graduates and no desertion rate.
Y1:Second year retention rate (Retention), a quantitative variable that corresponds to the retention percentage of undergraduate students in the second year.
Y2:Undergraduate graduation rate (Graduation), a quantitative variable that measures the percentage of the total number of students graduating from the total number of students enrolled in their corresponding cohort.
The five first variables (X) seek to represent the resources available to each university for management and last two (Y) seek to represent variables efficiency in teaching. Intable 1a descriptive summary of the variables showninput- outputused in the DEA model.
Table 1 - DEA model variables descriptive statistics
| Variable | Kind | Maximum | Minimum | Half | Dev. Its T. |
|---|---|---|---|---|---|
| Pers_No Aca | Input | 29,430 | 3,034 | 8,038 | 5,856 |
| End_ student | Input | 4,087,000 | 913,000 | 2,571,188 | 831,869 |
| Here d _JCE | Input | 5,099 | 1,505 | 3,170 | 0.908 |
| Infrastructure | Input | 20,321 | 4,343 | 9,829 | 4,038 |
| Carrer_Acr e d | Input | 0.833 | 0.060 | 0.333 | 0.223 |
| Retention | Output | 0.791 | 0.563 | 0.696 | 0.063 |
| Graduates | Output | 0.223 | 0.078 | 0.135 | 0.035 |
From the proposed DEA model, the Global Technical Efficiency, Pure Technical Efficiency and Scale Efficiency are determined. The models will have an orientation to the outputs (outputs)since the resources of state universities are determined by a higher level of management; therefore, managers are supposed to direct their efforts toward better results.
Results
A first measurement approach is the Global Technical Efficiency -that obtained by applying the DEA model under the assumption of constant returns to scale- (CRS- Constant Returns to Scale). InTable 2it is observed that and five universities (31.25 %) reach maximum efficiency score (100 %), two institutions with an average level above average (77.84 %). On the contrary, it can be inferred that there are nine (56.25 %) inefficient universities regarding retention and graduation measures.
Regarding Pure Technical Efficiency which is obtained when applying the DEA model under the assumption of variable returns to scale (VRS - Variable Return Scale) -, it is found that eight institutions are above average (94.95 %), being six those that obtained 100 %; therefore, they form the frontier of efficient production. The remaining eight institutions, 50 % of the total, are below average.
On the other hand, the average of scale efficiency (EE), which is obtained by the ratio between the Global technical Efficiency obtained from the CRS model and the Pure Technical Efficiency obtained from RSV model, evidence that, of the sixteen State Universities, five reach a 100 % efficiency. Meanwhile, seven eight universities are above the system average (81.71 %). Although some variables used are different, the results are slightly lower is the results of l study in Mexico ofAlcaraz-Ochoa & Bernal-Dominguez (2017), where public universities reached an average technical efficiency of 86.04 %.
Table 2- Efficiency of state universities in Chile
| Variable | CRS | VRS | CRS / VRS |
|---|---|---|---|
| U 1 | 100.0 % | 100.0 % | 100.0 % |
| U 2 | 100.0 % | 100.0 % | 100.0 % |
| U 3 | 100.0 % | 100.0 % | 100.0 % |
| U 4 | 36.94 % | 99.55 % | 37.10 % |
| U 5 | 65.10 % | 95.87 % | 67.90 % |
| U 6 | 67.35 % | 91.37 % | 73.71 % |
| U 7 | 100.0 % | 100.0 % | 100.0 % |
| U 8 | 73.30 % | 92.89 % | 78.92 % |
| U 9 | 76.71 % | 90.02 % | 85.21 % |
| U 10 | 74.71 % | 91.98 % | 81.23 % |
| U 11 | 100.0 % | 100.0 % | 100.0 % |
| U 12 | 77.41 % | 98.88 % | 78.28 % |
| U 13 | 58.28 % | 88.34 % | 65.97 % |
| U 14 | 90.72 % | 100.0 % | 90.72 % |
| U 15 | 46.51 % | 88.11 % | 52.79 % |
| U 16 | 78.49 % | 82.19 % | 95.49 % |
| Average | 77.84 % | 94.95 % | 81.71 % |
| Dev. Its T. | 19.30 % | 5.60 % | 18.20 % |
A second level of analysis was segmenting the sixteen institutions according to their location in the Chilean territory, distinguishing the institutions of the central area located s in the Metropolitan Region Valparaiso (6) and regional in the northern area (5) and South of the country (5), respectively. According to the results (table 3) in the three DEA models, northern zone universities have higher average efficiency. In a second place, the regional universities of the southern zone presented greater efficiency in the three models above the national average. Meanwhile, the central institutions of the country are the most inefficient in the results of retention and graduation, being lower for the national average and presenting greater variability among institutions analyzed.
Table 3- Efficiency of state universities by geographic area
| Variable | National | North | Center | South |
|---|---|---|---|---|
| CRS | 77.84 % | 88 , 95 % | 61.94 % | 85.82 % |
| VRS | 94.95 % | 98.05 % | 90.03 % | 97.75 % |
| CRS / VRS | 81.71 % | 90 , 4 0 % | 69.63 % | 87.51 % |
| Maximum | 100 , 0 0 % | 100 , 00 % | 95.49 % | 100.0 % |
| Minimum | 37.10 % | 73.74 % | 37.1 0 % | 67.9 0 % |
| Dev. Its T. | 18.20 % | 1 1.85 % | 2 0.0 % | 1 2.50 % |
Discussion
Whatever the definition, it becomes clear that desertion becomes a problem of state, of social equity, which perpetuates situations of social and economic exclusion. This is central, considering that students from more vulnerable families are more likely to drop out of school and less likely to complete courses or graduate within the expected time. Failure to finish university studies is a sign of inefficiency that increases the private and public costs of education, from families, society and what it means for the student himself when trying to enter the labor market under disadvantageous conditions. Thus, carrying out an intervention in the institution that promotes retention shows a concern for equity.
In turn, when analyzing the universities in the territorial area, the asymmetries in access to resources and the diversity of realities are evident; existing a permanent space for defining guidelines and monitoring retention goals. The improvement of education experiences is in a long term; therefore, they transcend a specific government. To see it in a short term perspective creates an unfortunate vicious circle of social and economic losses for any country. There are spaces for a greater and better role for the State, especially through its own universities, which are supposed to be instruments of public policy by mandate.
The results of the DEA model applied to state universities of Chile for the year 201 5-2016 shows that the national average is 81.71 %, with half of them and presents a greater sufficiency to the average of the system based on the products desertion and graduation. The Institutions of the northern country presented a greater efficiency, followed by institutions of the south. Meanwhile, the universities of the center show greater variability and lower average efficiency average, below the national average. Given that the focus of this research is desertion and graduation, it can be inferred that regional universities make a greater effort towards undergraduate teaching training, being efficient from theinputsthey have.
It is important to emphasize the limitations of the study. Although the analysis is focused on two indicators of high importance, such as desertion and graduation (Breu & Raab, 1994), do not forget that universities are considered organizations "multiproduct " or called complex (Mihaljevic, 2013) that is, they invest their resources in a wide variety ofinputsand where with the same combination of them they can obtain differentoutputs(teaching, research, postgraduate, extension, technical assistance, among others). Therefore, any evaluation of efficiency for universities is always complex, because it is based on the decision of the selectedinputsand outputs.
In Chile it becomes mostly difficult, given the historical asymmetries in the university system. But the previous one is not an excuse to evaluate each institution from the perspective of its cost of production and efficiency in results.
This study opens the possibility of new investigations, expanding the scope to private universities or other countries, allowing a comparison between institutions or a causality analysis that can explain the performance of the universities from their institutional aspects.
Referencias bibliográficas
Alcaraz-Ochoa, D. & Bernal-Domínguez, D. (2017). Evaluación de la eficiencia técnica de las Universidades Públicas Estatales (UPE) del noroeste de México mediante Análisis Envolvente de Datos (DEA). Nova Scientia, 9(19), 393-410. [ Links ]
Breu, T. M. & Raab, R. L. (1994). Efficiency and perceived quality of the nation's "top 25" National Universities and National Liberal Arts Colleges: An application of data envelopment analysis to higher education. Socio-Economic Planning Sciences, 28(1), 33-45. [ Links ]
Fandel, G. (2007). On the performance of universities in North Rhine-Westphalia, Germany: government's redistribution of funds judged using DEA efficiency measures. European Journal of Operational Research, 176, 521-533. [ Links ]
Ferrão, M. & Almeida, L. (2018). Multilevel modeling of persistence in higher education.Ensaio: Avaliação e Políticas Públicas em Educação , 26(100), 664-683. [ Links ]
García de Fanelli, A. (2015). La cuestión de la graduación en las universidades nacionales de la Argentina: indicadores y políticas públicas a comienzos del siglo XXI.Propuesta educativa, 43, 7-31. [ Links ]
Gitto, L., Minervini, L. F. & Monaco, L. (2016). University dropouts in Italy: Are supply side characteristics part of the problem?. Economic Analysis and Policy, 49, 108-116. [ Links ]
Kim, D. & Kim, S. (2018). Sustainable education: analyzing the determinants of university student dropout by nonlinear panel data models. Sustainability, 10(4), 1-18. [ Links ]
Mihaljevic, M. (2013). Efficiency measurement in higher education: Concepts, methods and perspective. Procedia-Social and Behavioral Sciences, 106, 1031-1038. [ Links ]
MINEDUC (2018). Informe retención de 1er año de pregrado. Cohortes 2013-2017, 19. [ Links ]
Munizaga, F., Cifuentes, M. & Beltrán, A. (2018). Retención y Abandono Estudiantil en la Educación Superior Universitaria en América Latina y el Caribe: Una Revisión Sistemática. Education Policy Analysis Archives , 26(60/61), 1-32. [ Links ]
Puertas, R. & Marti, L. (2019). Sustainability in Universities: DEA-GreenMetric. Sustainability , 11(14), 1-17. [ Links ]
Ramírez, P. & Gradón, E. (2018). Predicción de la Deserción Académica en una Universidad Pública Chilena a través de la clasificación basada en Árboles de Decisión con Parámetros Optimizados. Formación universitaria, 11(3), 3-10. [ Links ]
Rodríguez, C. & Castillo, V. (2015). Stock profesional, eficiencia educativa y segmentación: análisis de los procesos de formación profesional en Chile. Civilizar. Ciencias Sociales y Humanas, 15(29), 181-195. [ Links ]
Rodríguez-Gómez, D., Meneses, J. & Gairín, J., Feixas, M. & Muñoz, J. (2016). They have gone, and now what? Understanding re-enrolment patterns in the Catalan public higher education system. Higher Education Research & Development, 35(4), 815-828. [ Links ]
Sagarra, M., Mar-Molinero, C. & Agasisti, T. (2017). Exploring the efficiency of Mexican universities: Integrating data envelopment analysis and multidimensional scaling. Omega, 67, 123-133. [ Links ]
Salinas, J. J., & Tamayo, J. (2018). El Rol de la Universidad Estatal como un Bien Público. Retos en el Caso Colombiano. Información tecnológica, 29(2), 19-28 [ Links ]
Tapasco-Alzate, O., Ruiz-Ortega, F., Osorio-García, D. & Ramírez-Ramírez, D. (2019). Deserción estudiantil: incidencia de factores institucionales relacionados con los procesos de admisión. Educación y Educadores, 22(1), 81-100. [ Links ]
Tavares, R. & Angulo, L. (2017). Uso da análise envoltória de dados para a avaliação da eficiência em cursos de graduação: Um estudo de caso em uma Instituição de Ensino Superior brasileira. Revista Espacios, 38(20), 1-15. [ Links ]
Vargas, H. & Heringer, R. (2017). Políticas de permanência no ensino superior público em perspectiva comparada: Argentina, Brasil e Chile. Education Policy Analysis Archives , 25, 1-33. [ Links ]
Received: August 16, 2019; Accepted: April 24, 2020

