


Mi SciELO
 Servicios personalizados
Servicios Personalizados
Revista

Articulo
 texto en
  Inglés (pdf)
 Articulo en XML
 Referencias del artículo
 Enviar articulo por email
Indicadores
-
 Citado por SciELO
Links relacionados
-
 Similares en
SciELO
Similares en
SciELO
Compartir

 Permalink
Mendive. Revista de Educación
versión On-line ISSN 1815-7696
Rev. Mendive vol.18 no.4 Pinar del Río oct.-dic. 2020 Epub 02-Dic-2020
Original article
The teaching of statistics in fourth grade of primary from projects

1 Universidad de Sancti Spíritus José Martí Pérez. Cuba
The current reality of learning statistics in Cuba has shown that there is a need to deepen research on the factors that influence the poor knowledge of statistical content in national education, essentially in Primary Education. Traditionally, the statistical contents in primary school have been relegated to few notions to which little time is spent in relation to the other mathematical content blocks of the curriculum, in addition, despite its importance, its teaching, sometimes becomes boring and tedious for the way it is taught. Statistical projects in the classroom are a method that helps to approach statistical content in a context close to the students, their daily life, their sociodemographic, economic situation or the study of situations that arouse their interest. This article has been the result of research and its objective is: to present didactic recommendations and methodological suggestions to contribute to the improvement of the teaching of statistics in primary education through teaching by projects. For its realization, the dialectical-materialistic approach was started as a general method and for its conception; methods of the theoretical level, the empirical level and the statistical-mathematical level were taken into account. With the application of this project-centered methodology, it was possible to greatly increase the learning of schoolchildren as well as the motivation and interest in this science.
Keywords: learning; statistics; primary education
Introduction
The comprehensive training of the new generations must respond to the political, economic, social, cultural and scientific-technical demands that characterize today's world. The experience of all these years, materialized in the educational thought Cuban has allowed a strong ethical tradition humanist and a solid scientific training promuev to the development of a human being capable of regulating and self - regulate their behavior, and that identified with their nationality, respond to the revolutionary values of your time and transcend them with a broad sense of social progress.
In this sense, Cuban education bases the need to educate girls and boys to live in a world of systematic transformations, the materialization of which is expressed in the guidelines of the economic and social policy of the Party and the Revolution for the period 2016-2021. (Guidelines 120-121), which highlights the need to continue advancing in raising the quality and rigor of the teaching-educational process, as well as in strengthening the role of the teacher in relation to the student.
The fulfillment of such aspirations is clearly reflected in the conception of a teaching-learning process where schoolchildren are active protagonists, can exchange ideas and live practical experiences that allow them to interact according to the particularities of the context in which they operate.
In this respect, the process of teaching and learning of mathematics in the school allows ownership, systematization and application of mathematical content to solve problems on the phenomena and processes occurring in society and nature, in close link with life and in correspondence with their individual peculiarities.
In turn, the general conception of work in the Mathematics subject, in order to ensure the appropriation, systematization and application of the contents by schoolchildren, around certain essential nuclei, must be based on relationships with other mathematical contents, as an expression of the interrelation of the guidelines.
One of the guidelines relating to knowledge, skills and specific forms of mathematical thought that are worked on from the teaching of Mathematics in Primary Education is Data Processing / Statistics.
It should be noted that the study of statistics as an essential content of the subject Mathematics in Primary Education in our country begins with the insertion of Cuba in the Latin American Laboratory for the Evaluation of the Quality of Education (LLECE). In this sense, the results in the Assessment System Regional on Quality of Education (SERCE), specifically in the subject of Mathematics, cast a negative difference in the results of the questions related to statistics in our country regarding the rest of the participating countries, which brought with it a curricular adjustment to the Mathematics programs to begin to explicitly teach descriptive statistics content from Primary Education.
It was then that in the 2004-2005 academic year the first steps were taken in the treatment of statistics as part of the Mathematics subject in Primary Education, precisely from the implementation of the curricular adjustments in the subject. Already in the 2007-2008 academic year, the total incorporation of Statistics in the study programs of said teaching was achieved(Cuétara, Salcedo, 2016).
Today, the concept of Guideline Data Processing / Statistics from the curriculum of the Primary Education elementary in Cuba has the maximum train aspiration to school for describing processes to analyze trends and make judgments about facts and phenomena of economic, political and social life(Díazet al.,2016).
All of the above allows arguing once again that the increasing incorporation of statistics content in Primary Education within the subject of Mathematics is currently of great importance in the training of every citizen in any country, since a large part of the Information transmitted by the media is summarized and presented using the basic notions of statistics.
Given this reflection, the need to achieve, from the teaching and learning of Mathematics, the integration of statistical content based on its contextualization and systematization, through various types of tasks that promote interaction among schoolchildren, is reaffirmed.
For this reason, Primary Education, in correspondence with current times, must develop the contents that are presented from the teaching curriculum in order to adapt to the social context; that is, they must encourage and involve students with the basic concepts of statistics, its importance and the social relevance it has in today's world.
With the purpose of incorporating the rudiments of statistics, implicit in the programs of Mathematics, on a daily learners from the general objectives of the subject in grade , states that schools must: recoletr, organize, represent and interpret (qualitative) data, given or described by the students themselves in tables and graphs, by integrating their arithmetic, geometric and magnitude knowledge, so that they can make inferences and evaluations about situations in their natural and social context, in connection with with other subjects.
Taking into account the aforementioned, it is evident that the treatment of statistical content requires alternatives that lead to the articulation of educational processes, allowing, in turn, access to fundamental knowledge that is related to the environment social-community and facilitating n significantly the learning.
In this sense, the teaching of statistics could be addressed by SDE teaching per project, as from this not only will allow students applying the knowledge acquired in mathematics, but would be the ideal means for achieving solid learning in this science in an experiential way and contextualized to the environment that surrounds them.
In this regard, there have been many researchers who have focused on this teaching methodology. In this regard, the criteria are highlightedGraham (1987), that proposes that working with projects placed students in the position of having to think about questions like the following: What is my problem? Do I need data? Which? How can I get them? What does this result mean in practice?
The main characteristic of a project-based course is that the emphasis is on assignments, which, at least roughly, should be realistic.
As Holmes (1997) suggests, if students work on statistics through projects, several positive aspects are achieved:
Projects allow statistics to be contextualized and made more relevant. If the data arises from a problem, it is data with meaning and has to be interpreted.
Projects reinforce interest, especially if the student chooses the topic. The student wants to solve the problem, it is not imposed by the teacher.
You learn better what real data are and ideas that do not appear with the data invented by the teacher are introduced: precision, variability, reliability, possibility of measurement, bias.
It is shown that statistics are not reduced to mathematical content.
Thomas (2000), for his part, argues that project-based learning can be defined as a task-centered teaching and learning modality, a shared process of negotiation among participants, its main objective being the obtaining of a final product.
The author refers, in addition, this method promotes individual and autonomous learning within a defined work plan objectives and procedures. Students take responsibility for their own learning, discovering their preferences and strategies in the process. At the same time, they can participate in decisions relating to the content and assessment of learning.
As suggested byMurray and Gal (2002), understanding, interpretation and reaction to non s statistical information or required statistical or mathematical knowledge, but also language skills, knowledge of the context, ability to raise questions and a critical stance rests in a set of beliefs and attitudes. All of these capabilities are encouraged in project work.
According to the criteria of Batanero, Contreras and Arteaga (2011), the projects are conceived as true investigations, where we try to integrate statistics within the more general research process. They must be chosen carefully, be realistic (even when they are simplified versions of a given problem), open and appropriate to the level of the learner. You start by posing a practical problem and then use statistics to solve it. Statistical reasoning is a problem-solving tool and not an end in itself.
In this regard,Batanero and Diaz (2011) propose and Wiring plan development of RAFT (see Figure 1), which contains the outline of the shape of work, in the we see that the purely part "mathematical" statistical (reduction, analysis and interpretation of data) is s or as one of the phases, and interpretation should be based on the context of the problem posed.

Similarly, these authors report that the question-posing phase is one of the most difficult. Students rarely start with a clearly formulated problem. Usually they could start without clearly defined questions and the role of the teacher is to help them move from a general topic (sports) to a question that can be answered (in the past season, did soccer teams that played on their own field do better? than those who played in the opposite field?).
Following are offered, based on the conceptions of Batanero, Contreras and Arteaga (2011), questions to take into account when posing the research questions:
What do you want to try? What do you have to measure/observe/ask?
What data do you need? How will you find your data? What will you do with them?
Do you think you can do it? Will you find problems? Which?
Can you answer your question? What will the results do for you?
Authors such as Díaz, Aguayo and Cortés (2014)have addressed important points in the teaching of statistics in their studies through projects in Primary Education, highlighting the importance of this teaching methodology, since it allows the student to work actively through the investigation.
Rodríguez, García and Lozano (2015) refer that the project method is an essentially active method, whose purpose is to make students do and act. It is, in short, the method of "determining a task" and asking students to carry it out. The project method tries to imitate life, since all the actions of the human being, unlike those of the animals, are not other things than realizations by projects.
For their part,García-Varcálcel and Basilotta (2017) state that projects are a different way of working in the classroom, which encourages students to investigate, based on questions that are considered useful and important and that, in some cases, have arisen from themselves. During the development of a project, students explore and discover interests, ask questions, organize their work, seek information from various sources, share their conceptions and compare them with new information, enrich or transform them, communicate results, make proposals, etc ether.
On this basis, the methodology and the project presented as an example has been designed according to the following premises addressed by the Canarian Institute of Statistics, in its publication "Statistics in Primary Projects":
They start from a problem derived from the daily elements of the habitual reality of the students, belonging to their immediate environment: the school, the classroom, their home, the community, the media, etc.
They have been conceived to adapt to the center and the group with which they are going to develop. Therefore, most of the proposals experiences do not specify concrete numerical data for two reasons: l os numerical data drawn from the experience that each teacher or teacher is performing with his group of children.
The amounts may vary from 2 to 7 digit numbers, in correspondence with the degree program.
They propose individualized, collaborative and cooperative learning activities. In this way, the teacher will be able to distribute or adapt the tasks according to the learning capacity of the students, so that all of them achieve the minimum desirable objectives.
They make it possible to globalize the other curricular areas of the stage; thus, at the end of each project, the teacher can propose activities and tasks related to mathematical content from other areas.
In line with all the above, it is considered as the main objective of this article to present didactic recommendations and methodological suggestions to contribute to the improvement of the teaching of statistics in primary school, based on teaching by projects.
Materials and methods
The research was carried out with the schoolchildren and teachers that make up the fourth grade of the Serafín Sánchez Valdivia primary school of the "Parque" Popular Council of the Sancti Spíritus municipality.
It is tom aron as shown by the 25 students of the fourth grade group one and three teachers who teach mathematics subject at this level. The sample is taken intentionally, as this is the grade where the systematization of statistics content in Primary Education begins.
The methodology used starts from the dialectical-materialist approach as a general method. For its conception, methods of pedagogical research were taken into account, among which are distinguished: the theoretical level, the historical-logical, which is used in the historical study that is carried out of the regularities and essential characteristics of the teaching - learning process of the content of statistics in Primary Education. The analytical-synthetic one, which allowed the interpretation of the documentary information, as well as the determination of the main positions and tendencies of the learning of the contents of statistics in Primary Education and the inductive- deductive one provided us with a true knowledge about the reality that is studies, as well as being able to logically structure scientific knowledge during the research process.
Among the empirical methods used is the analysis of documents, which made possible an in-depth study of the degree program; methodological guidelines; textbooks, workbooks and supplementary notebooks; the class systems and planned classes on the interpretation and representation of data, as well as the adoption of positions relative to the subject under investigation and the determination of the strengths and weaknesses to be considered during the teaching-learning process of these contents.
As methods of the empirical level was used, in addition, observation, to corroborate how was conc ecause the process of teaching learning content statistical during experimentation; document analysis, used to review the normative and methodological documents that govern the conception of the teaching-learning process of the contents of statistics in primary education and pedagogical tests to evaluate the level of development of skills in the interpretation and representation of data given in tables and graphs and calculation of averages in schoolchildren at different times of experimentation.
Was used also the interview, on an individual basis, to teachers, to check their level of preparedness for teaching statistics in Education Primary and ascertain what their ratings on the recommendations and suggestions methodological proposals.
In addition, the methods corresponding to descriptive and inferential statistics were used, which made the primary data collection possible.
For the use of these methods is determined on the following indicators related to the teaching-learning contents Be ística in Primary Education:
Use of methods and procedures that facilitate research and the active participation of schoolchildren in learning the contents of statistics.
Contextualization of statistical content.
Systematization of the statistics contents from the integration with other mathematical contents.
Motivation and disposition of schoolchildren and teachers for teaching and learning the contents of statistics.
Mastery of statistical vocabulary.
Collection, organization and representation of data through tables, bar graphs, line and pie.
Interpretation of data expressed in tables and bar, line and pie charts.
Solution of exercises with text and problems in which they apply the concept of average or arithmetic mean and mode and establish relationships between these statistical measures and the numerical data used.
In general, the methods used made it possible to synthesize the most important references on the subject and to specify, from practice, the main strengths and limitations that arise in the teaching-learning process of statistics content in Primary Education. On the other hand, its ordering and integration allowed to reach generalizations and the conception of a proposal of methodological recommendations and suggestions for the improvement of the teaching-learning process of statistics contents.
Results
The document analysis implied the use of a guide that made it possible to determine the following aspects of interest:
The general objectives of the Primary School Model are focused on the comprehensive training of schoolchildren; however, they do not make explicit the importance of statistical content for their practical life.
The objectives of the degree include the knowledge and skills to be considered during the teaching-learning process of statistics content; but the educational nature and their potentialities in the comprehensive training of schoolchildren are not always made explicit with sufficient clarity.
In methodological guidelines required for the introduction and fixing of the contents of statistics, the integration of these with other domains mathematicians, and the use situations of practical life, where where school arrive at solutions alone; however, methods and procedures that promote collaborative and investigative learning that make statistics more experimental are not suggested.
In texbooks and manuals of work, activities only limited to work with the interpretation of tables and graphs from the troubleshooting data already designed or made; Investigative and collaborative work where they have to handle real data from their school, family or social-community context is not promoted.
There is agreement in the documents, recognizing as requirements of the teaching-learning process of statistics content the need for their link with arithmetic, problem solving and magnitudes; however, there are insufficient recommendations and suggestions for novel methods and procedures that guarantee such integration.
In the methodological analyzes and revised lesson plans, the objectives to be achieved and the exercises to be carried out for the treatment of statistics content are prioritized; However, the potentialities of these contents are not always explored in depth to solve situations that arise from their family, school and social context and that are of interest to schoolchildren.
The planned classes show the work with the didactic functions in relation to the link of the contents of statistics to the arithmetic, the solution of problems and the magnitudes; However, there is no variety in the types of tasks or activities that promote a pleasant, affective, dynamic and collaborative climate.
Similarly, from the interview with fourth grade teachers:
Consider having little theoretical preparation in terms of the essential concepts to guide teaching and learning statistics contained in the fourth grade Education P lementary.
Recognize the contents in which present greater difficulties in teaching is on the r esolution and formulation exercises with text and problems in which the concept of average or arithmetic mean and the establishment of relations between these statistical measures and applies numerical data used.
They believe that the state of mind of schoolchildren during the teaching-learning process of statistics content is not always as expected. They referred a lot to the lack of interest and dislike they show when solving the tasks they proposed.
They identified as requirements of the teaching-learning process of statistics contents its integration with arithmetic, problem solving and units of measurement.
They argued that used only two types of tasks during the teaching-learning content of statistics: l specific as interpretation and representation of data in tables and graphs and general, which are aimed at problem solving or settlement of exercises of varied format, where the corresponding contents are applied.
They expressed that the results of the teaching-learning process of statistics contents are not always favorable; In his opinion, little time is spent on the programs and they are not adequately systematized from other content, as established. They insist that recommendations or methodological suggestions are not always offered for the treatment of these contents.
As for the results of educational testing, the major errors in statistical learning content in school fourth grade in line with the objectives of the program were:
Tendency to execute without establishing the relationships between the data offered, whether they are simple and complex problems in tables and graphs or calculation of averages.
Insufficient interpretation of the meaning of the data, expressed in different notations and in bar graphs.
Insufficiencies in the representation of data in tables and graphs, from the solution of problems.
From the results, it would be relevant and necessary to create a methodology for improving the teaching-learning content of statistics in primary education, by which is pretended offer the teachers of this level one new way to teach statistics to schoolchildren, focusing especially on project teaching.
The methodology that is proposed from this work, to contribute to the improvement of the teaching of statistics in the fourth grade of Primary Education, presents the following structure:
First time or stage: presenting and orientation of the project
The main actions to be developed are suggested:
Presentation of the question or problem situation.You start by posing a practical problem and then use statistics to solve it. L proposals as questions or situations that arise can be made on issues that the lecturer consider appropriate to the grade, the curriculum and the interest of their group class. These can also be derived from a content discussed above or as a premise for the treatment of a particular statistical content. During the presentation, the teacher should insist on the analysis of the question or situation by the students. Specify if it is well understood, as well as listen to the individual proposals of each one for later resolution. At this stage it is necessary to organize the students' work, the teacher must specify if the project will be carried out individually or in a group, in the case of being in a group, the necessary and relevant teams will be formed.
Preparation of the project plan.To carry out this action, the following structure is suggested: -
During this time, the teacher should insist on understanding by the students and be attentive to any concerns or doubts that arise. The important thing is not that the student learn the structure of the project by heart, but rather that they understand how it should be organized. At this time, the teacher should explain the proposed structure and the different ways in which they can declare it in their projects.
Second time or stage: execution of the project
The main actions to be developed are suggested:
Collection and organization of data.To carry out this action, it is recommended to take into account the information to be collected, from the determination of the variables in the previous stage. The teacher can make details about it. An important aspect at this time it is the way the project will take, ie, whether it is individual or collective, which guarantee to the participation of each student and the distribution of tasks if it is for computers. In both cases the teacher will be in charge of the distribution of the tasks taking into account the diagnosis of his students.
Preparation of tables and graphs.To carry out this action, it is necessary to explain to the students that they can select, individually or in teams, the way in which they wish to represent the collected data and that it is not an error to select the two ways that are proposed to represent them. On the other hand, this selection may also depend on the opinion of the teacher according to the diagnosis of his students. If the project is carried out in teams, it is necessary to assign the task of preparing the tables or graphs by the teacher, based on the diagnosis of their students. In the particular case for the use of bar or line graphs, the use of graph paper is recommended. In this sense, it should be explained in detail to schoolchildren.
For the particular use of the tables it is recommended:
Determine the number of rows and columns to be used in the table based on the requested information (variables).
Identify the data that will be represented in the table, based on the information collected.
Represent the data in the table.
For the use of the graph it is recommended:
Determine the type of graph to use based on the requested information (variables).
Identify the data that will be represented in the graph, based on the information collected.
Represent graphically resent data (bar graphs or lines).
Interpretation of data represented in tables and graphs.To materialize this action it is suggested: -
Brief description of the project. At this moment it is the student who describes what his project consists of and what he took into account to carry it out. If the project is collective is designated, by the teacher, who will be in charge of the task.
Exhibition of the results obtained in the project. At this time the students will present the results obtained from the collection, organization and representation of the data. For the exposition, it is suggested to take into account the most significant results to a lesser and greater degree, the establishment of comparisons between the data, highlighting the extent to which it advances, decreases or exceeds, and the establishment of relationships between the data from the use of terms such as: ten, double, triple, quadruple, half, third, etc. If it is individual, each student must present their results and, in the case of teams, the presentation will be made from the distribution made by the team itself under the direction of the teacher.
Resolution of the problem and preparation of the report.To comply with this step, it is suggested that, based on the work carried out by the schoolchildren, both individually and collectively, they will arrive at a solution to the question or situation raised at the beginning of the project and will proceed to prepare the report in writing where collect all work done. It is important at this time to ensure the participation of all schoolchildren through the distribution and assignment of homework under the correct direction of the teacher.
Third time or stage: control and evaluation of the project
To evaluate the project s and suggested to take into account its completeness, correctness of statistical techniques and interpretation made, clarity and quality of the presentation of the info RME as well as the integration and performance of the school in case of having made by team. The teacher can take the completion of the project as a systematic evaluation and give a grade to each student, depending on their performance in it. The results obtained are stimulated.
At this time it is suggested also perform, as another form of assessment of the project, activity implementation and systematization. For this, the teacher will present some exercises adapted to the group and the level at which the project is being carried out. These exercises can be related to other domains of the area of Mathematics or other areas. They are other possible didactic experiences that can be carried out around the center of interest of this methodology.
A proposed statistics project to apply in fourth grade
First time or stage: presentation and orientation of the project
Situation problemic(presenting in worksheets or blackboard)
As part of the fulfillment of the activities to promote reading, it is necessary to carry out a readership survey in primary school (name of school). For this, the librarian of the center needs to carry out a monthly analysis of all the schoolchildren and teachers who have visited the library during the school year. How can we help you?
The teacher asks the students to read the situation so that they explain what it is about and what they want to know. They are also asked to propose how that situation could be resolved and what data would need to be collected to do so.
It is necessary, on the part of the teacher, to check the guiding base of the activity. For this, it is necessary to insist on understanding the situation and if there is any doubt about it.
Next, the teacher proceeds to the organization of the project, which can be by teams or individually.
Preparation of the project plan
At this time the teacher proceeds to explain the structure that the projects will have. It is specified what each of the components of this stage consists of and it will be exemplified, in this case, as it is the first project they will carry out. It should be clarified that the projects may vary with respect to the title and the order of the variables to be collected, since they can be prepared collectively based on the criteria of the schoolchildren who make up each team. The remaining components will be common to all and are proposed by the teacher. The teacher will supervise and control this activity.
Project title: (could be) Visits to the school library
Thematic unit of the program: 2.2 Written procedures of addition and subtraction
Project objective: to v allocate the behavior of the monthly visits to the school library (name of the school) as part of the fulfillment of the reading promotion activities, based on the collection, organization, representation and interpretation of data in boards.
Content to work according to the program: r ecolection, organization and representation of data through tables and bar graphs, with an emphasis on the construction of graphs that require working with scale in one of the axes. Interpretation of data given through tables or graphs. Formulation and resolution of exercises with text and problems, including those that require extracting information from tables and graphs.
Source: r egister user of the library
Information to collect (variables), could be: -
Second time or stage:execution of the project
In this case, the teacher will be in charge of the distribution of the tasks taking into account the diagnosis of his students. As the project presented is the first to perform school, only it is exemplified with the preparation tables. For the collection and organization of data will be designated, by the part of the teacher, those students from each team who will perform this task.
Next, the students are explained how to proceed to prepare the table and the students of each team are designated who will be in charge of this task.
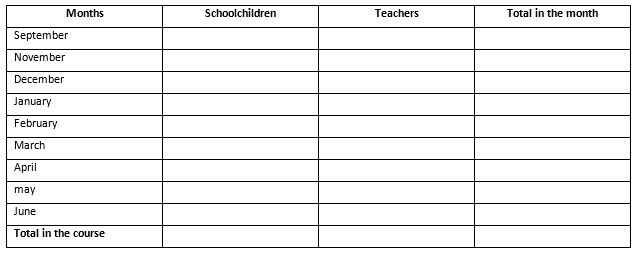
Preparation of the table from the collection and organization of data
The table should represent the data obtained from the collection and organization of the information necessary to solve the problem (the table could be in this way).
Interpretation of data represented in tables and graphs
We proceed to the description of the project by the students orally. In this case, the teacher will designate from each team who will be in charge of describing the project, where they will have to say what it consists of and what they took into account to carry it out.
Next, one or more schoolchildren from each team present the results obtained in their projects. At this stage, the teacher must be attentive to the work of the students in order to correct their answers and suggest other ideas that can enrich the projects.
For the presentation of the results obtained in the project, the schoolchildren could refer, among others, information such as:
The month in which the library was visited the most times by schoolchildren.
The month in which the library was visited the most by teachers.
The month in which the library was visited the least number of times by schoolchildren.
The month with the least number of visits to the library by teachers.
The month in which the library was visited the most times by schoolchildren and teachers together.
The month in which the library was visited the least number of times by schoolchildren and teachers together.
The months that had the same number of visits, both from schoolchildren and from teachers.
The surplus of visits between one month and another taking into account the number of visits by teachers and schoolchildren.
They could refer to other information where comparisons and relationships between the data are established, highlighting to what extent the number of visits that are made is greater, less or equal, according to the data, as well as what one data represents mathematically from another.
Resolution of the problem and preparation of the report.
At this time, the schoolchildren will arrive at the solution of the problem raised from the interpretation of the data, carried out in the previous step, and they will write in their notebooks all the work carried out in the project for later evaluation. The teacher will select the students from each team who will be in charge of this task and will control its completion.
Third time or stage: control and evaluation of the project
The control and final evaluation of the project will be carried out taking into account the following aspects:
its completeness
the correction of statistical techniques and interpretation carried out
the clarity and quality of the presentation of the inform
the integration and performance of schoolchildren in the team
The completion of the project will be taken as a systematic evaluation and a grade will be awarded to each student, in correspondence with the previous aspects.
The best projects will be encouraged and others will be encouraged to strive for better results.
As part of the monitoring and evaluation of the project, it will proceed to carry out a ctivities of application where other mathematical domains are integrated into the teaching of statistics. These activities are only an example for the application and integration of what has been learned in this particular project; the teachers can develop further. It clarifies that these activities do not necessarily have to be performed attached to the project, they can be realized, at another time, as systematization of contents studied from the project itself.
The month with the most visits was:
The month that most teachers and schoolchildren visited the library is:
Link as appropriate the month with the number of visits made (these amounts may vary according to the actual data)
Add the data that represents the number of schoolchildren and teachers who had the same number of visits (this exercise may vary).
Find the difference between the data representing the month with the least and the highest number of school visits.
Find the difference between the data representing the month with the least and the most number of teacher visits.
Formulate and solve a problem where you use the data in the table that refer to the months with the highest number of school visits.
Formulate and solve a problem where you use the data in the table that refer to the months with the highest number of teacher visits.
Calculate the average number of visits made by schoolchildren during the school year.
Calculate the average number of visits made by teachers during the school year.
In general, 10 projects similar to the one exemplified were applied, taking into account the contents that are proposed from the program of the Mathematics subject in the fourth grade.
Discussion
The teaching of statistics through projects has a place in many situations of educational events, but all of this will depend on the enthusiasm of the teachers in charge of the teaching- learning processes, and that in turn they assume with clarity and seriousness the importance of this science for the solution of practical life problems, from the very integration of the content blocks that are worked on in each area of mathematics.
In this regard,Estrella, Olfos and Mena-Lorca (2015) suggest a methodological change in teacher training, which promotes project-based work, problem solving, experimentation with real phenomena and the use of simulation so that In addition to promoting understanding, provide models of the way they will work in class with their students.
E n the last five years, leading researchers have focused on the study of this subject. Among them, the studies byFerreyra (2015)can be pointed out, who in his report presents in detail the development of teaching practices carried out in the third year of secondary level. In these we worked through a statistical project, which gave rise to the problem analyzed "A study on the construction and analysis of graphics." If their work is carefully analyzed, it is concluded that their results can be generalized in Primary Education, as long as it is contextualized at this educational level.
On the other hand, there are studies García- Varcálcel and Basilotta (2017), who consider that given the consolidation of the A EARNING B Roasted P rojects (ABP) and its use increasingly common in schools as a mechanism to develop curricular competencies, increase the motivation and self-esteem of students, enhance research and collaboration is that a scale of evaluation of project-based learning is designed, from the perspective of the students, guaranteeing its validity and reliability.
The teaching of Statistics by Projects provides favorable results in student learning. In the literature review are a variety of features and methodologies for p rojects, allowing for a range of possibilities for learning to develop. In this sense,Flores and Pinto (2017)propose a characterization, organization and classification of projects in Statistics. The proposal of these authors is based on the review of studies that used projects in Statistics as a teaching strategy. Some considerations that teachers should be present at the time of use classification and teaches and stadística for projects as a strategy in their courses.
The wealth of the teaching of project-based statistics lies in allowing it to be contextualized and made more relevant; reinforcing the students' interest in the subject of their project, especially if they propose it in; you learn with real data and show that statistics is an applicable area.
In this sense, the implementation of the methodology by projects of the present work showed that the main transformations achieved had to do with the planning of the teaching-learning process, seen from the intention of promoting the integration of statistical content with other areas of mathematics systematically , the use of methods and procedures to facilitate research and the active participation of schoolchildren in learning the contents of statistics, based on the consistent use of the methodology per project as an alternative to solve situations that may arise in the practical life of your closest environment.
On the other hand, the methodology implemented allowed to raise the level of motivation and disposition of schoolchildren and teachers for teaching - learning the contents of statistics, as well as the mastery of statistical vocabulary for the fourth grade of Primary Education.
With the implementation of the project methodology in fourth grade schoolchildren, it was possible to develop these skills related to the recolection, organization, representation and interpretation of data through tables and graphics, as well as in the solution of exercises with text and problems in which they apply the concept of average or arithmetic mean, establishing relationships between these statistical measures and the numerical data used. These results allow the author to affirm that when teaching, according to the proposal introduced, favorable changes are caused in the learning of statistics content in the fourth grade of Primary Education.
Referencias bibliográficas
Batanero, C. y Díaz, C. (2011). Estadística con Proyectos. Departamento de Didáctica de la Matemática. España: Facultad de Ciencias de la Educación. Universidad de Granada.pp.21-22. Recuperado de http://www.ugr.es/~batanero/ARTICULOS/Libroproyectos.pdf [ Links ]
Batanero, C., Contreras, J.M. y Arteaga, P. (2011). El currículo de estadística en la enseñanza obligatoria. EM-TEIA. Revista de Educaçao Matematica e Tecnologica Iberoamericana, 2(2). Recuperado de http://www.gente.eti.br/revistas/index.php/emteia/article/view/38/22 [ Links ]
Cuétara Hernández Y., Salcedo Estrada I.M. (2016) La enseñanza de la Estadística: antecedentes y actualidad en el contexto internacional y nacional. Revista Científico Pedagógica Atenas. 3(35) (julio-septiembre) [ Links ]
Díaz Levicoy, D. A., Aguayo Arriagada, C. G. y Cortés Toro, C. I. (2014) Enseñanza de la estadística mediante proyectos y su relación con teorías de aprendizaje. Revista Premisa. 16(62) Recuperado de. https://www.researchgate.net/publication/276269094_Ensenanza_de_la_estadistica_mediante_proyectos_y_su_relacion_con_teorias_de_aprendizaje [ Links ]
Díaz, C.L., Pérez, J.C, Martínez, S., Cepeda, Y., Ortiz, O.L., Alvarado, A.L., Sardiñas, H. (2016). Didáctica de la Matemática para la Licenciatura en Educación Primaria. La Habana, Cuba: Editorial Pueblo y Educación. [ Links ]
Estrella, S., Olfos, R., Mena-Lorca, A. (2015). El conocimiento pedagógico del contenido de estadística en profesores de primaria. Educ. Pesqui., São Paulo, 41(02), 477-493, abr./jun. 2015. Recuperado de http://dx.doi.org/10.1590/S1517-97022015041858 [ Links ]
Ferreyra, R.A. (2015) Enseñanza de la estadística en base a proyectos, un estudio sobre la construcción y análisis de gráficos. 97 Mathematical Education. Argentina: Universidad nacional de Córdova. Recuperado de http://rdu.unc.edu.ar>bitstream>handle>Mope17363. [ Links ]
Flores, A., Pinto, J. (2017) Características de la Enseñanza de la Estadística por proyectos. En Cap 1 Análisis del Discurso Matemático Escolar. Universidad Autónoma de Yucatán: México [ Links ]
García-Varcálcel Muñoz-Repiso, A. y Basilotta Gómez-Pablos, V. (2017). Aprendizaje basado en proyectos (ABP): evaluación desde la perspectiva de alumnos de Educación Primaria. Revista de Investigación Educativa, 35(1), 113-131 DOI: http://dx.doi.org/10.6018/rie.35.1.246811 [ Links ]
Graham, A. (1987). Statistical investigations in the secondary school. Cambridge: The Open University Centre for Mathematics Education. [ Links ]
Holmes, P. (1997). Assessing project work by external examiners. En I. Gal y J. B, Garfield (Eds.), Theassesment challenge in statistics education (pp. 153-164). Voorburg: IOS Press. [ Links ]
Murray, S. y Gal, I. (2002). Preparing for diversity in statistics literacy: Institutional and educational implications. En B. Phillips (Ed.). ICOTS-6 papers for school teachers. [CD-ROM]. Cape Town: International Association for Statistics Education. [ Links ]
Rodríguez Rodríguez, L.E.; García Pimentel, L,; Lozano Jiménez, M. (2015) El método de proyecto para la formulación de problemas matemáticos. Atenas, 4(32), 100-112 Universidad de Matanzas Camilo Cienfuegos: Matanzas, Cuba [ Links ]
Thomas, J. (2000). A review of research on project-based learning. American Journal of Educational Research. 4(5), 420-426. DOI: 10.12691/education-4-5-10. Recuperado de http://www.bobpearlman.org/BestPractices/PBL_Research.pdf [ Links ]
Received: March 16, 2020; Accepted: September 07, 2020
 Este es un artículo publicado en acceso abierto bajo una licencia Creative Commons
