


 Serviços customizados
 texto em
  Inglês (pdf)
 Artigo em XML
 Referências do artigo
 Enviar este artigo por email
 Citado por SciELO
  Similares em
SciELO
Similares em
SciELO 
 Permalink
INTRODUCTION
Mathematical models based on deterministic principles or statistical principles have been used persistently in the solution of the most varied problems of the natural sciences and technology, both empirically and theoretically (Matos and Martínez, 2014; Veitia et al., 2014b, 2014a; Martínez et al., 2017).
These mathematical models that seek to describe social phenomena, should take into account, among other entities, two types of factors that occur in them: objective factors of Kaufmann & Aluja (1990) and subjective factors. The former are those that do not depend on the subjects, as natural conditions or existing material resources, and the latest that are those depending on the ways of thinking and acting of humans, their conscience, their will, or their desires. Hence, the study of phenomena of an eminently social nature can not be always approached from mathematical models based on the arithmetic of certainty or randomness, because in these phenomena, the information available, is often charged with subjectivity and uncertainty.
In Trillas (1980, 1992); Zadeh (1992, 1996, 1999) and Kosko (1993), the first works on blurred subsets were published, which initially did not have great reception, but over time their postulates have gone developing with applications in engineering and in the economic sphere and business management. In recent years, many models and algorithms have gained ground that have been shaping the foundations of what has been called numerical and non-numerical mathematics in uncertainty (Zimmermann, 1985). For this, the diffuse logic with its varied interpretations has been taken as a basis. With these tools, many social phenomena can be modeled where assuming certain statistical laws for their treatment is not reliable, since the information available is poorly structured.
The diffuse logic is basically a multi-evaluated logic that allows intermediate values to be able to define conventional evaluations as sí/no, verdadero/falso, negro/blanco, etc. Notions like "rather hot" or "not very cold", can be formulated mathematically and processed by computers. (Zadeh, 1992, 1996, 1999).
This way, an intent of applying a more human form of thinking of computer programming, has been carried out. The diffuse or blurred logic is good as a tool for decision-making in tasks of environmental administration in agricultural systems threatened by the syndrome of soil overuse.(Cassel y Petschel, 2010; Schuschny, 2010; Veitia et al., 2014b).
The symptoms identified to evaluate the presence of the soil overuse syndrome in the agro-system "La Esperanza", Camagüey Province, were poor management of organic matter, decrease of biodiversity, use of unsustainable technologies and rural exodus. Others were contaminated water, little plant cover, little forest cover, use of large amounts of phytochemicals, high use of agrochemicals, little experience of farmers in agricultural work, insufficient recycling of crop residues, use of inadequate standards in the production and management of moisture in agricultural soils (Alzate, 2006; Veitia et al., 2014b)
The use of Big6 model Eisenberg and Berkowitz (2005), for troubleshooting information; as a model of competence in the use and management of information allowed the development of the next steps for the study:
Establish the components of the problem to be solved and associated indicators.
Evaluate associated components in a table to the indicators selected for evaluation (values between 0 and 1).
Count the times a component is evaluated equal or superior to the next in a table, this operation gets integers.
Divide each number on a cell in the resulting table, step "3" by the total number of indicators.
Set the threshold of the results of step "4"; the values that are equal and greater assign the value "1" and lower "0".
Identification of the farms to pay more attention to lessen the effects of the central mechanism of soil overuse syndrome.
Big6 uses the mathematical model of fuzzy logic to obtain the values that serve in decision-making.
METHODS
According to Kaufmann et al. (1986), the essential difference between the concept of subset and fuzzy subset is as follows: for ordinary subsets, the membership of an element of the set to subset is all or nothing, ie this concept fits perfectly to the so called binary logic. The concept of fuzzy subset is more comprehensive. It includes, as particular case the simple subset because for the fuzzy case shadows are accepted, i.e. each element of the set can belong to the subset with a certain degree or level for what it is comfortable to associate it to each fuzzy subset A. That is a membership function expressed as µA(x), defined for each x of the universal set U, in such a way that 0≤µA(x) d≤1.
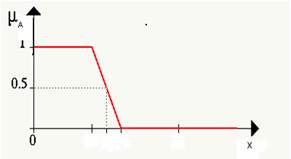
If µA(x) takes values close to zero, little belonging by the element x to the fuzzy subset A is indicated, and close to 1 values indicates high belonging. Following this idea for any universal set U, the notion of ordinary feature subset can be associated with the following belonging function:
For fuzzy subsets, the belonging function can be continuous or discrete depending on the features to highlight with fuzzy subset, as shown in Figure 1.
To make decisions with scientific criteria often requires mathematical modeling of the problem and it can be combined deterministic approach Gil-Aluja (1999), with statistical and fuzzy.
RESULTS AND DISCUSSION
Environmental Management in Agriculture
The mathematical model used in the research was proposed by Gil-Aluja (1999), which allowed the ordering of a set E1 = {P1, P2, ......., Pm} of m elements from another set E2 = {C1, C2, ........., Cn} of n characteristics or qualities that form the criteria for ordering.
When using the Gil-Aluja (1999), it was considered a set E1 formed by the six farms that made up the agro-system "La Esperanza" and a group E2, which constituted the indicators to evaluate the presence of the soil overuse syndrome. These sets were the following: E1 = {P1, P2, P3, P4, P5, P6, P7, P8, P9, P10, P11, P12, P13} and E2 = {C1, C2, C3, C4, C5, C6, C7, C8, C9, C10, C11,}.
The indicators (Cn) were described as follows. Poor management of organic matter (C1), decrease in biodiversity (C2), use of unsustainable technologies (C3), rural exodus (C4), contaminated water (C5) , little plant cover (C6), little forest cover (C7), use of large amounts of phytochemicals (C8), high use of agrochemicals (C9), little experience of farmers in agricultural work (C10) and insufficient recycling of crop residues (C11) (Veitia et al., 2014a). On the other hand, since the agro-systems could be composed of several plots or farms, the six plots that made up the agro-system "La Esperanza" were selected. Consequently, E1 group was integrated by these 6 subsystems (Parcel1, Parcel 2, Parcel 3, Parcel 4, Parcel 5 and Parcel 6), which constitutes the Pm.
Then, this agro-system was evaluated through surveys that were applied to 18 people working in it, with the following composition of local workers: 18 experts (6 doctors in agricultural sciences, 6 doctors in environmental sciences and 6 specialists in soils) and 12 agricultural workers with average level and with more than 10 years of experience in the place. They were organized in groups of four per parcel. These groups consisted of a doctor in agricultural sciences, a soil specialist, and two agricultural workers; and as a group coordinator, a doctor in environmental sciences, who evaluated the presence of the indicators (symptoms of soil overuse syndrome). In the selection of the group of experts, DELPHI method was used, selecting 22 of the 24 people (doctors in agricultural sciences, soil specialists and agricultural workers) that were related to this investigation. A table similar to the fragment that is represented in the following scheme was given to each of the experts were they had to reflect the evaluation considered for each indicator, in the interval 0 and 1 (fuzzy interval)
Afterwards, the evaluators delivered their results to the group coordinator, where the arithmetic means were calculated for each indicator in each farm, with an approximation to a decimal place, obtaining the first results shown in Table 1.
TABLE 1 Results of the evaluation of the soil overuse syndrome by the experts
| P1 | P2 | P3 | P4 | P5 | P6 | Total | Ranking symptom | |
| C1 | 0.4 | 0.3 | 0.6 | 0.9 | 0.7 | 0.6 | 3.5 | 9 |
| C2 | 0.5 | 0.6 | 0.9 | 0.8 | 0.6 | 0.5 | 3.9 | 6 |
| C3 | 0.6 | 0.5 | 0.7 | 0.6 | 0.5 | 0.7 | 3.6 | 8 |
| C4 | 0.5 | 0.7 | 0.6 | 0.5 | 0.6 | 0.8 | 3.7 | 7 |
| C5 | 0.9 | 0.8 | 0.7 | 0.3 | 0.5 | 0.4 | 3.6 | 8 |
| C6 | 0.6 | 0.6 | 0.5 | 0.4 | 0.6 | 0.9 | 3.6 | 8 |
| C7 | 0.8 | 0.7 | 0.6 | 0.9 | 0.6 | 0.5 | 4.1 | 5 |
| C8 | 0.9 | 0.7 | 0.8 | 0.9 | 0.8 | 0.9 | 5 | 1 |
| C9 | 0.7 | 0.9 | 0.8 | 0.7 | 0.9 | 0.9 | 4.9 | 2 |
| C10 | 0.6 | 0.7 | 0.8 | 0.9 | 0.8 | 0.9 | 4.7 | 3 |
| C11 | 0.9 | 0.8 | 0.8 | 0.7 | 0.8 | 0.6 | 4.6 | 4 |
| Total | 7.4 | 7.3 | 7.8 | 7.6 | 7.4 | 7.7 | 45.2 | |
| Ranking Parcels | 4 | 5 | 1 | 3 | 4 | 2 |
From Table 1, it was possible to identify the symptoms that most affected the agro-system and the most impacted farms by the syndrome of soil overuse. The results of using this mathematical model in the analysis of the presence of soil overuse syndrome allowed reaching the following conclusions. The agro-system "La Esperanza" is very impacted by the syndrome of soil overuse, due to the fact that its six plots are affected. They are affected by the impact of the global change and the symptoms with greater presence in the system: use of large quantities of phytochemicals (C8), high use of agrochemicals (C9), and little experience of farmers in agricultural work (C10).
Considering the results of the group of experts, an assessment was made of the effects of the soil overuse syndrome according to the types of soils present in the system. They were typical purple Ferrallitic (S1), reddish-brown Ferrallitic (S2), concretionary purple Ferrallitic (S3), laterite purple Ferrallitic (S4), hydrated purple Ferrallitic (S5), typical red Ferrallitic (S6), concretionary red Ferrallitic (S7) , red compacted Ferrallitic (S8), hydrated red Ferrallitic (S9), little reddish Ferrallitic red (S10) (Hernández, 2006; Hernández, 2013); whose distribution in the agro-system was as shown in Table 2.
TABLE 2 The parcels and types of soils present
| Parcels | Soil types present | Predominant soils |
|---|---|---|
| P1 | S1, S2, S6, S10 | S6 |
| P2 | S6,S9,S2,S5 | S6 |
| P3 | S6,S5,S8,S1 | S6 |
| P4 | S7,S10,S9,S6 | S10 |
| P5 | S4,S1,S7,S3 | S1 |
| P6 | S9, S10, S5,S1 | S9 |
The most affected soil in the agro-system was S6, which occupies an area of 10 hectares, moderately affected was S1, S10, S9; and the least S2, S5, S8, S7, S3, S4.
Starting from the matrix that represents the degree that the indicator meets in the agro-system (see Table 2), the number of symptoms that affect a pair of plots are counted, obtaining the matrix of the degree of affectation of one agro-system with respect to the other, depending on the criteria of experts, as shown in Table 3.
TABLE 3 Degree of affectation of an agro-system with respect to another agro-system
| P1 | P2 | P3 | P4 | P5 | P6 | |
| P1 | X | 6 | 5 | 6 | 7 | 6 |
| P2 | 6 | X | 6 | 6 | 8 | 6 |
| P3 | 8 | 5 | X | 5 | 8 | 6 |
| P4 | 5 | 5 | 4 | X | 6 | 7 |
| P5 | 5 | 5 | 4 | 3 | X | 6 |
| P6 | 8 | 6 | 4 | 4 | 4 | X |
The level of damage between plots of the same agro-system is shown . Then the value of each element of the matrix was divided by the total of symptoms T = 11 and the quotient matrix K was obtained, see Table 4.
TABLE 4 Quotients of dividing the degrees of damages and the total of indicators (symptoms)
| P1 | P2 | P3 | P4 | P5 | P6 | |
| P1 | X | 0.54 | 0.45 | 0.54 | 0.63 | 0.54 |
| P2 | 0.54 | X | 0.54 | 0.54 | 0.72 | 0.54 |
| P3 | 0.72 | 0.45 | X | O.45 | 0.72 | 0.54 |
| P4 | 0.45 | 0.45 | 0.36 | X | 0.54 | 0.63 |
| P5 | 0.45 | 0.45 | 0.36 | 0.27 | X | 0.54 |
| P6 | 0.72 | 0.54 | 0.36 | 0.36 | 0.36 | X |
Taking a threshold (Um), Um = 0.7, and applying the following function to the elements of the matrix:
A binary matrix J was obtained, see Table 5.
TABLE 5 Registration of conversion of minor, equal to or greater quotients than the threshold
| P1 | P2 | P3 | P4 | P5 | P6 | |
|---|---|---|---|---|---|---|
| P1 | X | 0 | 0 | 0 | 0 | 0 |
| P2 | 0 | X | 0 | 0 | 1 | 0 |
| P3 | 1 | 0 | X | 0 | 1 | 0 |
| P4 | 0 | 0 | 0 | X | 0 | 0 |
| P5 | 0 | 0 | 0 | 0 | X | 0 |
| P6 | 1 | 0 | 0 | 0 | 0 | X |
To obtain a reduced matrix K, the following steps were followed:
The first place in the order were the Pi for which the entire column of the matrix was formed by the largest number of elements with zero value, in this case {P2, P1, P4, P5}
The last place in the ordering was formed by the Pj for which the entire row of the matrix was formed by the greatest number of elements with zero value, in this case {P1, P4, P5}.
The columns were eliminated as the rows that comply with steps 1 and 2 of the matrix J and the process is repeated, as much as the many places were to be obtained.
Applying this procedure to matrix J, the following ordering was obtained {P2, P1, P4, P5}<{P3, P6},
The order was determined by the set of columns eliminated in each iteration.
According to the results obtained by this ordering, greater attention should be given to plots P3 and P6 of the agro-system "La Esperanza", since they were the ones with the highest degree of damaging. This allowed that the corresponding decisions could be made regarding the intervention directed to improve the environmental sustainability of the soils of this agro-system, for the syndrome of soil overuse.
CONCLUSIONS
With the present work, the application of Big6 is shown, as a mathematical instrument based on fuzzy logic and easy to apply to the environmental management problems of agricultural soils, fulfilling the objective of this research. This allowed identifying in "La Esperanza" agro-system, soils highly affected by the syndrome of overuse. The use of large amounts of phytochemicals, high use of agrochemicals and little experience of farmers in agricultural work were observed. In addition, in the agro-system, the soils that are affected in minor, medium or greater quantities by the central mechanism of the syndrome of soil overuse were identified, in this case, the most affected is the typical red Ferrallitic. The results obtained allowed to identify that two of the plots of this agro-system need a greater attention to diminish the effects of the central mechanism of syndrome of soil overuse. In general, managers can use the development of this mathematical model based on fuzzy logic as a tool to support decision-making in environmental management.

