


 Custom services
 text in
  English (pdf)
 Article in xml format
 Article references
 Send this article by e-mail
 Cited by SciELO
  Similars in
SciELO
Similars in
SciELO 
 Permalink
Milk production and persistency are two economic important traits in dairy cows. Persistency can be defined as the ability of a cow to continue producing milk at a high level after reaching the peak of lactation (Jamrozik et al. 1997) or the ability of a cow to maintain a relatively constant milk yield throughout lactation (Strabel et al. 2001). Thus, persistent animals are those that show flatter lactation curves (Togashi and Lin 2004). Higher persistency or a flat lactation curve has several advantages. This allows for better usage of cheap roughage (Solkner and Fuchs 1987), reduction of stress during peak production and increase profit (Weller et al. 2006) and finally, lower reproductive costs (Muir et al. 2004). Persistent animals therefore generate more return. Grossman et al. (1999) categorized persistency measures into three groups: 1. Measures expressed as a ratio (or a rate) of yields; 2. Measures derived from the variation of test day yields; and 3. Measures based upon parameter estimates from mathematical models of lactation curves. However, none of these measurements became the standard method for calculation of persistency. Lactation curves with lower peaks may be more persistent and the overall milk yield may therefore be larger in more persistent lactations. In animal breeding, random regression methodology (RRM) has been widely used for genetic evaluation of dairy cattle (Schaeffer and Dekkers 1994) and dairy sheep (Kominakis et al. 2001) using test day records. Random regression test day methodology provides the possibility of genetic evaluation for persistency (Jensen 2001and Mrode et al. 2002) as well. In other words, breeding values for persistency traits are the by-product of the application of random regression models in routine genetic evaluation (Harder et al. 2006). Druet et al. (2005) and Togashi and Lin (2006) described the persistency based on eigenvectors of the additive genetic matrices of random regression models. Evaluation of different persistency measures using a test day model by Jamrozik et al. (1997) and Jakobsen et al. (2002) showed that genetic correlation with lactation milk yield ranged from 0.10 to 0.55 while Cobuci et al. (2004) reported that the genetic correlation between persistency and 305 d milk yield ranged from 0.86 to 0.99, respectively. Cobuci et al. (2007) evaluated six different measures based on predicted breeding values (PBVs) for describing persistency with random regression methodology using only the Wilmink function to model the fixed part of the lactation curve, additive genetic (ad) and permanent environmental effects on days in milk (DIM) and demonstrated that the difference of VGP290 - VGP90 and  PBV-PBV280 are the most appropriate to describe persistency of milk yield. Togashi and Lin (2004) demonstrated that selection of the ratio of PBV280 to PBV65 (r280/65) improved both lactation milk yield and persistency. In that study, a fifth order Legendre polynomial was used to fit the lactation curve in the framework of RRM. Persistency must be uncorrelated with total milk yield and this allows more efficient selection of persistency and total milk yield simultaneously (Togashi and Lin, 2004 and Appuhamy et al. 2007). Cole and VanRaden (2006) proposed a method for calculating persistency that is phenotypically independent of milk yield. In this method, persistency can be calculated as a function of a standard lactation curve and a linear regression of a cow’s test day deviation on days in milk. They believed that this definition of persistency may be more useful than those used in test day models. This study aims to evaluate and compare milk yield persistency using best prediction and random regression test day methodology in Iranian primiparous Holstein cows.
Material and Methods
The original data set contained 637,902 records of test day milk yield of 76713 Iranian primiparous Holstein dairy cattle calving from 2001 to 2011. Wood’s incomplete gamma function was used to fit individual lactation curves, described as Yt=atbexp(-ct). The Wood model and its by-product parameters have proved powerful on fitting test day data in the tropical and sub-tropical regions (Rekik et al. 2003). In this description, yt is the daily yield on day t and a approximates the initial milk yields after calving, b is the inclining slope parameter up to yield peak, and c is the declining slope parameter (Wood 1969). Peak milk yield, the days at peak milk yield and total milk of 305 d were calculated as b/c, a(b/c)b exp-b, and  yi respectively (Appuhamy et al. 2007). Atypical lactation curves, which had negative values of a, b or c were not used to predict daily milk yield. The parameters of each individual curve were estimated using the nonlinear procedure (PROC NLIN) of SAS (Ver. 9.1 SAS Institute, 2004 Cary, NC) through the Gauss-Newton iterative method. Moreover, partial production from days 5-100 (Part1), 101-200 (Part2), 201-305 (Part3) and total production from day 5-305 (milk305 d) were calculated individually for each cow. VanRaden (1998) introduced a method (best prediction) of calculating persistency that is independent of yield. According to this method, persistency is a function of the test day yield deviation from the milk standard lactation curve (Yi- Si) and the test day days in milk deviation around a reference date (di d0)
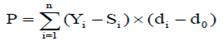
Where,
P |
- persistency of lactation |
Yi |
-ith test day yield |
Si |
- standard yield on ith test day |
di |
- days in milk at ith test day |
d0 |
- days in milk at the reference date |
Yi-Si |
- ith test day yield deviation from the standard yield |
di-d0 |
- ith test day days in milk deviation from the reference date |
n |
- total number of test day milk yield to calculate persistency |
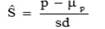
Cole and VanRaden, (2006) reported that a measure of persistency that is phenotypically uncorrelated with lactation yield may be obtained by defining d0 as a balance point between yields in early and late lactation. They determined d0 to be 128 days in milk for milk yield. A standardized estimate of persistency, Ŝ, was then obtained by subtracting the within lactation mean (μp) and dividing it by the within lactation phenotypic standard deviation (sd) of the calculated persistency:
Nowadays, calculation of persistency is based on by-products of the random regression test day model (Jensen 2001 and Cobuci et al. 2007). The following equation shows the model used for the random regression analysis:
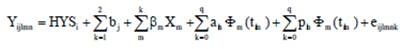
Where,
Yjlm |
- observation of test day n of cow l obtained in herd-year-season i |
HYSi |
- fixed effect of herd-year season of production (8,597 classes). |
bj |
- regression coefficient of age at calving as covariate (Linear and Quadratic terms). |
ßm |
- the coefficient of fixed regression for an average population curve (Legendre polynomial or Ali and Schaeffer functions). |
Φm(tm1) |
- the mth lactation age of the lth animal in DIM (t= 5,… , 305). |
q |
- the order of orthogonal Legendre polynomial. |
aln |
- additive genetic random regression coefficient for animal I. |
pln |
- permanent environmental random regression coefficient for animal I. |
eijlmk |
- random residual error. |
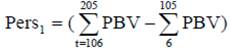
Different measures of persistency based on PBV were used in literature (Jakobsen et al. 2002; Cobuci et al. 2007 and Pereira et al. 2012). In this study two different measures of persistency (Pers1, Pers2) were used:
Selection based on partial PBV during lactation: (PBV from DIM 106-205 subtracted from PBV from DIM 6-105).
Selection based on partial PBV during lactation: (PBV from DIM 206-305 subtracted from PBV from DIM 6-105).

Furthermore, prediction of a 305 day breeding value for all animals, obtained by summing of PBVs for all days in milk of the lactation, as well as for the following criteria: PBV5-100 (Part1), PBV101-200 (Part2) and PBV201-305 (Part3), were calculated. According to the different measures of persistency, lower values of Pers1 or Pers2, indicate higher persistency because they are associated with slower rates of decline in production. The PEST software (2002) was used for coding the original data. The VCE6 software package (Kovac and Groeneveld, 2008) was applied for estimation of covariance components, random regression coefficients of additive genetic and permanent environmental effects of each animal based on restricted maximum likelihood (REML). The other parameters for covariance matrices of the random regression coefficients (phenotypic, additive genetic and permanent environmental variance, correlations and heritability) were calculated using IML procedure of SAS 9.1 software. And finally, calculations of the different persistency measures for each animal were done and evaluated using SAS programming.
Results and Discussion
The number of test day per cow ranged from 3 to 10, all cows were milked three times per day, both parents were known for all cows, age at calving was between 18 and 32 months and individual daily milk yields were between 2.5 and 60 kg. After editing, 435,390 test day records for milk yield remained of 48,955 dairy cows. The structure of data set and pedigree after editing is summarized in table 1.

The Pearson correlation coefficients between persistency (Ŝ) and 305 day milk yield at reference days from 120 to 130 days are indicated in table 2. From this table it is clear that the optimum reference day to be used in persistency formula is 130 days, because the correlation between 305 d milk yield and the persistency was nearest to zero. VanRaden, (1998) proposed day128 of lactation as reference day in primiparous Holsteins while Appuhamy et al. (2007) reported 128 and 125 days in milk for first and later lactations in American Holstein cows respectively.
Table 2 Pearson correlation coefficients (r) between persistency and 305 d milk yield at different reference day (d0) in primiparous Iranian Holstein dairy cows

Heritabilities for different partial milk yields, parameters of the lactation curve (peak time, peak yield and total 305 d milk yield) and Ŝ, obtained by univariate animal models as well as the phenotypic correlations amongst these measures are presented in table 3.
Table 3 Heritabilities and phenotypic correlations (±SE) between partial milk yields (Part1, Part2 and Part3), peak time (Ptime), peak yield (Pyield) and persistency measures (Ŝ)of primiparous Iranian Holstein dairy cows
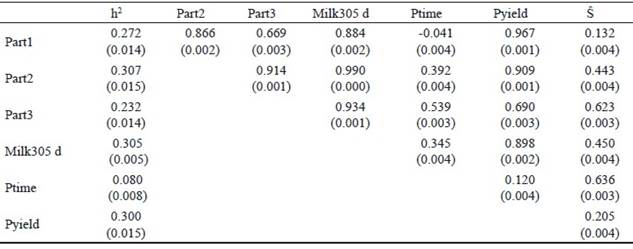
The ranges of the heritability for different parts of lactation were between 0.23 and 0.30. This indicates that the highest heritability was obtained in the middle of lactation and lower heritabilities in the beginning and end of lactation, which is in agreement with the results of Jakobsen et al. (2002). The heritability estimate of 305 d milk yield in the first lactation was 0.30. The heritability of 305 d milk yield was higher than that reported by Santos et al. (2013) in Guzerat cows. They reported a heritability of 0.24, while Yamazaki et al. (2014) and Farhangfar and Rowlinson, (2007) found heritabilities of 0.42 and 0.29 for Japanese and Iranian Holstein cows, respectively. In the present study a heritability of 0.08 was estimated for peak time of milk yield, which was similar to those reported by (Ferris et al. 1985) of 0.07 for first lactation American Holstein cattle and Muir et al. (2004) of 0.09 for first lactation Canadian Holsteins. Heritability estimates for peak yield and persistency were 0.30 and 0.11, respectively (table 3). Heritability estimates of this study for peak time, peak yield and 305 d milk yield are comparable to those reported by Farhangfar and Rowlinson, (2007) in Iranian Holstein dairy cows. A heritability estimate for milk production persistency of 0.11 indicates that this trait is lowly heritable. In general, heritability estimates for persistency vary significantly among persistency measures. Shanks et al. (1981) reported heritability for persistency of 0.02, using an incomplete gamma function, but Batra et al. (1987) reported a heritability of 0.21 for this trait in Canadian Holstein using gamma function. In study of Atashi et al. (2006) heritabilities based on univariate models were between 0.046 and 0.081 while Pereira et al. (2012) reported that heritability ranged from 0.10 to 0.25 in Brazilian Gyr cattle. In latter study persistency measures were calculated using function of estimated breeding value with random regression test day models.
Phenotypic correlations between partial yields and 305 d milk yield ranged from 0.88 to 0.99 in this study. The highest correlation was obtained between Part2 and 305 d milk yield. The phenotypic correlation between peak time and peak yield is low (0.12), which is in agreement with the finding of Boujenane and Hilal, (2012). The phenotypic correlations of 305 d milk yield with peak time, and peak yield were 0.354 and 0.890, respectively. Peak yield are therefore of more importance with regards to 305 d lactation milk yield. This means that cows with higher peak production will probably have a higher 305 d lactation yield and selection of cows for higher 305 d milk production based on peak yield will therefore be effective. Persistency of lactation is considered a very important feature of the lactation curve (Farhangfar and Rowlinson 2007). Correlation of persistency measures by best prediction method and Part1, Part2 and Part3 of lactation showed that cows with high persistency tend to produce less milk at the beginning of lactation and more at the end of lactation (table 3). Also, phenotypic correlation between persistency and 305 d milk yield was 0.45 in this study. According to Solkner adn Fuchs (1987), the relationship between total milk yield and persistency depend on the persistency measures. Based on the definition of persistency, some researchers calculated a positive phenotypic correlation between persistency and 305 d milk yield but some others found that the persistency was negatively correlated with total milk yield. Farhangfar and Rowlinson, (2007) obtained an estimate of 0.23 for this relationship in Iranian Holstein heifers using incomplete gamma function while Boujenane and Hilal, (2012) reported that the phenotypic correlation between persistency and 305 d milk production in morocco dairy cows using the Wood function was -0.25.
The most values of Ŝ ranged from -3.8 to +3.8 in this dataset. The frequency histogram of persistency is shown in figure 1. Distribution of persistency is normal and the average persistency, based on the best prediction method is close to zero. The mean and variance of Ŝ are 0 and 1, respectively. The positive value of Ŝ indicates increased persistency relative to that of the standard lactation curve (which was fitted based on the mean daily milk yield using the incomplete gamma function) and negative values of Ŝ indicate decreased persistency (figure 1). These results are similar to those reported by Appuhamy et al. (2007) in the evaluation of persistency using the best prediction method in primiparous and multiparous cows.
Lactation curves of cows with the highest (Ŝ>3) and lowest (Ŝ<3) persistency, as defined by the best prediction methodology, are presented in figure 2. As expected, the shape of the lactation curve in cows with high persistency is completely different to that of cows with low persistency. Pereira et al. (2012) reported that persistency does not depend on the level of milk production or the breeding value of milk, but it is related to the shape of the lactation curve for, 305 d milk yield. Furthermore, the calculation of persistency using best prediction methodology forced lactation persistency to be independent of 305 d milk yield and cows with high persistency have higher yields in long lactations (Cole and VanRaden, 2006). The peak time of the cows in this study with high persistency is around 120 days, but in low persistency cows it is around 52 days (figure 2). The positive phenotypic correlation (0.643) between peak time and persistency (table 3) suggests that cows reaching peak yield later during the first lactation would have higher persistency. This is in agreement with the findings of Farhangfar and Rowlinson, (2007); Appuhamy et al. (2007) and Muir et al. (2004), who reported that lactations with delayed peak yields are more persistent.
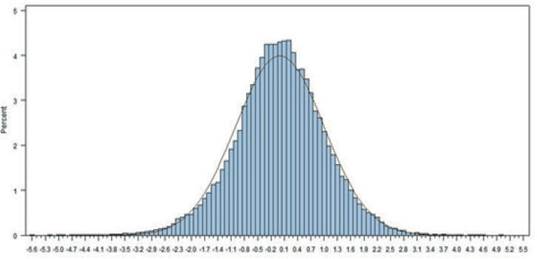
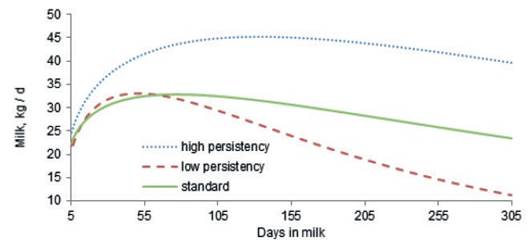
Figure 2 Comparison of lactation curves of cows with high persistency (Ŝ>3), low persistency (Ŝ < -3) and standard lactation curve for Iranian primiparous Holstein cows
The heritability estimates of milk yield and the ratios of the permanent environment and residual to phenotypic variances as a function of stage of lactation were calculated and are shown in figure 3. The heritability of milk yield increased slightly over the trajectory of lactation, reaching the highest estimate at 200 to 250 days in milk followed by slight decreases until the end of lactation. The highest and lowest heritability of estimate were observed near the end (0.24) and the beginning (0.07) of lactation, respectively. These results confirm the findings of a previous study (Elahi Torshizi et al. 2012) and that of other researchers (Muir et al. 2007 and Kheirabadi and Alijani 2014), which reported the highest heritability of test day milk yield at the end of lactation. According to the results, residual variance was high at the beginning of lactation and decreased steadily towards the end of lactation. The ratio of the permanent environment to phenotypic variance showed however, a different trend. Takma and Akbas, (2007) showed that the shape of this ratio decreased at the beginning of lactation and then increase till the end of lactation.
Van Vleck and Henderson, (1961) found that yield at the start and end of the lactation were subject to more temporary environmental variation than yield in mid-lactation, which is influenced more by genetic and permanent environmental differences between cows. Estimates of correlation for additive genetic and permanent environmental effects at different DIM over the trajectory of lactation, from the RRM model, are presented in figure 4. Similarly to the findings of other researches (Jakobsen et al. 2002 and Biassus et al. 2010) with regards to random regression model results, the genetic and environmental correlations between different test days tend to decrease at the extremes of the lactation period, but being close to unity in adjacent test days. The general statistics for PBVs for the different measures of persistency (Pers1 and Pers2), for partial milk yields, as well as 305 days lactation yields of Iranian primiparous Holstein dairy cows are shown in table 4. The average breeding value of Pers2 is lower than that of Pers1 but Pers2 shows more variation compared to Pers1. According to different measures of persistency, lower values of Pers1 and Pers2 indicate better persistency, because it is associated with a slower rate of decline in production after peak. According to tables 4 and 5, it seems that Pers2 can describe persistency better than Pers1 measure.
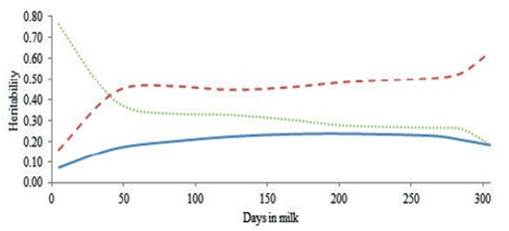
Figure 3 Heritability of test day milk yield (solid line), the ratio of permanent environment to phenotypic variance (dashed line) and the ratio of residual to phenotypic variance (dotted line) during lactation by RRM for Iranian primiparous Holstein cows
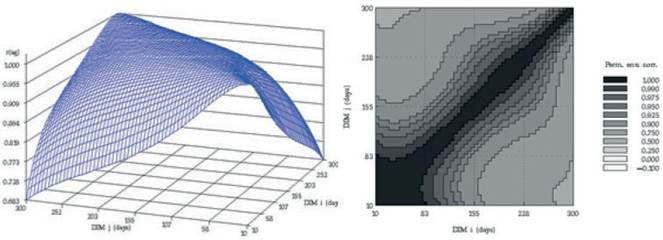
Figure 4 Additive genetic (left) and permanent environmental (right) correlations between days in milk over the trajectory of lactation using a RRM model for Iranian primiparous Holstein cows
Table 4 Mean (±SE), standard deviation (SD), minimum and maximum of PBV for different measures of persistency, partial milk yields and 305 d lactation milk yield of Iranian primiparous Holstein cows
The heritability estimate of the different measures of persistency (Pers1 and Pers2), partial milk yields, as well as genetic correlations between the predicted breeding values of these measures are presented in Table 5. Heritabilities for two persistency measures (Pers1 and Pers2) are 0.090 and 0.185, respectively.
Table 5 Heritabilities and genetic correlations (±SE) between the predicted breeding values for different persistency measures and partial milk yields in Iranian primiparous Holstein cows
The heritability of Pers1 and Pers2 were comparable to the findings of Kheirabadi and Alijani (2014) who evaluated several measures of persistency using multitrait RRM methodology in Iranian Holstein cows (0.08 and 0.22) but different to the results of Jakobsen et al. (2002), who reported the heritabilities of 0.24 and 0.20 for Pers1 and Pers2 in first-parity Danish Holsteins using random regression models.
The main reasons for differences in heritability estimates may be attributed to different orders of polynomial functions used in models for estimation of genetic and environmental effects and also due to differences in the structure of the datasets. The genetic correlations between PBV of partial milk yields, persistency and accumulated yield were positive and high (table 4). The correlations between Pers1 and Pers2 with PBV of 305 d milk yield are 0.98 and 0.91, respectively. A persistency measure with lower correlation with 305 d milk yield is optimum. This study’s findings therefore indicate that Pers2 have higher heritability and lower genetic correlation with 305 d yield compare to that of Pers1. Hence, it is recommended for measuring of persistency using RRM. This is in agreement with the result of Kheirabadi and Alijani, (2014) who reported that Pers2 is the preferred measure for milk yield persistency in Iran. The heritability of Pers2 is also higher than that of Ŝ. Biassus et al. (2010) reported that, the heritability of some persistency measures (∑t-60EBV-EBV60 ) and (EBV290- EBV90) which were calculated using RRM, were low. Calculation of persistency with best prediction methods is simple and powerful. This method is independent of yield with low correlation with 305 d milk yield and relatively small heritability. But in RRM, different orders of Legendre polynomial and mathematical functions can be used. Moreover, genetic yields for each single day of the lactation can be estimated by this method and due to this flexibility, different measures of persistency can be proposed with higher heritability and lower genetic and phenotypic correlation with total milk yield compare to best prediction method. This makes the calculation of persistency to have more advantage based on RRM compare to ratio methods and even best prediction of lactation persistency.
Conclusion
In this study, the persistency of milk yield was evaluated using two methodologies, namely random regression and best prediction. In best prediction methodology, the phenotypic correlation between peak time and persistency was high and lactation curve of the cows with higher persistency was completely different compare to standard lactation curve. Heritability and genetic correlation among various persistency measures considerably depend upon the way that the persistency measure is defined. High positive genetic correlation between persistency measures of RRM and 305 d milk yield resulted in genetic improvement of total milk yield and consequently persistency. The heritability of Pers2 is higher than that of Pers1 and Ŝ. Although by using RRM, due to higher flexibility (different Legendre polynomial orders and functions fitted in fixed and random parts of the model and the possibility of defining various persistency measures based on PBVt) random regression model could be a preferable method for evaluation and selection of cows for persistency compared to best prediction and other methods.

