


 Servicios personalizados
 texto en
  Inglés (pdf)
 Articulo en XML
 Referencias del artículo
 Enviar articulo por email
 Citado por SciELO
  Similares en
SciELO
Similares en
SciELO 
 Permalink
In tropical and subtropical countries, the production of meat and milk is basically supported by C4 grasses, accompanied by legumes typical of warm areas (forage, shrubs and tree). These fresh forages, especially grasses, are exposed to stressful environmental conditions, typical of those regions: high temperatures, radiation and humidity that vary the different chemical indicators (values of crude protein from moderate to low, digestibility, soluble carbohydrates and starch, and values of NDF, ADF lignin from moderate to high) (Del Pozo 2004 and van Soest 2012). This affects, significantly, the productive and economic indicators of livestock systems (Rearte 2010).
In general, tropical grasses (C4) are used in two different ways: for cutting or direct grazing. The traditional management (TM) of these forages, for direct grazing as for cutting, is composed of three basic principles: 1) the old material from the previous vegetative cycle (dry season or cold season with frosts) is not removed with a mower; 2) begins to graze or cut with machines, when the plants reach more than 1.20 m in height; 3) normally, intensive grazing (3-7 d of interval) is not done with electric fences, without weeds or with opportune cut. Nor is intensive or periodic cuts made when mechanical grazing is used.
With TM, tropical plants (C4) have very unbalanced the energy-protein indicators. Under these conditions, the quality of forage is not adequate to reach high productions of meat or milk (>0.500kg of meat/animal/d or> 12 L of milk /cow/ d, respectively).
The objective of this study was to evaluate the productive and economic response of Siboney heifers in direct grazing of Guinea Likoni with traditional management (TM) with respect to improved management (IM), with the addition or not of a protein concentrate (soybean expeller) and in low proportions (700 to 800 g CP/animal/d).
Materials and Methods
The Instituto de Ciencia Animal (ICA) is located at 22°53 'north latitude and 82°02' east longitude, in Mayabeque province, at an altitude of 80 m o.s.l, 60 km from the Havana City, Cuba.
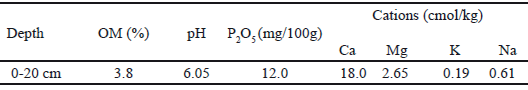
Tables 1 and 2 show the physical-chemical characteristics of the soil and the climatic variables (rainfalls and temperatures) during the test.
In this experiment ten heifers from Siboney breed (5/8 Holstein and 3/8 Cebu) were used in direct grazing of Panicum maximum cv. Guinea Likoni, in monoculture located in the development area of ICA.
The grass was sowed in 2000, with sowing density of 7 kg/ha. It did not receive fertilizer or complementary irrigation. The surface of Panicum maximum cv. Guinea Likoni was 22 ha, distributed in three treatments with 30 Siboney heifers (5/8 Holstein and 3/8 Cebu) of 187.67 ± 11.66 kg LW initial/ animal. The experiment was extended for 91 d, from May 30 to August 29, 2014 (rainy season). The experimental unit was the animal.
The following treatments were evaluated: T1) traditional management without complementary protein concentrate (TMwc); T2) improved management without complementary protein concentrate (IMwc); T3 improved management with complementary protein concentrate (IMwsc).

T1 (TMwc). It was not weeded or cut previous to the test. The allocated area was 9 ha. Extensive grazing was carried out without electric fence. The area was divided into two paddocks or plots of 4.5 ha each. The animals remained in each paddock for more than 30 d. The grazing range (height) was 1.0-1.2 m (initial) up to 1.6-1.8 m (final); the average live weight, of 221.5 kg / head, and the stocking rate of 1.1 heads/ha (243.7 kg LW / ha, average test).
T2 (IMwc). The weeds were removed or cutted at 45 d previous to the start of the test. The allocated area was 6 ha. Intensive grazing was carried out with electric fence with weekly rotation (7 d). The grazing range was 0.4 m (initial) to 0.8-1.0 m (final); the average live weight, of 221.1 kg/head and the stocking rate, of 1.67 heads/ha (equivalent to 369.24 kg LW/ ha, average test).
T3 (IMwsc). It was weeded or cutted at 45 d previous to the start of the test. The allocated area was 5 ha. Intensive grazing was carried out with electric fence with weekly rotation (7 d). It was supplemented with soybean expeller (± 0.5% of LW) as a complementary protein concentrate. The grazing range was from 0.4 m (initial) to 0.8-1.0 m (final); the average live weight of 225.4 kg / head and the stocking rate of 2.0 head/ha (equivalent to 450.8 kg LW / ha, average test).
All three treatments were supplied with a base ration to ensure a minimum level of protein, energy and minerals, due to the use of newly weaned and fully growing animals (pre-fattening).
The base ration was composed of a mixture of expeller or soybean cake, sugarcane molasses and minerals. It was supplied at a rate of 1 kg ration/head/d (± 0.5 % of the LW). The chemical composition was 19.2 % CP; 2.78 Mcal ME/kg DM and 76.8 % digestibility. In turn, the third treatment was supplied additionally, at a rate of 1 kg of soybean expeller (± 0.5 % of the LW) (47.5 % CP, 2.93 ME/kg DM and 81 % digestibility) as a complementary protein concentrate.
The analyzed indicators were crude protein (CP), neutral and acid detergent fiber (NDF and ADF), NDF digestibility, acid detergent lignin (ADL). The chemical analysis of the different samples was performed in the ICA laboratory. The techniques used were: DM (drying at 60 °C constant weight), CP (AOAC 005), NDF and ADF (Van Soest 1994 with ANKOM equipment) and ADL (Goering and Van Soest 1970).
To determine the quality of the forage intake by the animals, the manual cutting sampling technique was used in each treatment. The manual cutting was performed simulating the cut made by the animals (Gallegos 2010). The interval between cuts was every ± 30 d, on the same day that supply and rejection was measured. This technique consists of cutting the forage with the hand to the height that the animals intake it, respecting the remnant left by them. In each plot (treatment) and every four weeks, six sub-samples cut with the hand were extracted. These were divided into two groups, composed of three subsamples composite /group/treatment.
Each of these compound samples (minimum ± 200 grams MV/treatment/repetition/sampling) were weighed in fresh (MV). Then, they were dried in an oven at 60°C until reaching constant weight (DM). Subsequently, they were taken to the laboratory in identified nylon bags (date of sampling, treatment and repetition) to proceed to the different chemical analyzes.
The forage supply was measured (kg DM/ha), which was determined by cutting, every 30 d, from the moment in which the animals entered the test until its end. To do this, 10 frames of 1 m2 each were randomly thrown per treatment on the day of weighing the animals, following a transect in the grazing strip, previous to the entry of the animals.
In order not to affect the availability of grass in the next plot where the animals were, it was cut with a knife 10 cm height from the soil in a strip located further on. The grass (fresh), as obtained, was weighed in the same experimental site. This data showed the supply of forage measured in kg MV/ ha/ treatment/ sampling. A portion of grass was taken (± 200 grams of MV/repetition) and was dried in an oven at 60 °C, until reaching constant weight to determine the DM percentage. In this way, the forage supply was obtained, but measured in kg DM/ha/treatment/sampling.
For the rejected forage the previous methodology was used. It was try to measure the offer on the same day, on a new plot, and the rejected forage on the last grazed plot. For this, it was cut 10 cm from the soil in the ten frames thrown at random, following a transect.
The forage was weighed in the same place and taken to the laboratory to make DM. In this way, the data of the kg DM/ha/treatment/sampling of the forage rejected by the animals was obtained by means of the following formula:
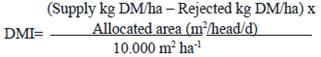
Forage intake per animal (DMI). It was determined by the difference between supply and rejection (kg DM/ha), multiplied by the allocated area per animal and per day. The result was divided by the square meters of one hectare. It was expressed in kg DM/head/d.
Forage allocation and grass management. The allocated area to each animal was based on the requirements and availability of grass. It was expressed in kg DM per 100 kg LW/d. The grass management was done with electric fence, with changes every 5 or 6 d.
Conversion efficiency (Cv E). It is the quotient between the daily DM intake and the daily weight gain, mean, expressed in kg of food/kg produced.
Digestible and usable forage production and energy concentration. With the intake and quality information of the intake grass, the production of digestible and usable forage was established (kg DM/ usable digestible/ha and energy concentration of the DM-Mcal ME/kg DM) in the different evaluated periods.
Daily weight gain (DWG). The animals were weighed on an individual electronic scale, with an interval of ± 30 d.
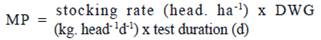
Meat production (MP). It was expressed as kilogram produced per hectare during the experiment. The MP arises from the following equation:
The direct production costs (PC) were determined, that is, the direct costs, exclusively, because the indirect costs (animal capital, land capital, maintenance, amortization, etc.) are specific to each livestock enterprise, and do not allow compare technologies with each other
The used values were:
Implementation of Panicum maximum (seed, labor, maintenance of machinery, weeding or cutting, etc.). TM = 200 USD/ha (without removing weeds or without cutting), with division of the number of production years (for example, 20 years). The annual amortization is 10 USD/ha/year.
IM = 300 USD/ha (with weeding or cutting), with division of the number of production years (for example 20 years). The annual amortization is 15 USD/ha/year. It was considered, arbitrarily, a duration of 20 years, although there is a longer history of the Panicum under study.
Due to the 80 % of the production (kg DM) of these Panicum was concentrated in the production costs (PC), that same proportion of the repayment installment was considered. That is to say, the quota that was affected in the PC was 12 USD/ha (IM) and 8 USD/ha (TM).
Employed staff. One worker was contract every 500 ha during the three months of the test, which is equivalent to 8 USD/ha (32 USD/ha/year) (salary + social contributions + bonus). The proportional part of an employee affected to work represents 1,230 USD/ employee/month.
Concentrate. Base ration (Cuba)=180 USD/t (0.18 USD/ kg x 91 d x 1 kg / head (test) = 16.4 US / head Soybean expeller (Cuba) = 200 USD/t (0.20 USD/kg x 91 d x 1 kg / head (test) = 18.2 USD/head) Health = 10 USD/head (test period)
Miscellaneous (expenses proportional to the duration of the test by input of the electric fence, maintenance of water, among others) = 5 USD/ha (test period)
The guidelines or principles that characterize the improved management (IM) are composed of four differential points:
Cleaning cut, from 45 to 60 d previous to the start of the next grazing season (wet season or spring- summer, depending on the hemisphere). The purpose of this cleaning cut is to remove the old material left over from the previous campaign. This cut can also be done with the animals teeth, especially if they are cows or bulls. The objective is to promote a healthy and high quality regrowth.
Intensive grazing (changes every 3 to 7 d per plot - maximum), with high stocking rate (fitted to forage production and category of animals) with range of use (grazing height) that should vary between 0.4 and 1.0 m of height (measured by stretching the upper leaves). The objective is for the animals to eat higher quality forage (high CP and digestibility and low fiber levels), typical of the grass with that range or grazing height.
Without weeds or with appropriate cutting, to standardize the stubble left after grazing when it is very irregular. Or when for one reason or another it cannot be intake at the appropriate height, either by an excess of volume or low stocking rate. In this case it can be used to make some type of forage reserve. The objective is always to eliminate stubbles or residues of lower quality (fibrous) or to prevent plants losing quality, when it exceeds 1.0 m in height. This will promote a new regrowth, with higher levels of protein and digestibility.
Additional protein concentrate, in low proportions (0.5 to 1 % LW), when looking for high weight gains (> 800 grams per day). The decision to use or not a protein concentrate will depend on the category of the animals and the costs of the concentrates.
Results and Discussion
Tables 3, 4, 5, 6 and 7 show the forage production (supply and rejection), intake, forage allocation, the quality of Guinea and the intake diet and the nutritional balance.
Tables 8 and 9 show the productive results (weight gains), conversion efficiency and meat production for each treatment and production costs (USD / kg meat produced).
In order to make a deeper discussion, the information was divided into several items.
Rate and growth curve. The heifers from Siboney breed have the growth peak (start of the plateau or meseta) between 350 and 380 kg LW. From these live weights, weight gains diminished as the live weight increases (Bavera 2005 and Agudelo Gómez 2010).
This physiological performance manifests itself, as long as the energy-protein quality of the diet is adequate. When this does not happen, the growth curve does not follow a definite pattern but is fitted to the quality of the ingested foods (Dimarco and Aello 2004 and Fernández Mayer 2012).
Table 3 Offer, rejection and food intake of the entire test
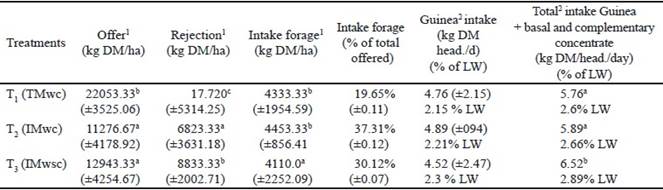
1Total forage production of the test (offer, rejection and intake)
2Average intake of the test
3Different letters indicate significant differences (P<=0.05)
4Standard deviations in parentheses
TMwc: traditional management without protein concentrate IMwc: improved management without protein concentrate IMwc: improved management with protein concentrate
Table 4 Forage allocation (kg DM/100 kg LW)

1Stocking rate (heads/ha) x live weight (average) (kg LW/head)= stocking rate in kg LW/ha2)
2Forage production (kg DM/ha) / stocking rate (kg LW/ha)= forage allocation (1 g DM/100 kg LW)
Table 5 Nutritional quality of guinea intake (information from hand-placking samples)
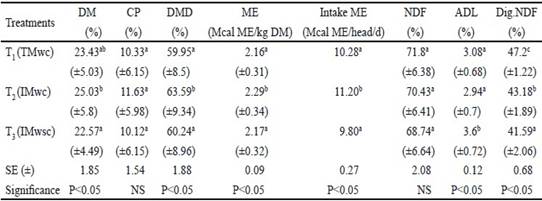
Standard deviations are in parentheses. Different letters indicate significant differences (P <= 0.05)
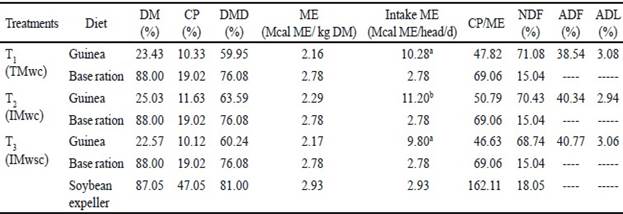
Table 7 Balance of diets
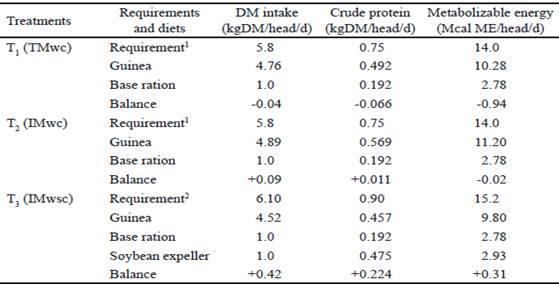
1Big biotype heifer 225 kg LW (average) for a daily weight gain 0.730 kg/head/d.
2Big biotype heifer 225 kg LW (average) for a daily weight gain 0.830 kg/head/d.
Table 8 Daily weight gain, conversion efficiency and meat production
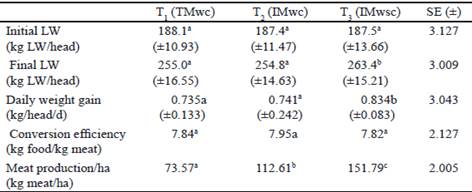
abcDifferent letters indicate significant differences (P<=0.05).Standard deviation beteween parentheses. SE: Standard error
TMwc: traditional management without protein concentrate IMwc: improved management without protein concentrate IMwsc: improved management with protein concentrate
Table 9 Direct production cost of each treatment
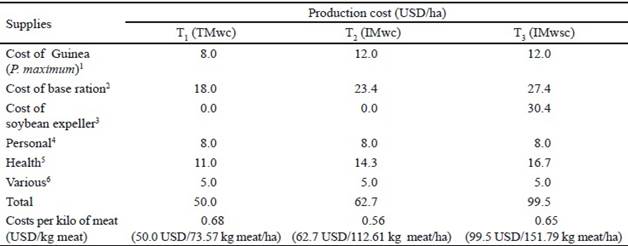
Stocking rate: T1: 1.1, T2: 1.67 and T3: 2.0 heads/ha.
1Implementation: a duration of 20 years was arbitrarily considered (repayment installment (T1: 10 USD/ha; T2 and T3:15 USD/ha, to each amortization cost, 80 % of the concentrated production must be multiplied during the test).
2Cost of base ration: 16.4 USD/head x stocking rate (head/ha)= USD/ha.
3Soybean expeller: 18.2 USD/head x stocking rate (head/ha) = USD/ha.
4Personal: 8.0 USD/ha.
5Health: 10.0 USD/head x stocking rate (head/ha) = USD/ha
6Various (5 USD/ha)
Due to Siboney heifers had a start live weight (± 188 kg/head) and test ending (± 260 kg/head), they did not reach the peak (plateau) of the growth curve, they were always in the slope of maximum growth (higher efficiency of food transformation in meat) with adequate diet.
Effects of the IM on production, forage quality and meat production. In the Panicum sp., among them the Guinea, the most digestible material are the leaves of the upper part (60-70 % of digestibility) and, in lower proportion, those of the lower portion (50-55 %) (Barahona Rosales and Sánchez Pinzón 2005 and van Soest 2014).
Similarly, the stem digestibility decreases from 45- 55 % at the highest end, and from 35-45 % at the lowest end. In similar growth conditions, tropical plants have three times more variation in their digestibility than temperate grasses. This has a very important meaning in the management of these plants in the different regions (van Soest 2014).
The defoliation and the intense use of the forage that characterizes the improved management (IM) increase the protein levels and the plants digestibility. in particular, those of tropical origin or C4. Due to a better quality forage is offered, the digestible DM intake increases, and with it the production of meat or milk, although the total DM production per hectare and root development is lower (Yrausquín et al. 1995, Bernal and Espinosa 2003 and van Soest 2014).
When the animal performance is analyzed through the DM intake, and the level of use of fresh forage is also considered, it would be necessary to analyze what is the objective of the productive system, if more grass or more meat or milk is sought (Santini 2004).
The average forage allocated per animal was 16.64 kg DM/100 kg LW. There was excessive availability of forage. Meanwhile, the DM concentration of Guinea Likoni was 23.68 ± 0.31 % DM.
In order to achieve the maximum DM intake, in addition to an energy-protein balanced forage, an amount of forage should be assigned not less than 3.50 kg DM per 100 kg LW/d, with DM concentration between 22 and 24 %, at a grazing height between 25 and 30 cm (Cangiano 1997 and Romera et al. 2008). In this way, the maintenance energy expenditure for forage intake is reduced, and a higher percentage of energy for meat production is left (Dimarco 1998 and Dimarco and Aello 2004).
However, the high forage allocation and grass quality in TM treatments were adequate, although some values were slightly lower than those of IM. This explains why high gains (0.7-0.8 kg/head/d) were obtained with TM, especially when compared to other studies, such as Miranda Mejía and Osorio Aparicio (2012), who obtained <500 g daily, without the addition of concentrate. The high weight gains, obtained with TM, were the product of a higher selection of forage by the animals, due to the effect of the low stocking rate (Ferragine 2009).
This higher selection resulted in the intake of better quality forage, which is clearly observed in the balance of the diets, which corresponded to the obtained weight gains. In all cases, the energy and protein contributions of diets perfectly covered the requirements of the animals.
If the stocking rate were increased to improve the use of grass, especially in TM treatments, and with animals of the same weight and breed, weight gains would be reduced proportionally to the quality of the intake forage. However, it would improve, in certain limits, the meat production per hectare (kg of meat/ha) and reduce the production cost (Rearte 2010). Although the decision to increase the stocking rate in an excessive way, by thinking only of better forage use, can cause significant deterioration of profits and the general condition of the animals, affecting the fattening and consequent reduction of meat production per hectare instead of increasing it (Fernández Mayer et al. 2012). Therefore, the stocking rate must always be fitted according to the category of the animals, the speed of fattening and the supply and quality of the available forage. Based on these factors, the most appropriate management criteria are adopted.
When the ME intakes are analyzed and compared with the corresponding requirements, they perfectly cover the energy demands of the different treatments, being in few cases slightly negative. This shows that the weight gains were consistent with the energy contribution of diets, without requiring any tissue mobilization (Dimarco and Aello 2004).
The production, such as the quality of guinea grass in this study, agrees with those reported by De León (2008), when the interval between defoliation was 28 d and for the same season of the year (summer). While, the protein levels achieved in both tests were higher (> 10 % CP) than those of Privitello (2004), who used P. coloratum cv. coloratum fertilized with nitrogen, with results that did not exceed 6 % of CP during the summer-autumn months in Argentina.
The mean CP/DM ratio of all treatments was ± 48.4 g CP/Mcal ME (46.6 to 50.79), which coincides with the minimum levels required for the fattening of British heifers and indica crosses (Fernández Mayer and Tomaso 2003 and NRC 2012).
The NDF levels found by this same author were similar to those obtained in this study (± 70 %). However, the same did not happen with lignin levels that were much lower (4 % vs 8 %) than those found by Privitello (2004).
The treatments that were exclusively Guinea Likoni had adequate weight gains, but with low meat production per hectare, due to the impact of low stocking rate in proportion to the forage supply.
The T1 -TMwc- (traditional management without concentrate) and T2 -IMwc- (improved management without concentrate) had 0.735 and 0.741 kg/head/day and 73.57 and 96.43 kg/ha, respectively. Meanwhile, the treatment to which the soybean expeller was added, T3 -IMwsc- (improved management with soybean concentrate), reached 0.834 kg/head/day and 126.74 kg/ha, for weight gain and meat production, respectively.
In this study, the effect of substitution with addition was clearly observed when the protein concentrate was supplied. That is, there was replacement of grass by concentrate, increasing total intake and with it, weight gains (Fernández Mayer and Tomaso 2003).
The addition of soybean expeller increased intake by +11 % (6.52 vs 5.89 kg DM/cab/ d) and + 13 % the weight gain (0.834 vs. 0.741 kg/cab./d, for IMwsc and IMwc, respectively). The animals were able to select the intake forage, looking higher quality, helped by the low stocking rate, especially in treatment 1 -TMwc- (control). For this reason, the soybean expeller had lower impact on the P-E balance of the diet (Dimarco and Aello 2004).
This productive performance was consistent, when analyzing the conversion efficiency (CE). As the quality of the offered forage decreases, the DM intake is affected, and with it the weight gains are reduced, which affects the CE. That is, a higher DM intake is required to produce 1 kg of meat (Aello and Dimarco 2004).
The treatment to which soybean expeller was added (T3 -IMwsc-) had a slight improvement of the CE (+ 0.01 %) with respect to the other two treatments (7.82 vs 7.9 kg of food/kg meat, respectively). In addition, the Siboney heifers, being in full growth stage (maximum slope of the growth rate) had adequate CE (7.82 to 7.9 kg of food/kg of produced meat).
Comparative economic analysis. The production cost was very adequate to achieve higher sustainability, productive, economic and social of the productive systems. The average cost was 0.63 USD/kg produced, with variation range between 0.40 and 0.93 USD/kg.
The production costs coincide with other studies carried out in pastoral fattening systems, with use of low proportions of concentrate or without them (Fernández Mayer and Delgado 2009 and Martínez Ferrario 2010).

