


 Servicios personalizados
 texto en
  Inglés (pdf)
 Articulo en XML
 Referencias del artículo
 Enviar articulo por email
 Citado por SciELO
  Similares en
SciELO
Similares en
SciELO 
 Permalink
Introduction
Since its creation in 1965, the Institute of Animal Science has an area for the meteorological station of second order in charge of collecting data of several climate indicators. The first information was published by Herrera et al. (1977) and covered the period from May, 1966 to April, 1974.
It is known the importance of climate factors in social and economic life of a country. Thus, it is a constituted science that plant species are able to exist, reproduce and survive only in certain climatic and edaphic contexts, which can be considered as the tolerance of species to these conditions.
With the development of science it, has been shown that not only climatic factors influence on the plant productivity. Factors such as soil characteristics, fertilization, water availability, sowing season and management, among others, have an important function in plant production systems. Grasses are a clear example of the aforementioned and, under the conditions of Cuba, there is information on the influence of climate and management factors on their performance (Crespo and Herrera 1982, Herrera and Ramos 2006 and Herrera 2015).
Fonseca-Rivero et al. (2018) noted that mean temperature in Cuba has tended to increase from 1961 to 2017, while in the rain occurred the opposite. Duran-Llacer (2016) studied the distribution of days with rain and drought periods in the Western region of Cuba and reported variability and intensity of these factors, while Lapinel-Pedroso et al. (2015) studied the agricultural and meteorological droughts and indicated their dangers in different regions of Cuba.
Taking into account the previous information, to the extent that the performance and magnitude of the variability of climatic factors is known, it will be possible to influence the production of viable and environmentally friendly productions, especially at this stage where climate change is already present.
Due to the function of climate in plant production, the objective of this study was to determine the performance of some climatic factors in the period 1967-2013 in the Institute of Animal Science and relate it to forage production.
Materials and Methods
Localization. The meteorological station of the Institute of Animal Science is located in Havana- Matanzas plain, San José de las Lajas municipality, Mayabeque province and specifically located at 22° 53' North and 82 ° 02' West, at 80 m over sea level.
Procedure . Data was taken from the files of this station and the indicators were the following: total rainfall, number of days with rain, minimum, maximum and mean temperatures, minimum temperature lower than 15 °C and maximum temperature higher than 27 °C. This information covered the period 1967-2013.
Data processing and statistical analysis. The first stage consisted of obtaining mean or total values (according to the indicator) of each month in every year. Later, the values were obtained for the year and for each climate season (dry and rainy season). Afterwards, this information was grouped by decades. The statistics mean, variance, standard deviation and coefficient of variation were determined. In addition, regression analysis was carried out between years (independent variable) and climatic indicators (dependent variable). The best expression was selected when taking into account the highest value of Pearson coefficient and high significance. Furthermore, data of height and performance of Cenchrus purpureus published in the Cuban Journal of Agricultural Science was used to know the effect of climate factors in the 1970´s and 2000´s. For all the above, the SPSS (Visauta 2007) program was used.
Results
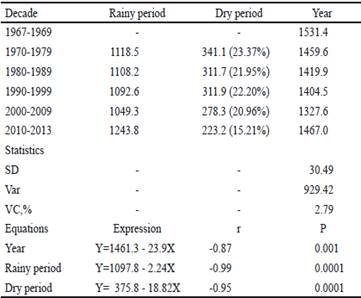
Precipitation of each decade decreased as time passed. The differences between the decades of 1970- 1979 and 2000-2009 were 69.2, 62.6 and 132 mm of rainfall for the rainy, dry and annual periods, respectively. Precipitations per decade had high variance and low coefficient of variation. It was observed that the percentage of rain in the dry season tended to decrease with time. A linear regression equation was fitted between rainfall and years for each stage. Pearson coefficient was highly significant for the three expressions and the highest slope was registered in the expression of year, while the lowest was for dry season (table 1).
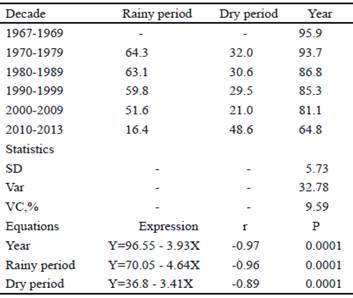
The number of days with rains decreased in the two seasonal periods and in the year with values that ranged between 11.0 and 12.7 days. Standard deviation, variance and variation coefficient for the year were 5.73, 32.78 and 9.59 %, respectively. Linear regression equations between the number of days with rain and the years showed highly significant Pearson coefficients for the three expressions and the highest negative slope was registered in the rainy period, while the lowest was for the dry season (table 2).
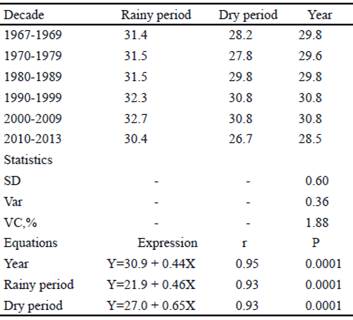
The maximum temperature in the two seasonal periods and in the year showed a tendency to increase that ranged between 1.2 and 3.0 °C, being this variation more significant during dry season. Values for standard deviation, variance and variation coefficient for the year were 0.60, 0.36 and 1.88 %, respectively. The relationships between maximum temperature and the years showed highly significant Pearson coefficients for the three expressions and the highest slope was registered in the dry season, while the lowest was for the year (table 3).
The number of days with maximum temperature higher than 27 °C increased in the two seasonal periods and in the year. The increase varied between 21.5 and 56.7. Values for standard deviation, variance and variation coefficient for the year were 15.25, 232.75 and 10.32 %, respectively. The relationships between the number of days with maximum temperature higher than 27 °C and the years showed highly significant Pearson coefficients for the three expressions and the highest slope was registered in the year, while the lowest was for the dry season (table 4).
The minimum temperature in the two seasonal periods and in the year showed a tendency to increase that ranged between 0.8 and 3.0 °C, being this more significant in the rainy period. The values for standard deviation, variance and variation coefficient for the year were 0.61, 0.44 and 2.5 %, respectively. The regression equations between minimum temperature and the years showed highly significant Pearson coefficients for the three expressions and the highest slope was registered in the year, while the lowest was for dry season (table 5).
The number of days with a minimum temperature of less than 15 °C, only present in dry season, decreased up to the decade of 2010 and this decrease was 13.5 days. The values for standard deviation, variance and variation coefficient were 7.33, 53.77 and 14.59 %, respectively (table 6). The regression equation between this indicator and the years is represented by Y=63.35 - 5.23X, r=-0.92, and P = 0.0001. Mean temperature in the two seasonal periods and in the year showed a tendency to increase that oscillated between 1.4 and 2.4 °C, being this more significant in the rainy period. The values for standard deviation, variance and variation coefficient for the year were 0.61, 0.44 and 2.50 %, respectively. The relationships between mean temperature and years showed highly significant Pearson coefficients for the three expressions and the highest slope was registered in the dry season, while the lowest was for the year (table 7).
Table 4 Fluctuations of number of days with maximum temperature higher than 27 °C between 1967 and 2013
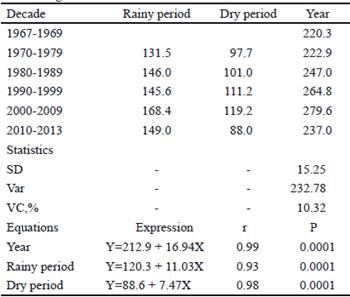
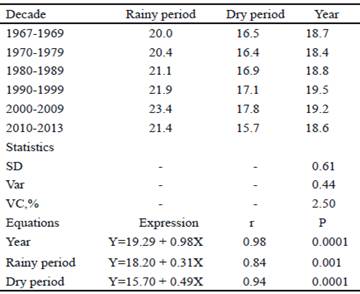
Table 6 Values of the number of days with the lowest minimum temperature of 15 °C in the dry season in the period between 1967 and 2013
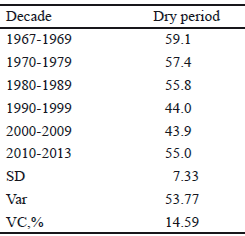
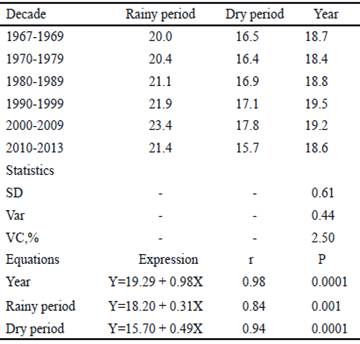
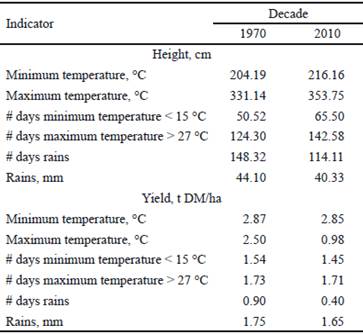
Table 8 shows height (cm) and yield (tMS/ha) of Cenchrus purpureus, calculated by regression equations with the individual climatic factors for the 1970s and 2000s. In general terms, it can be seen that, with the existence of changes in the climate indicators, there was a negative influence on the studied agronomic indicators, since the plants had higher height and lower yield in the 2000s.
Discussion
It is important to note two aspects that facilitate the understanding of the present information. First, although the period 1967-1969 was taken, this is only a comparative element of the beginning of the data recording, some of which had to be estimated because the series of months were not complete. Second, in the period 2010-2013 the information was complete, but as in the previous case, it was only three years and it is not enough time to establish the performance of some climate indicator. In both cases, an initial and final stage of three years can serve as a comparative element reference.
The national literature is not extensive in this field. However, the Cuban Institute of Meteorology issues periodic bulletins on climate indicators and pays particular attention to municipal and provincial registers. Also in the Atlas of Cuba (Anon 1985), there is information related to the country.
Taking into account that the period between 1970 and 2009 consists of 40 years of information on the studied climatic variables, this allows a rigorous evaluation of their evolution over time and may serve as a baseline for future research.
The reduction of rain through time was clearly appreciated in the performance of the equations, as well as in the values of intercepts with the Y axis and slopes, which determined that, in the studied stage, the value of rains decreased in 132.6 mm, but there is also a reduction of 12.6 days with rain.
Álvarez et al. (2012), when studying the distribution of rains by months in each decade of the 1970- 2009 stage, found that, between May and September, rainfall exceeded 150 mm / month and lower values in the rest of the months. On the other hand, the rainfall distribution curves per months of each decade were different, with a tendency to decrease as time passed. The same happened when the analysis per year or per seasonal period was performed. The number of days with rains showed a similar performance.
The results of the present research are related to the studies carried out by Gutiérrez (1993), Lapinel (1997) and López et al. (2015), who pointed out the variable distribution of rainfall and indicated that the decrease of the rainfall regime implies developing strategies for the efficient use of water, which is an aspect of vital importance in the agricultural sector.
The maximum temperature increased 1.2, 3 and 1.2 °C in the year, in dry and rainy period, respectively. This is clearly observed when comparing the value of the aforementioned temperature in the periods 1967-1979 and 2010-2013 (29.8 vs 28.5 °C). This indicates that the last stage reached 95 % of the initial temperature. All the above is reaffirmed in the performance of the number of days with maximum temperature higher than 27 °C, which registered increases of 21.5, 36.9 and 56.7 days in the dry, rainy and annual period, respectively. In addition, this value is 107 % when comparing 2010-2013 vs. 1967-1970. Besides, these values are located within the range of the temperature running, reported by Fonseca-Rivero et al. (2018) for Cuba.
The minimum temperature increased 0.8, 3.0 and 1.4 °C in the year, rainy and dry period, respectively. This corresponds to the increase of maximum temperature and also to the decrease in the number of days with a minimum temperature lower than 15 °C, which was 13.5 days in the studied period. In addition, the minimum temperature of the 2010-2013 stage represents 85 % of that reached in the period 1967-1970.
Mean temperature also increased with the passing of years in 1.4, 2.4 and 1.9 °C for the rainy, dry and year periods, respectively. In addition, the 1967-1970 and 2010-2013 values are similar (23.7 and 23.8 °C, respectively). On the other hand, Fonseca-Rivero et al. (2018) reported that mean temperature in Cuba in 1951 was of 25 °C, approximately, and in 2016 ascended, around, up to 26 °C. The values of the present research are slightly inferior and can be related to the geographical area where the weather station is located (Havana-Matanzas plain) characterized by lower minimum and mean temperatures that the rest of the country.
This study included some indicators that are not frequently used in Meteorology but that have special importance for the study of pastures. Thus, the rainfall expressed by the number of days with rain will offer the possible distribution of the degree of soil humidity and water availability for the pastures. The number of days with a maximum temperature higher than 27 °C will allow knowing the existence of optimum temperature for its growth and development, while the number of days with a minimum temperature lower than 15 °C will be able to know the unfavorable conditions for the production of forage biomass (Herrera 2008).
Several studies have evidenced the influence of some climate indicators on grasses. Thus, Álvarez et al. (2013) in clones of Cenchrus purpureus, Herrera et al. (2013) in six pasture species, Ramírez et al. (2013) in Brachiaria decumbens, Herrera and Ramos (2015) in two varieties of Cenchrus purpureus (Napier and King grass) and Ramírez et al. (2016) in Megathyrsus maximus found Pearson coefficients between yield and temperatures and rains, specific for each variety in each climate season. A similar response was found when these relations were established with quality indicators (protein, fiber and digestibility, and some others).
On the other hand, Ramírez et al. (2011a) in Megathyrsus maximus cv. Tanzania, Ramírez et al. (2011b) in Cenchrus purpureus cv. Cuba CT-169 and Álvarez et al. (2013) and Herrera et al. (2016) in clones of Cenchrus purpureus reported multiple regression equations between yield or quality and climate indicators. In all cases, the equations did not have high Pearson coefficients, were integrated by several climatic indicators and were specific for each pasture in each seasonal period.
Also leguminous and shrub studies, in less extension than in grasses, have been carried out to relate chemical composition or secondary metabolites with climate indicators. In this sense, Verdecia et al. (2014) carried them out with the bromatological composition of six forage legumes, Herrera et al. (2017a) related the secondary metabolites of Leucaena leucocephala and Herrera et al. (2017b) with the chemical composition of Tithonia diversifolia. Results were similar to those obtained with grasses, but with different values of Pearson coefficient.
It is good to point out that the results shown in table 8 were obtained within the following theoretical context: the published information was taken, as it was mentioned above, and the individual effect of each climate factor was considered by single regression equations with coefficients of correlation superior to 0.75. These data indicate a priori the physiological response of this plant to climate change, which is already present, because, when comparing information of the decades, it was possible to appreciate that in the 10 years of 2000, the value of maximum, minimum, mean temperature, number of days minimum temperature <15 °C, of days and number of days maximum temperature > 27 °C, as well as lower precipitations and number of days with rains compared with the 1970's. Nevertheless, these is preliminary data that has to be considered with caution, but indicate which can be the future and the response of the grasses to climate change.
The information presented here allows to have the performance of seven climate indicators (total rainfall, number of days with rain, maximum temperature, number of days with maximum temperature higher than 27 °C, minimum temperature, number of days with minimum temperature lower than 15 °C and mean temperature) over a period of 40 years, which could serve as a baseline for future studies. In addition, it was evidenced that in the studied stage the values of climatic factors were modified, some increased and others decreased, indicating that climate change is already established.
On the other hand, there is rigorous information that can be used in research related to the selection of future species and varieties of grasses tolerant to high temperatures and water deficits, as well as crops of economic importance for livestock and animal nutrition.
In the present research, the variability of climatic indicators was evidenced, so it is necessary to carry out future studies that offer continuity, over time, to the results obtained here and include other indicators such as duration, intensity and quality of the radiation, and relative humidity, among others. In addition, it is essential to establish mathematical expressions that are easy to use and understand, for each species or variety, that allow to establish pasture performance (yields and chemical composition) related to climate indicators and determine mathematical models to predict grass performance in future climate scenarios.

