


 Custom services
 text in
  English (pdf)
 Article in xml format
 Article references
 Send this article by e-mail
 Cited by SciELO
  Similars in
SciELO
Similars in
SciELO 
 Permalink
Introduction
One of the most used research methods is to measure the response variable in the same experimental unit at different moments in time. These are more efficient than using a different experimental unit for each measurement, since they require fewer units, which reduces sample size, minimizes costs, improves test power, and estimates over time is more accurate (Kuehl 2000).
In the agricultural branch, experiments with these characteristics are often carried out. In these studies, it is not appropriate to use the classical linear models of analysis of variance (ANAVA), because when performing repeated measurements over time in the same experimental units, these are correlated. Therefore, it is not met with the traditional assumptions of independence and normality that are required for its use (Jerez et al. 2011)
Given the specific characteristics of these experiments with repeated measures, it is necessary to determine which analytical strategy is the most appropriate. Some authors have recently used linear mixed models and generalized linear mixed models, implemented in some statistical programs because of the advantages they have over traditional ones (Balzarini and Machiavelli 2005 and Vallejo et al. 2010).
The objective of this study was the application of the linear mixed model and the generalized linear mixed model, as a tool for processing and analyzing an experiment, with repeated measures to compare different varieties of trees subjected to the endozoochory process.
Materials and Methods
Experimental procedure. The study was developed in the ranch "El Peregrino", belonging to the Campus of the Faculty of Veterinary Medicine of the University of Colima, Mexico. In all cases, basic seed was used, except in moringa, from which seeds of trees belonging to the agricultural campus of the university were collected. Eight treatments were tested, which were Leucaena endozoochory (Leucaena leucocephala), coral endozoochory (Caesealpinia platyloba), scarified leucaena and Coral with water at 80 ºC (Toral and González 1999), leucaena without scarification, coral without scarification, gliricidia without scarification, and moringa without scarification (Moringa oleifera).
Endozoochory process was developed with 12 Brahaman breed calves, with mean weights of 225 kg and 18 months of age, housed in independent pens, which received a silage base diet of CT-115, as well as 1 kg of supplement of waste banana.
Each animal was supplied with 1,000 seeds of each tree, mixed in the supplement. The total intake of seeds was determined by offer-rejection. Total collection of feces was carried out during 96 h at intervals of 24 h. Seeds collected from feces were dried at room temperature and placed in polyethylene bags. From the fifth day of collection, sowing was carried out under nursery conditions under a 50 % shade screen. The variables plant height and stem thickness (cm) were measured at 14, 21 and 28 d.
Statistical analysis. For the analyzed variables, Pearson correlation matrix was calculated, with the purpose of determining the existence of association between the sampling days. Sphericity criterion was used by Bartlett (1937) statistics and the measure of sample adequacy of Kaiser-Meyer-Olkin (KMO) (Pérez and Medrano 2010 and Acosta et al. 2015).
For both variables, the fulfillment of the assumption of normality was verified by the tests of Shapiro and Wilk (1965) and Kolmogorov -Smirnov modified by Lilliefors (1967). To determine the distribution that followed the data, Proc Severity was used and the following were analyzed with their corresponding functions Poisson (Logarithmic), Gamma (Reciprocal), Log Normal (Log), Normal (Identity) and Binomial (Logit). In both variables, the plant was used as the experimental unit. Treatments and sampling days were considered as fixed effects. The interaction of both effects and the error were the random effects, respectively. For the estimation of the model, the Laplace method was used, which is adequate for the analysis of designs with measures repeated over time.
The general expression of the model for both cases is:
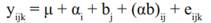
Where:
Yijk |
variable expected respo nse of the study |
µ |
mean common to all observations |
ai |
fixed effect of the i-th treatment (i=1, …, 8) |
bj |
random effect of the j-th time (j= 14,21 and 28) |
(ab)ij |
fixed effect of the i-th treatment in interaction with the random effect of the j-th time (ij=1, …, 24) |
eijk |
random error associated to all observations |
For the variable that did not fulfill the normality assumption, the generalized linear mixed model was used, which coincides with the model previously described, where Yijk= f(µ), response variable, according to the specific bond function μ= mean or intercept.
Several variance-covariance structures were examined. The Unstructured (UN), Toepliz (toep), Autoregressive of Order 1 (Ar (1)), Composite Symmetry (CS) and Components of Variance (CV) were used for obtaining the best fit. To make this selection, the Akaike (AIC), Akaike corrected (AICC) and Bayesian (BIC) information criteria were used, which would show the least value. Parameters were estimated by the methods of maximum likelihood (ML) or restricted maximum likelihood (REML) (Gualdrón 2009 and Vallejo et al. 2014).
For the comparison of means, Kramer (1956) test was used for P <0.05. Data processing was carried out with the SAS (2013)statistical package, version 9.3.
Results and Discussion
Tables 1 and 2 show correlation coefficients for the sampling days in the variables plant height and stem thickness. In both, values are higher than 0.70, which evidences high correlation for each variable among sampling days. Therefore, the assumption of independence of errors was not fulfilled.
Tables 3 and 4 show the results of Bartlett (1937) sphericity test and the KMO measure (Kaiser 1960, (1974) for both variables. Bartlett sphericity presented significant value (P <0.001), so the null hypothesis that the variance-covariance matrix is an identity matrix is rejected. The measure of sample adequacy of KMO was 0.76 and 0.74 respectively, both between the values established as acceptable by the literature (Salinas et al. 2014). This shows that the model used was adequate and the analysis could be continued.

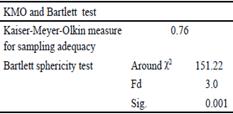
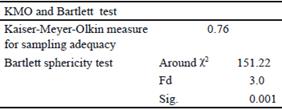
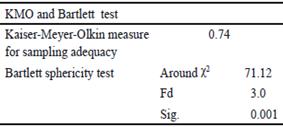
Table 5 shows the results of normality test, carried out using Shapiro Wilk and Kolmogorov Smirnov tests. The residuals of plant height variable were near a normal distribution, and a linear mixed model could be used. This was not the case for the variable stem thickness, so it was analyzed by means of a Generalized Linear Mixed Model, and adjusted to a Gamma distribution with Log link function.
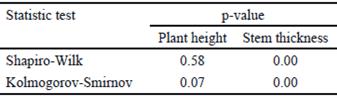
Table 6 shows covariance structures and information criteria studied. For the variables plant height and stem thickness, from all the analyzed structures, only CV and Ar (1) showed better performance. In both cases, the CV was selected, with a value of 445.8 and -490.7, respectively. Selection was based on the information criterion and on the covariance structure that showed the lowest value, since the model was better fitted.
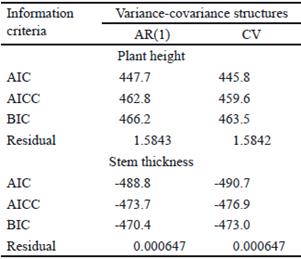
Table 7 shows the results of the analysis of variance according to the Linear Mixed Model, in which the interaction days x treatment significantly influenced (P <0.001) on the variable plant height. For moringa without scarification, there was greater plant height at 28 d, without deferring from the measurement at 14 and 21 d. The lowest was obtained with gliricidia without scarification, at 14 d, which did not differ from that obtained at 21 d, but at 28 d.
Table 7 Means of treatment per day interaction for plant height
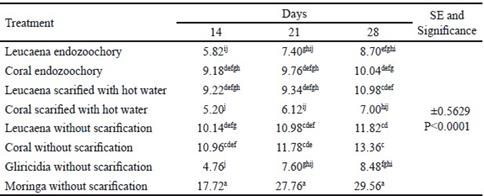
a,b,c,d,eDifferent letters indicate significant differences for P<0.05
Table 8 shows the results of the analysis of variance according to the Generalized Linear Mixed Model for the variable stem thickness, where the interaction days x treatments was significant (P = 0.0031).
In the evaluation of stem thickness, moringa without scarification showed the highest values at 14, 21 and 28 d of sampling, although they did not show differences among them. Coral without scarification maintained a similar performance, although sampling days did not differ among them. The lowest value was obtained with gliricidia in its two variants. In both, there were no differences among sampling days.
Table 8 Means of treatment per day interaction for stem thickness
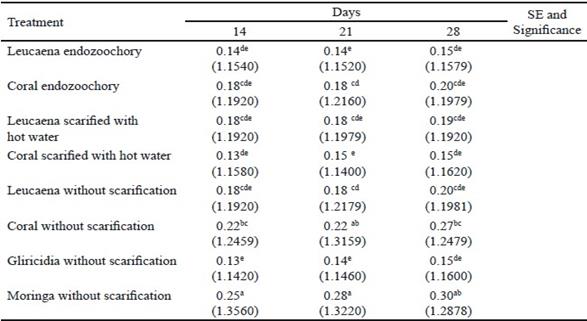
a,b,c,d,e Different letters indicate significant differences for P<0.05. ( ) Estimated means for link function
When applying this procedure, the adequate use of statistical alternatives before the non-fulfillment of the assumptions of the analysis of variance was confirmed, specifically in the treatment of experiments with repeated measures.
Conclusions
Linear Mixed Models and Generalized Linear Mixed Models constitute an alternative of analysis before the non-fulfillment of the assumptions of the analysis of variance and before disadvantages that classic models presented in designs with repeated measures.
AIC, AICC and BIC information criteria allow the selection of the optimal structure of covariance, which permits a better fit of the model.

