


 Servicios personalizados
 texto en
  Inglés (pdf)
 Articulo en XML
 Referencias del artículo
 Enviar articulo por email
 Citado por SciELO
  Similares en
SciELO
Similares en
SciELO 
 Permalink
Introduction
Bono and Arnau (1995), when reviewing the development of the concept of a test power, point out that in the theory developed by Neyman and Pearson, from 1928 to 1933, the power of a statistical test is the probability of significant results. Their estimation, according to these authors, is determined by three basic components: sample size, level of significance (α) and size of the effect to be detected.
There are two ways to estimate the power: the prefixed (a priori) and a posteriori. The first shows the researcher about the sample size needed for adequate power and, to this end, power tables have been constructed. The a posteriori power is important in the interpretation of the results of completed studies, as is the case of this study, whose purpose is to alert about the conduct to be followed in future researches.
Scheffé (1959) discusses the power of the F Fisher test in analysis of variance models (ANAVA), with fixed effects. It refers to the power tables, calculated for the values of α = 0.01 and 0.05, and reproduces power graphs for the F Fisher test.
Siegel and Castellan (1995), in the area of non-parametric statistics, introduce the concept of power - efficiency or Asymptotic Relative Efficiency (ARE) or efficiency of Pitman. Several authors (De Calzadilla 1999, Guerra et al. 2000, Christ 2001, De Calzadilla et al. 2002, Vásquez 2011 and Cabrera et al. 2012) performed empirical evaluations to assess the appropriateness of the application of analysis of variance models, parametric and non-parametric, with univariate and bivariate approaches.
Menchaca (1974, 1975), Venereo (1976), Caballero (1979) and Menchaca and Torres (1985) contributed tables of sample sizes and number of replications in analysis of variance models, associated with designs completely randomized, random blocks , Latin square and tunover design. They include the maximum standardized difference between two means (Δ), the number of treatments (t), the level of significance (α) and the power of the test (1-β). These tables represent valuable work tools for researchers from different branches. Currently, with the advance of computer science, there are statistical packages that include the calculation of power, such as InfoStat, G Power and SPSS, among others.
With the established background, it was decided to use another way of analyzing and interpreting the statistical power through an integral analysis of variables (numerical and categorical) that may affect it, associated with statistical indicators and experimental design. For this, it was considered convenient to apply a categorical regression analysis (CATREG).
It is proposed to establish criteria of theoretical - practical value, from an integral analysis of variables associated with statistical power, in analysis of variance models of fixed effects (parametric and non - parametric).
Materials and Methods
The information analyzed was selected from the databases with numerical variables (counts and proportions), processed by the Biomathematics department from the Instituto de Ciencia Animal, from 2003 - 2011, located in San José de las Lajas, Mayabeque province. The processed data correspond to independent researches, developed in areas of birds, pigs, grasses and ruminants, associated to the completely randomized (CRD) balanced and random blocks (RBD) designs.
The experimental results were analyzed according to the corresponding models of parametric variance analysis (single and double) and the non-parametric equivalent tests Kruskal-Wallis and Friedman, respectively. In each case, the probability of type I error of the parametric and non- parametric tests, distribution of the response variable (in general was Normal, Binomial and Poisson), power of the F Fisher test, sample size in the experimental design and fulfilment of the basic assumptions of the ANAVA. The rest of the variables correspond to the experimental design.
The number of experiments and variables by experimental design are:
A data matrix was formed with the following variables:
Type of experiment
Type of experimental design
Number of treatments
Fulfilment of the theoretical assumptions
Probability of type I error of the F Fisher test
Probability of type I error of the non-parametric equivalent tests
Power of F Fisher test
Sample size in the experimental design
Variable distribution
To establish the relation of the power of the Fisher test with the rest of the variables, the categorical regression analysis was applied, due to the presence of numerical variables (3 and 5 to 8) and categorical variables (1, 2, 4 and 9).
In accordance with the criteria of Meulman and Heiser (2010) and the applications made by Navarro et al. (2010), Vázquez (2012) and Guerra et al. (2014), in the Agricultural Sciences and others, the general characteristics of the CATREG are summarized in the following aspects:
They are based on the Optimal Scaling Methodology, proposed by the Dutch school of data scalation, with numerous contributions from the Data Scaling System Theory Group at the University of Leiden, in Holland, implemented with the credits of this group by IBM SPSS Statistics, in different versions.
It is suitable for data that are difficult or impossible to analyze using the classical statistics methods.
The optimal quantifications of each variable are obtained by the alternating least squares method (minimizes the loss of information function).
The quantifications of each variable are improved by iterative procedures.
The quantified variables have metric properties.
It extends the classical method of regression analysis, through the optimal scaling of nominal, ordinal and numerical variables, simultaneously.
A linear regression equation optimal for the transformed variables is obtained.
The estimated regression coefficients reflect the changes produced by the predictor variables in the response variable.
The optimal quantifications reflect the characteristics of the original variables.
The indicators of the categorical variables must be positive integers.
Only allows one response variable and a maximum of 200 predictor variables.
The CATREG analysis includes characteristic aspects of classical regression analysis: coefficient of determination (R2), analysis of variance in the regression and significance of the model parameters. As complementary elements of this analysis, other indicators are included for the analysis:
Importance: measure of the relative importance of the predictor variables, given by Pratt (1987).
Tolerance: represents the proportion of the variation of each predictor variable, which is not explained by the others. It represents a protection against multicollinearity (Hair et al. 1999).
For the processing of the information, the optimal scaling option (CATREG) of the statistical software SPSS version 22.0 (2013) was selected from the regression analysis.
Results and Discussion
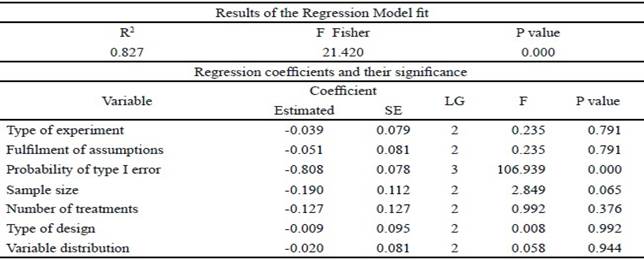
In the application of the categorical regression analysis, the power was considered as a dependent variable, to analyze its relation with the rest of variables. Table 1 reflects the high value of the coefficient of determination (R2), accompanied by the significance of the model, which indicates that the power has a good explanation by the analyzed variables.
Table 1 includes the partial regression coefficients, standardized with their statistical significance, when considering the results of the parametric ANAVA, except for the probability of type I error (p-value). The rest of the indicators do not show significant statistical contributions for the explanation of the power (value p> 0.05). It is considered that it is necessary to take into account in future researches, the sample size, because of its known incidence in the potency and the significance shown (value p = 0.065).
Table 1 Fit of the CATREG model and significance of the regression coefficients with the parametric ANAVA
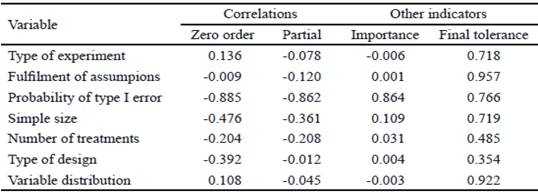
The significant and negative incidence of the probability of type I error in the power, when the rest of the variables remain constant, is corroborated by the high negative correlations of zero and partial order, which are observed in table 2, between the probability of type I error and power.
It is considered that there is correspondence of the previous results with that reported in the specialized literature, specifically by Mood and Graybill (1972) and Rodríguez (2008), who denote the power function as:

From this analysis it is concluded that a powerful test must show a low probability of type I error (reject the null hypothesis being true) and high power (reject the null hypothesis being false), situation that must be in correspondence with the characteristics of the test, in this case F Fisher test.
These high negative correlations are corroborated with the results of a simulation study conducted by Vázquez (2011), which includes the analysis of the power and the probability of type I error, under the assumption of binomial distribution. In addition to the study of Herrera (2014), in animal science researches.
Table 2 highlights, for its importance, the probability of type I error, which is able to explain 76.6 % of its variability (given by tolerance), being low in the case of the number of treatments and type of design, and very high for the fulfilment of the assumptions and the distribution of the variable.
The distribution of the analyzed variables that, to a large extent, correspond to the normal, binomial and Poisson distribution, although it does not present an appreciable incidence in the power, should be a reason for analysis in future researches, as well as the sample size.
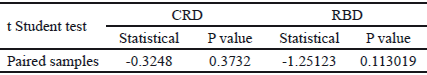
Due to the high level of coincidences presented by the decision making based on the probability of type I error , F Fisher test of the ANAVA, with its non-parametric equivalents (Kruskal-Wallis and Friedman tests), a comparative analysis of the probabilities of type I error, using the t Student test for paired samples (table 3).
As can be seen in the table, there are no significant statistical differences (P <0.05) between the probabilities of type I error in each design.
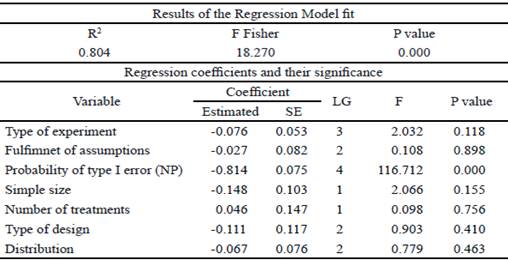
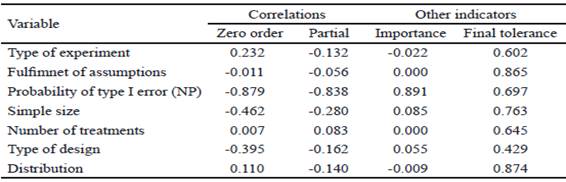
In this result it is decided to evaluate the performance of the CATREG model, when substituting the values of the probability of type I error of the F Fisher test, for those corresponding to the Kruskal-Wallis and Friedman tests (according to the design). This variable is identified in this analysis by probability of type I error (NP). The obtained results are reflected in tables 4 and 5. It is observed that a very significant and negative incidence of the probability of type I error (NP) in the power is maintained, when considering the rest of the variables or constant indicators, very similar to that reported in table 1.
The results of table 4 are corroborated with the zero and partial order correlation indicators, which appear in table 5. Regarding the importance and tolerance (table 5), it is reiterated that the probability of type I error (NP), is highlighted by its importance with respect to the rest of the indicators, lower to explain its variability (69.7 %). In the same way, the high tolerance of variables is considered, fulfilment with assumptions and distribution of the variable.
From the analyzes carried out, it can be seen that the indicator with a strong negative relation with the power is the probability of type I error in the ANAVA models (parametric and non-parametric). That is, at low values of the probability of type I error, high values of power.
Table 4 Fit of the CATREG model and significance of the regression coefficients with the non-parametric ANAVA.
It is concluded that the use of the categorical regression model is an alternative analysis tool to assess the incidence of each of the selected variables of statistical indicators and experimental design, in the statistical power and in analysis of variance models of fixed effects through Fisher test with its non- parametric equivalents (Kruskal-Wallis and Friedman tests).The probability of type I error is identified as the most important indicator that contributes to explain the power, and the strong negative relation between the power and the probability of type I error is shown in the analysis of variance models( parametric and non- parametric).
It is recommended to deepen in the aspects of sample size, distribution of the analyzed variable and the power-efficiency criterion, in relation to the probability of type I error and power, as well as to incorporate the results of the generalized linear model into the analysis as another alternative to be evaluated.

