


 Custom services
 text in
  English (pdf)
 Article in xml format
 Article references
 Send this article by e-mail
 Cited by SciELO
  Similars in
SciELO
Similars in
SciELO 
 Permalink
INTRODUCTION
Napier grass (Cenchrus purpureus (Schumach)), also known as elephant grass, is a perennial autotetraploid (2n = 4x = 28 AABB) grass, native to Africa. This species is an important forage crop for tropical and subtropical regions, due to its high biomass production, resistance to diseases, forage quality and easy propagation (Anderson et al. 2016). Due to its high growth rate and a series of characteristics in biomass degradation, Napier grass has potential in the production of bioenergy and in the conversion of alcohol or methane (Rueda et al. 2016). It has also been used for soil and water conservation in areas with slopes, reflecting tolerance to drought, high photosynthetic rate and high efficiency in water use (Galindo et al. 2017).
In Cuba, King grass variety was generalized, which, due to its high yield and ecological plasticity, has occupied 85% of the forage areas (Herrera 2009). That is why in the mid-1980s the improvement program was started by using in vitro tissue culture and mutagenesis by irradiation with 60Co (Herrera et al. 1994).
Napier grass represents the secondary genetic pool of the pearl millet (Cenchrus americanus), since it contains a genome completely homologous with that of this species, while its second genome is of unknown origin (dos Reis et al. 2014). Hence, another route used for genetic improvement was the crossing of Cenchrus purpureus CT-169 with pearl millet (Cenchrus americanus). In this way, the OM-22 was obtained, which, due to the size of its leaves and high regrowth capacity, is used for forage production (Martínez and González 2018).
Since the beginning of molecular DNA technologies, several molecular markers have been used for the study of genetic diversity, parental selection, genome mapping, comparative genomics and population structure, among other fields (Kage et al. 2016).
Knowledge of genetic diversity is useful for prospecting and conserving germplasm and provides the basis for the selection of parents in new improvement programs. The distribution and extent of genetic diversity depends on evolution, breeding systems, environmental factors and other factors usually associated with human action. For this reason, a better understanding of the distribution and extent of genetic variability is important for the conservation and utilization of genetic resources (Govindaraj et al. 2015).
The main criterion used for the distinction of the clones are the morphological and agronomic traits (Ray et al. 2017). Morphological characterization is a powerful tool for distinguishing different clones and contributes to introducing desired traits from one donor plant to another recipient. However, these traits are influenced by environmental conditions, so they cannot provide accurate information on the genetic relationships between clones (Nadeem et al. 2018). In some cases, enzymatic markers were used to confirm the identity of the most important clones. Nevertheless, these markers have the disadvantage that they present low levels of polymorphisms and are influenced by the phenological state of the plant (Cruz et al. 1993).
The objective of this research was to validate the use of SSR (Simple Sequence Repeat) markers to study the genetic variability between clones and varieties of Cenchrus purpureus obtained in breeding programs developed in the Instituto de Ciencia Animal.
MATERIALS AND METHODS
Studied materials. Young and healthy leaves from 15 clones and varieties of Cenchrus purpureus (table 1), conserved in the germplasm bank of the Instituto de Ciencia Animal, located in the Miguel Sistachs Naya Experimental Center of Pastures and Forages, were collected in typical red ferralitic soil (Hernández et al. 2015). Varieties are conserved in the germplasm bank in plots of 25m2.
Table 1 Varieties and clons of Cenchrus purpureus
| King grass | Variety |
|---|---|
| CT-115 | Variety |
| OM-22 | Variety |
| Mott | Variety |
| N-9 | Clone |
| N-28 | Clone |
| N-11 | Clone |
| N-26 | Clone |
| U-4 | Clone |
| U-5 | Clone |
| CT-806 | Clone |
| CT-606 | Clone |
| CT-452 | Clone |
| CT-442 | Clone |
| H-31 | Clone |
The King grass variety was introduced in Cuba in the mid 70's (Gerardo et al. 1982). Mott variety was selected in 1977 by Professor Gerard Mott, from a progeny of the self-fertilized Merkeron cultivar in Georgia (Sollenberger et al. 1989). Clones N-9, N-28, N-11, N-26, U-4 and U-5 were obtained in breeding programs through the induction of mutations with physical and chemical agents (Herrera et al. 1994). Clones CT-806, CT-606, CT-452, CT-442 and H-31 were obtained in programs to develop varieties with resistance to drought and salinity, through the in vitro culture of CT-115 meristems (Herrera et al. 2003). The materials are conserved in plots of 25m2, each consisting of 5 rows. Sampling was performed in March 2015.
DNA extraction. Leaves from 3 plants were extracted from each plot with the same regrowth age and samples composed of each material were formed. From each variety, the fourth leaf from the apex was taken and preserved in paper envelopes to be transferred to the Center for Genetic Engineering and Biotechnology (CIGB, initials in Spanish), where the DNA was purified. Small discs of each variety were cut and 300 mg of leaves were macerated in liquid nitrogen in 1.5 mL tubes. Genomic DNA was extracted using the CTAB (Cetyl Trimethyl Ammonium Bromide) method (Doyle et al. 1990). Purity and concentration of the isolated DNA was determined using a NanoDrop Lite spectrophotometer, and by electrophoresis in 0.8 % agarose, dyed with ethidium bromide (5 μg / mL).
DNA amplification with microsatellite markers. Eleven pairs of microsatellite primers were evaluated in the 15 clones and varieties of C. purpureus (table 2). Markers were originally identified in pearl millet from genomic DNA analysis (Allouis et al. 2001 ande Budak et al. 2003) and from expressed sequences (Mariac et al. 2006). Polymerase chain reaction was carried out in a final volume of 20 µl with the following formulation: GoTaq 1X buffer reaction, 0.5 uM primer pairs, 1.5 mM MgCl2, 0.2 mM dNTP, 1 unit of Go Taq Flexi DNA Polymerase (Promega) and 45 ng of genomic DNA. Polymerase chain reaction was performed in a MiniCycler thermocycler with the following cycle: initial denaturation 94 °C (5min) followed by 35 cycles of 94 °C (45 s), followed by specific alignment temperature for each oligo (45 s), then 72 °C (1 min) and at the end an extension cycle of 72 °C for 30 minutes.
Table 2 Primer sequence, alignment temperature and expected size of fragments amplified by markers
| I Identifier | Primer 5¨ | Primer 3¨ | AT 0C | Size |
|---|---|---|---|---|
| CTM-81 | GCTGCATCGGAGATAGGGAA | CTCAGCAAGCACGCTGCTCT | 52 | 210 pb |
| CTM-101 | GAGGCAAAAGTGGAAGACAG | TTGATTCCCGGTTCTATCGA | 52 | 235 pb |
| CTM-591 | TCCTCGACATCCTCCA | GACACCTCGTAGCACTCC | 54 | 183 pb |
| PGIRD122 | GTTGCAAGCAGGAGTAGATCGA | CGCTCTGTAGGTTGAACTCCTT | 52 | 128 pb |
| PGIRD132 | CAGCAGCGAGAAGTTTAGCA | GCGTAGACGGCGTAGATGAT | 60 | 250 pb |
| PGIRD212 | GCTATTGCCACTGCTTCACA | CCACCATGCAACAGCAATAA | 54 | 210 pb |
| PGIRD252 | CGGAGCTCCTATCATTCCAA | GCAAGCCACAAGCCTATCTC | 58 | 165 pb |
| PGIRD562 | ATCACTCCTCGATCGGTCAC | ACCAGACACACGTGCCAGT | 58 | 145 pb |
| PSMP22353 | GCTTTTCTGCTTCTCCGTAGAC | CCCAACAATAGCCACCAATAAAGA | 54 | 192 pb |
| PSMP22553 | CATCTAAACACAACCAATCTTGAAC | TGGCACTCTTAAATTGACGCAT | 54 | 264 pb |
| PSMP22673 | GGAAGGCGTAGGGATCAATCTCAC | ATCCACCCGACGAAGGAAACGA | 60 | 241 pb |
1Budak et al. (2003), 2Allouis et al. (2001) and 3Mariac et al. (2006).
Visualization of the amplified fragments. Amplification products were separated by electrophoresis in 6% acrylamide and 7M urea in a 40cm x 36cm IBI device. Samples were previously denatured at 900C for 2 minutes. Gels were made up of 6% acrylamide (19 acrylamide: 1 bis acrylamide), 0.5X TBE (89mM tris boric acid 89mM EDTA 2mM pH 8) and 7M urea. Electrophoresis conditions were 60W for 2 hours. Gels were dyed in silver nitrate solution and the size of fragments was estimated with 100 pb Promega marker.
Information analysis. The sharpest bands were considered as alleles and values of 1 were assigned if they were present and 0 if they were absent. The database was developed in Excel and imported into the DARwin6 program (Perrier et al. 2003) as a simple database. The distance matrix of Dice coefficients between pairs of clones and varieties was calculated (Nei and Li 1979). From the distance matrix, the dendrogram was created using the unweighted pair group method with arithmetic mean (UPGMA) method (Sneath and Sokal 1973). The cophenetic correlation analysis was performed to determine how well the UPGMA method represents the Dice coefficient matrix. The principal component analysis (PCA) was performed in the distance matrix. To identify the most informative pair of primers, the diversity index was calculated according to Milbourne et al. (1997). Band pattern that amplified each marker in each clone was considered as a simple genotype and the frequency of appearance of that band pattern was used to calculate the diversity index. The diversity index (DI) was calculated as DI = 1-Σfg2, where fg is the frequency of each genotype in the 15 varieties and clones. A monomorphic marker will have DI equal to 0 while a polymorphic marker will have DI equal to 1.
RESULTS
The 11 microsatellite markers amplified a total of 68 fragments in the evaluated 15 varieties and clones of C. purpureus. Out of these fragments, 57 were polymorphic (table 3). CTM8 and PSMP2267 markers amplified the largest number of polymorphic fragments while CTM-10 amplified only one. PGIRD12 marker did not amplify polymorphic bands, so it presented DI = 0. For the remaining markers, the DI diversity index ranged between 0.32 and 0.88 with a mean of 0.59.
Table 3 Diversity index, amount of fragments and polymorphic frgments that amplified the 11 microsatellite markers in the varieties and clones of Cenchrus purpureus
| Marker | No. allels | No. polymorphic allels | DI |
|---|---|---|---|
| CTM8 | 12 | 12 | 0.88 |
| CTM10 | 3 | 1 | 0.32 |
| CTM59 | 4 | 3 | 0.79 |
| PSMP2235 | 2 | 2 | 0.39 |
| PSMP2255 | 6 | 6 | 0.71 |
| PSMP2267 | 16 | 16 | 0.74 |
| PGIRD12 | 4 | 0 | 0 |
| PGIRD13 | 7 | 7 | 0.58 |
| PGIRD21 | 4 | 2 | 0.44 |
| PGIRD25 | 5 | 3 | 0.32 |
| PGIRD56 | 5 | 5 | 0.74 |
Table 4 shows the number of bands that amplified the 10 SSR polymorphic primers in 15 clones and varieties of Cenchrus purpureus. The amount of bands per marker per genotype ranged between 9 and 1 with a mean of 3.13. The marker that amplified the highest number of bands per genotype was PSMP2267 with mean 6. Seven unique bands were detected. Three of these bands amplified with CTM59 marker in genotypes CT-442, OM-22 and N-28, three others with the marker PGIRD56 in the genotypes CT-442, Mott and King grass and one with the marker PSMP2255 in the clone H-31.
Table 4 Amount of bands amplified per each marker in each genotype of Cenchrus purpureus
| CTM8 | CTM10 | CTM59 | PSMP2235 | PSMP2255 | PSMP2267 | PGIRD13 | PGIRD21 | PGIRD25 | PGIRD56 | |
|---|---|---|---|---|---|---|---|---|---|---|
| N-9 | 4 | 2 | 2 | 2 | 2 | 5 | 2 | 3 | 3 | 2 |
| H-31 | 3 | 3 | 3 | 2 | 1 | 4 | 4 | 4 | 4 | 3 |
| CT-452 | 3 | 2 | 4 | 2 | 2 | 9 | 5 | 3 | 3 | 2 |
| N-26 | 4 | 2 | 2 | 2 | 6 | 4 | 3 | 4 | 3 | 2 |
| CT-442 | 3 | 2 | 1 | 2 | 2 | 9 | 3 | 3 | 3 | 1 |
| OM-22 | 3 | 2 | 1 | 2 | 3 | 7 | 5 | 4 | 3 | 3 |
| U-4 | 4 | 2 | 3 | 2 | 6 | 5 | 3 | 2 | 3 | 3 |
| CT-115 | 3 | 2 | 2 | 2 | 3 | 6 | 3 | 3 | 3 | 2 |
| N-11 | 3 | 2 | 4 | 2 | 2 | 7 | 3 | 3 | 3 | 3 |
| Mott | 3 | 2 | 2 | 2 | 6 | 6 | 3 | 2 | 3 | 1 |
| N-28 | 4 | 2 | 1 | 2 | 6 | 6 | 3 | 3 | 3 | 2 |
| CT-806 | 3 | 3 | 2 | 2 | 4 | 7 | 4 | 4 | 4 | 3 |
| U-5 | 3 | 2 | 2 | 2 | 6 | 6 | 3 | 3 | 3 | 2 |
| CT-606 | 4 | 3 | 3 | 2 | 4 | 7 | 3 | 4 | 4 | 3 |
| King grass | 2 | 2 | 2 | 2 | 2 | 2 | 2 | 3 | 3 | 1 |
| Mean | 3.3 | 2.2 | 2.3 | 2 | 3.7 | 6 | 3.3 | 3.2 | 3.2 | 2.2 |
The genetic distance matrix was calculated with data of the 64 fragments amplified in the 15 varieties and clones by the 10 polymorphic markers. The genetic distance ranged between 0.04 (CT-606: CT-806) and 0.63 (Mott: H-31), with mean of 0.37 (table 5). Distance coefficients of H-31 were also high with clones U-4, N-28, U-5 and King grass variety. CT-115 variety maintained the highest distance coefficients with the clones H-31, CT-606, CT-806 and OM-22 variety. King grass variety presented high distance coefficients with the clones H-31, CT-806 and CT-606.
Table 5 Genetic distance matrix of 15 varieties and clones of Cenchrus purpureus with data of 10 SSR
| N-9 | H-31 | CT-452 | N-26 | CT-442 | OM-22 | U-4 | CT-115 | N-11 | Mott | N-28 | CT-806 | U-5 | CT-606 | |
|---|---|---|---|---|---|---|---|---|---|---|---|---|---|---|
| H-31 | 0.50 | |||||||||||||
| CT-452 | 0.20 | 0.53 | ||||||||||||
| N-26 | 0.42 | 0.56 | 0.43 | |||||||||||
| CT-442 | 0.22 | 0.52 | 0.13 | 0.40 | ||||||||||
| OM-22 | 0.45 | 0.49 | 0.46 | 0.34 | 0.47 | |||||||||
| U-4 | 0.31 | 0.61 | 0.30 | 0.25 | 0.33 | 0.44 | ||||||||
| CT-115 | 0.15 | 0.55 | 0.13 | 0.40 | 0.14 | 0.47 | 0.33 | |||||||
| N-11 | 0.16 | 0.48 | 0.17 | 0.40 | 0.22 | 0.47 | 0.30 | 0.15 | ||||||
| Mott | 0.35 | 0.63 | 0.30 | 0.28 | 0.30 | 0.38 | 0.15 | 0.30 | 0.30 | |||||
| N-28 | 0.23 | 0.61 | 0.23 | 0.27 | 0.22 | 0.33 | 0.14 | 0.22 | 0.29 | 0.13 | ||||
| CT-806 | 0.48 | 0.26 | 0.54 | 0.44 | 0.49 | 0.25 | 0.49 | 0.52 | 0.52 | 0.50 | 0.42 | |||
| U-5 | 0.37 | 0.61 | 0.26 | 0.17 | 0.29 | 0.47 | 0.17 | 0.29 | 0.35 | 0.23 | 0.16 | 0.52 | ||
| CT-606 | 0.52 | 0.27 | 0.54 | 0.45 | 0.53 | 0.29 | 0.53 | 0.56 | 0.52 | 0.54 | 0.46 | 0.04 | 0.52 | |
| King grass | 0.39 | 0.60 | 0.41 | 0.31 | 0.46 | 0.43 | 0.38 | 0.38 | 0.37 | 0.39 | 0.37 | 0.56 | 0.33 | 0.57 |
Using Dice distance coefficients and UPGMA grouping method, the dendrogram of 15 clones and varieties was created (figure 1). Cophenetic correlation was r=0.98 (p<0.0001), which indicated that grouping method properly represented the genetic distance matrix.
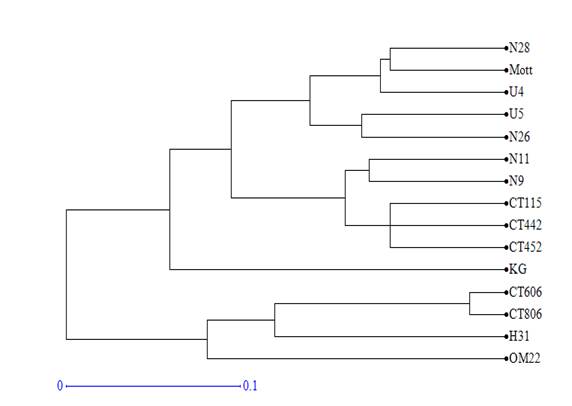
Figure 1 Dendrogram obtained by the UPGMA analysis of the distance matrix calculated with the 64 fragments amplified by the 10 SSR markers in 15 varieties and clones of Cenchrus purpureus.
The varieties and clones formed 5 groups for the 0.1 cut value. King grass and OM-22 varieties were not grouped with any of the genotypes. The first group consisted of clones CT-806, H-31 and CT-606. The second group consisted of clones CT-442, CT-452, N-11, N-9 and the variety CT-115. Clones U-5, U-4, N-26, N-28 and the Mott variety were included in the third group.
The ACP was performed in the genetic distance matrix to confirm the groups observed in the dendrogram (figure 2). The first axis represented 47.19% of the variation and the second 21.89%.
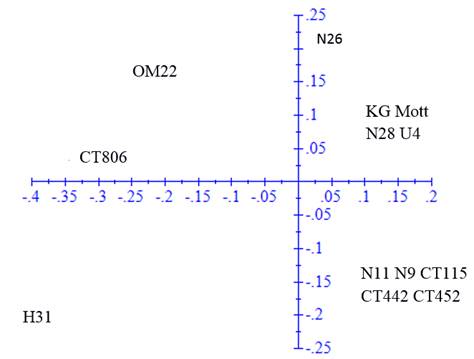
Figure 2 Principal component analysis in the genetic distance matrix calculated with 64 fragments amplified by 10 SSR markers in 15 clones and varieties of Cenchrus purpureus
In the ACP, the same groups were verified but with some modifications. Clones H-31 and N-26 tended to disperse from the rest of clones with which they were grouped in the dendrogram, while King grass was included in the second group of the dendrogram. OM-22 variety remained distant from the rest of the clones and varieties.
DISCUSSION
In other collections, several systems of DNA markers have been used to study the variation and genetic relationship between accessions of Napier grass at molecular level. Simple sequence repeat (SSR), also known as microsatellites, are sequences with repetitions of 2-5 base pairs, which have become the main type of marker, due to their co-dominance, abundance in the genome, high reproducibility and high transfer rates between species (Singh and Singh 2015).
SSR marker primers from C. americanus amplified in the genomic DNA samples of the 15 clones and varieties of C. purpureus. Although 84% of the amplified fragments were polymorphic, this proportion was low compared to 98% reported by Sousa Azevedo et al. (2012) and 93% reported by Kandel et al. (2016). Differences could be associated to the fact that these authors evaluated a greater number of individuals, among which accessions from the center of origin of this species were included, which increases the genetic variability.
It must be taken into account that most of the evaluated accessions come from breeding programs that had as parent either the King grass or CT-115. The selection cycles that led to these varieties could affect genetic variability. In this sense, other research has verified that clones from improvement programs conserved by the ILRI (International Livestock Research Institute), have lower polymorphism (81%) than traditional accessions used by farmers (Kawube et al. 2015). However, this first result suggests that markers used are a powerful tool for the genetic characterization of the remaining 56 accessions conserved in the ICA germplasm bank.
The number of amplified fragments per marker in each genotype ranged between 1 and 9. The amplification of each marker should generate 1 to 4 bands of variable intensity depending on the dose of each allele, since the species is tetraploid. However, in this study, some markers amplified a greater number of bands. This result was also reported by López et al. (2014) in a collection of 20 wild accessions that although they grow as weeds, present potential to produce energy.
Methodologies of molecular markers are complicated by polyploidy, since multiple loci can be generated when trying to evaluate a single locus (Mason 2015). Autopolyploidy that are formed from phylogenetically related species tend to show greater duplication of genomic regions (Wendel et al. 2018). Small-scale duplications may also occur as a result of translocation mechanisms of non-homologous segments or activation of retrotransposons (Vicient and Casacuberta 2017).
Amplification of duplicated loci may also contribute to the increase in the number of bands as it was detected in the markers PSMP2267, CTM8, PSMP2255 and PGIRD13. This performance has been also reported by López et al. (2014).
The bands amplified by the markers provide genetic information that allows distinguishing clones and varieties. However, the markers of CTM and PGIRD series amplified a smaller number of bands than those reported by López et al. (2014), which ranged between 3 (CTM10) and 28 (PGIRD13). It should be taken into account that, in this study, 6 varieties selected to produce energy were evaluated, plus 10 wild accessions collected in natural areas and fields along the strait of Florida. For this reason, diversity index could be higher, ranging between 0.68 (PGIRD21) and 0.94 (CTM59). In another study, these 10 markers amplified between 4 and 22 bands, with the CTM8 and PSMP2267 markers having the highest number of alleles with 18 and 22 respectively (Sousa et al. 2012). It should be regarded that these authors evaluated 107 accessions from the germplasm bank of EMBRAPA, so it is expected that there is greater genetic variability, due to heterogeneity of the origin of parents.
However, the number of alleles detected with the markers CTM8, CTM59, PSMP2267 and PGIRD25 was similar to that reported by Negawo et al. (2018) with 13, 3, 15 and 5 alleles respectively, in a collection of 170 clones conserved in the ILRI germplasm bank. Meanwhile, the number of alleles detected with the markers CTM10, PSMP2235, PSMP2255, PGIRD13, PGIRD21 and PGIRD56 was lower than that reported by these authors with 7, 8, 23, 11, 6 and 8 bands, respectively. The results suggest that it would be beneficial to use only the CTM8 and PSMP2267 markers to evaluate a greater number of clones conserved in the ICA germplasm bank. However, markers PSMP2255 and PGIRD13 should not be discarded.
Coefficients of genetic distance were similar to those reported by López et al. (2014) that ranged between 0.05 and 0.47 with mean of 0.32 and those reported by Sousa et al. (2012) that oscillated between 0 and 0.75 with mean of 0.35. The dendrogram based on UPGMA analysis grouped clones and varieties into 5 groups. In the first group, similarity coefficients ranged between 0.96 and 0.83 with mean of 0.81. In the second group, they ranged between 0.87 and 0.88 with a mean of 0.84, while in the third group, they varied between 0.87 and 0.72 with a mean of 0.81. King grass variety maintained coefficients of similarity with the CT-115 (0.62) lower than that reported by Sousa et al. (2012), which was more than 0.85. On the other hand, Mott variety maintained coefficients of similarity with CT-115 (0.70) and King grass (0.61), similar to that reported by these authors.
In general, genetic improvement programs prefer to use, as progenitors, plants with traits of economic value that are genetically unrelated at the same time. For example, Kandel et al. (2016) proposed the use of accessions with genetic distance coefficients between 0.50 and 0.47 as progenitors. On the other hand, Sousa et al. (2012) proposed accessions with genetic distance of 0.85. The difference in the values proposed by both authors is related to the extension of the genetic variability of the accessions. This depends on the geographical origin of the accessions (Harris et al. 2010). For example, ILRI collections have been shown to have greater allelic richness than those of EMBRAPA, since they come from varied regions where the center of origin of this species is thought to be (Negawo et al. 2018). In the present study, the highest distance coefficients were presented by clone H-31 with clones U-4 (0.61), N-28 (0.61), U-5 (0.61) and King grass (0.60) and Mott (0.63) varieties. The genetic distance between King grass and CT-606 (0.57) was also high. However, it is necessary to study the agronomic performance of these individuals before proposing them as progenitors in future breeding programs.
On the other hand, the lowest value of genetic distance (0.04) was observed in clones CT-606 and CT-806. This value is not low enough to consider that these clones are identical because other authors consider that accessions are still different when they have values of 0.02 (Kandel et al. 2016).
The analysis of principal components allowed a better visualization of the variability of clones and provided information on the distances among accessions. The variation proportion explained with the two axes was higher than that reported by Sousa et al. (2012), with three axes of 36% and the one reported by Negawo et al. (2018) of 23% with two axes. Differences are associated with the fact that more than 100 accessions were evaluated in these two studies. Most of the clones maintained similar relationships to those described with the UPGMA analysis, and only clones N-26 and H-31 tended to disperse from the groups described above. King grass variety was also closer to the third group.

