


 Servicios personalizados
 texto en
  Inglés (pdf)
 Articulo en XML
 Referencias del artículo
 Enviar articulo por email
 Citado por SciELO
  Similares en
SciELO
Similares en
SciELO 
 Permalink
INTRODUCTION
Species adapted to arid and semi-arid environments, such as forage cacti (Nopalea spp. and Opuntia spp.), can contribute to biomass yield increases in agricultural areas, so improving the efficiency of local natural resource use (Diniz et al. 2017).
Cacti offer an alternative forage in semi-arid regions, due to their great capacity for phytomass production, high energy value, richness of non-fibrous carbohydrate content, large water reserves and ease of propagation (Freire et al. 2018 and Pereira et al. 2018). The cactus forage presents CAM (Crassulasean Acid Metabolism) photosynthetic metabolism, with day closure of stomata and nocturnal carbon assimilation, thus providing a greater adaptive capacity to the abiotic factors (Santos et al. 2016 and Souza Filho et al. 2016). For most plants, one of the key factors of biomass production is leaf area, as this determines the capacity for absorption and use of solar radiation in the photosynthetic process. In the forage cactus this function is taken instead by cladodes (Lucena et al. 2018).
The variety of anatomical and morpho-physiological adaptations possessed by forage cacti contribute to the high agro-ecological success of this crop, as their high efficient use of water makes them well-suited to environmental conditions with high rates of atmospheric evaporation and reduced soil water content (Hartzell et al. 2018).
In recent years the quantitative study of the biology of anatomical form has also moved into morphometrics via the study of shape variation and its covariation with other variables (Adams et al. 2004). One common approach to shape analysis, geometric morphometrics, quantifies shape using landmark coordinates to record the relative positions of morphological points, boundary curves and surfaces.
Geometric morphometric shape analyses using a set of two- or three-dimensional landmark coordinates (a set of coordinates characteristic of a shape) are obtained on each species, with records of the relative positions of anatomically corresponding locations (Adams et al. 2004). From these coordinates, a set of shape variables is obtained that can be used in multivariate statistical analysis to address a wide range of biological questions involving patterns of shape variation and their changes (Rohlf 1999).
Given the above, the objective of the current study was comparing the shape of cladodes of Nopalea cochenillifera using anatomical landmarks and statistical shape analysis.
MATERIALS AND METHODS
Research was carried from March 2016 to October 2018. According to the Köppen, region climate classification is BSwh, called semi-arid, hot and dry climate. Annual average rainfall, air temperature and relative humidity are 632.2 mm, 26 ºC and 60%, respectively (Leite et al. 2019), with atmospheric demand of 1,800 mm year-1, resulting in deficit of 1,143 mm year-1 (Silva et al. 2015).
Local soils are Typical Haplic Cambisol Ta Eutrophic, and samples for analysis were collected from the first 20 cm. Analysis showed it had the following characteristics: pH(water)= 7.20; P(extractor Mehlich I)= 40 mg dm-3; K+= 0.45; Ca2+= 5.3; Mg2+= 1.1 and Al3+= 0.0 cmolc dm-3, respectively (Leite et al. 2017). Following organic fertilization with 40 t ha-1 of bovine manure was implemented.
The design used was randomized blocks with three replicates using the Giant Sweet clone of the forage cactus Nopalea cochenillifera (L.) Salm-Dyck. The experimental unit (area of 8.4 m2; 4.2 m x 2.0 m), was composed of three rows of cacti, with a row spacing of 1.40 (85714 plants ha-1). The card deck system was adopted, with the cladodes planted along the row, with one plant overlapping the other. The area was weeded and maintained under natural rainfall conditions throughout the crop cycle. The evaluations were performed at 720 days after planting.
To determine mean cladode shape, 174 cladodes were randomly collected, 52 primary cladodes, 52 secondary, 50 tertiary and 20 quaternary. All cladodes were photographed with a DSC-P200 Sony camera, with a standard distance (45 cm) being used for all images. Each image was marked with 12 anatomical landmarks (Figure 1).
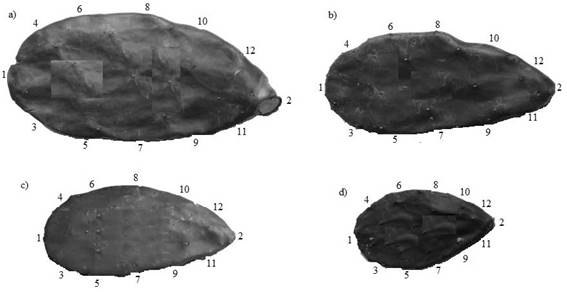
Figure 1 Anatomic landmarks of cladode of Nopalea cochenillifera Giant Sweet clone (a) primary cladode; b) secondary cladode; c) tertiary cladode and d) quaternary cladode).
Using Image J software, the values of pixel coordinates of the images were extracted. To ensure standardization, images were rotated and translated by Procrustes coordinates (Rohlf 1999), forming 174 two-dimensional numeric matrixes. Studied variables are listed in Table 1.
Table 1 Morphological variables
| Variables | Notation | Variables | Notation |
|---|---|---|---|
| Distance between 1 and 2 | D1 | Distance between 7 and 8 | D4 |
| Distance between 3 and 4 | D2 | Distance between 9 and 10 | D5 |
| Distance between 5 and 6 | D3 | Distance between 11 and 12 | D6 |
Ward Cluster Analysis was used to evaluate the difference between cladode classes (Hair et al. 2010). The analysis of variance was used to compare the different groups, after differences were detected in the Tukey test used at the 5% level. Discriminant analysis was used to find functions of observed variables that explained the observed differences among cladodes classes and classify the cladodes by branching orders (Hair et al. 2010). T² of Hotteling test and James were used to compare the cladode shapes via statistical shape analysis (Amaral et al. 2007), using anatomical landmarks described in figure 1. Data analysis was conducted using the shapes and cluster package of R-project statistical (R Development Core Team. 2016).
RESULTS AND DISCUSSION
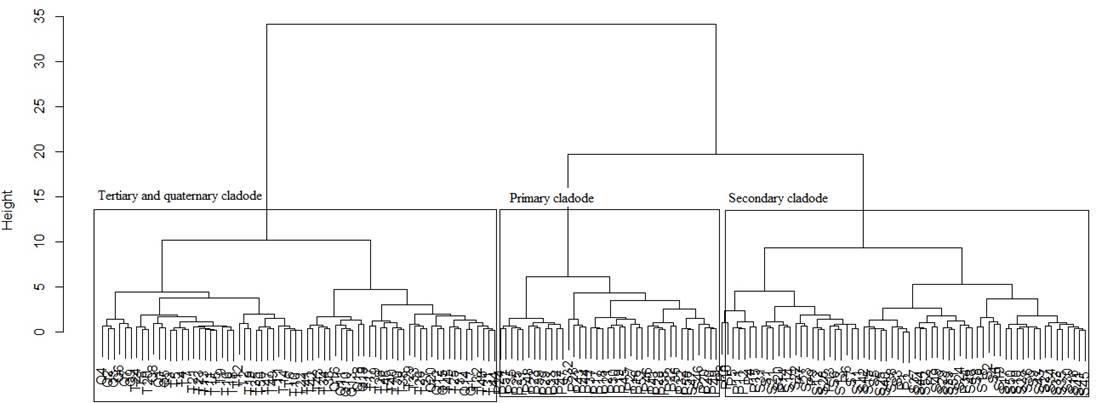
Figure 2 and table 2 shows the formation of three groups of cladodes by Ward cluster analysis, these being differentiated by growth order (primary, secondary and third group of tertiary and quaternary cladode combined). This behavior is explained by the plant morphological structure, because the primary and secondary cladodes in this phase are the main responsible by ensuring the support and fixation of the whole plant, while tertiary and quaternary cladodes are in initial stages of development (Queiroz et al. 2015). Ferreira et al. (2003) found differences between nine groups of clones of the forage cactus Opuntia ficus-indica Mill. Valdivia et al. (2008) reported the formation of two main groups Opuntia spp cladodes, one characterized by cladodes having white, brittle, longitudinal striated spines and second group with spineless cladodes.
Table 2 Analysis descriptive by groups of cladode order of Nopalea cochenillifera Giant Sweet clone
| Variables | Cladode groups (Mean±SD) | |||
|---|---|---|---|---|
| Primary | Secondary | Tertiary and quaternary | p-value | |
| D1 | 1644.0±44.96a | 1611.0±53.40b | 1152.0±81.46c | <0.0001 |
| D2 | 603.0±70.00a | 462.0±115.72b | 404.5±72.26c | <0.0001 |
| D3 | 858.0±64.54a | 660.4±124.97b | 583.7±66.62c | <0.0001 |
| D4 | 932.3±48.33a | 768.3±74.47b | 646.8±51.11c | <0.0001 |
| D5 | 849.9±76.58a | 768.1±76.64b | 577.6±83.48c | <0.0001 |
| D6 | 647.3±82.93a | 620.3±100.65b | 411.6±90.11c | <0.0001 |
SD- standard deviation; mean followed of same letters in row did not differ statistically by Tukey test at 5%.
Characteristics of the cladode related to length, width and perimeter, present strong correlations with the variables of plant phytomass yield, characterizing with crucial variables responses to the species and reliable for monitoring of the performance of forage cactus clones and/or for selection of clones with high productive yields.
Discriminant functions for each cladode branching order showed that the variables D1, D3, D4 and D5 were those that most contributed to between-order discrimination (table 3). This phenomenon can be explained by the physiological structure of the cladode, where primary and secondary are longer (D1) and wider (D3, D4 and D5) that the tertiary and quaternary, because the primary and secondary cladodes are the main responsible for sustentation of the plant and distribution of nutrients and water for other organs, explaining also its greater contribution in the indexes of photosynthetic area and cladode area due to its greater availability of assimilatory surface (Queiroz et al. 2015 and Mendoza-Orozco et al. 2018).
Table 3 Discriminant function by cladode order of Nopalea cochenillifera Giant Sweet clone
| Variables | Discriminant function by cladode order | |||
|---|---|---|---|---|
| Primary | Secondary | Tertiary | Quaternary | |
| Intercept | -3047.93 | -3296.69 | -1713.47 | -1340.66 |
| D1 | 2.735 | 2.829 | 2.043 | 1.803 |
| D2 | -0.092 | -0.105 | -0.081 | -0.084 |
| D3 | 0.775 | 0.820 | 0.580 | 0.522 |
| D4 | 0.712 | 0.775 | 0.571 | 0.508 |
| D5 | 0.762 | 0.777 | 0.569 | 0.512 |
| D6 | -0.130 | -0.128 | -0.114 | -0.111 |
The contribution of these variables to between-order discrimination is comprehensible, since there are considerable differences in the widths (D3, D4 and D5), lengths (D1) and in the shape of cladodes between the four types of orders. Discriminant function analysis correctly classified 49 primary cladodes of 52, 51 of 52 secondary, while the hit rates for tertiary and quaternary cladodes were 100% (table 4). The overall mean hit rate was 97.7%, indicating a failure to explain only 2.3% of the observed variation. The primary and secondary cladodes not classified in their respective orders (three primaries and one secondary) were due to the fact that these are growing cladodes. Primary and secondary cladodes are the main responsible for sustentation and fixation of plant and for this reason the cladodes are more similar than the third and fourth order (Queiroz et al. 2015)
Table 4 Classification of cladodes of Nopalea cochenillifera by discriminant function
| Observed | Predicted by model | |||
|---|---|---|---|---|
| Primary | Secondary | Tertiary | Quaternary | |
| Primary | 49 | 3 | 0 | 0 |
| Secondary | 1 | 51 | 0 | 0 |
| Tertiary | 0 | 0 | 50 | 0 |
| Quaternary | 0 | 0 | 0 | 20 |
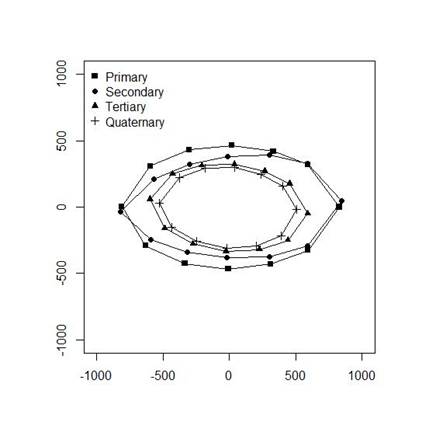
The primary and secondary cladodes had longer and wider mean shapes than the tertiary and quaternary cladodes. There was only a small difference between primary cladodes and secondary cladodes in terms of width, though the primaries were slightly wider. Tertiary and quaternary cladodes were similar in shape, although the tertiaries were wider and slightly longer (figure 3).
Greatest width and length measurements were obtained from the primary cladodes and decreased sequentially with order number (figure 3). Primary and secondary cladodes had the largest widths and lengths according to their age, because they were the oldest cladodes on the plant and consequently those responsible for supporting other cladodes, flowers and fruits, as well as transporting the nutrients and organic substances required for plant subsistence (Queiroz et al. 2015 and Mendoza-Orozco et al. 2018).
Hotteling T² and James tests showed differences between the mean shape of primary cladodes in relation to those of other orders (table 5). The shape of secondary cladodes differed in relation to the tertiary and quaternary cladodes. There were also differences between the shape of the tertiary and quaternary (table 5). The primary and secondary cladodes had similar elliptical shapes. Primary and secondary cladodes are responsible by sustentation of the plant, soon require an elliptical form to sustain all plant formation, otherwise it would not bear its weight, causing its fall. Studies of the species Opuntia ficus-indica (Hernández et al. 2010), Nopalea (Amorim et al. 2015) and Opuntia stricta (Lucena et al. 2018) also reported that cladode shape to be best described as an ellipse.
Table 5 Comparison of cladodes order shape of Nopalea cochenillifera Giant Sweet clone
| Comparison | T² of Hotteling Test | James Test | ||
|---|---|---|---|---|
| Statistical Test | p-value | Statistical Test | p-value | |
| Primary x Secondary | 9.853 | <0.0001 | 242.175 | 0.0099 |
| Primary x Tertiary | 13.143 | 0.0081 | 325.166 | 0.0008 |
| Primary x Quaternary | 13.073 | 0.0009 | 526.821 | 0.0001 |
| Secondary x Tertiary | 4.217 | 0.0073 | 104.769 | 0.0083 |
| Secondary x Quaternary | 5.323 | <0.0001 | 284.937 | <0.0001 |
| Tertiary x Quaternary | 2.100 | 0.0179 | 88.297 | <0.0001 |
Mottese et al. (2018) with studies of similarities in phenotypic characteristics of Opuntia genus observed that analyzes such as these help in the understanding of plant characteristics, being useful to traceability clones in different regions.
Higher values of cladode area allow greater photosynthetic area, besides providing greater water accumulation, presented high capacity of water retention in the parenchyma cells and in the large chloronquine vacuoles. Scalise et al. (2016) studying the dynamics of growth cladodes of Opuntia fícus-indica, showed that long periods of drought caused a reduction in the size and rate growth of cladodes. On the other hand, in situations where water availability was regular during the cycle, the cladodes growth was quite responsive.
The liquid assimilation rate is the index that expresses correlation between cladode area and dry matter production of the plant, that is, liquid photosynthesis. Represents the carbon gain of a species through liquid photosynthesis, that is, how much it can increase of dry mass per unit cladode area in time (Huber et al. 2018).
The liquid assimilation rates may be compromised depending of the position that the cladodes are inserted in the plant, but also on the dimension and opacity of the cladode surface, due to physical blocking of the sun rays. These light energy decreases negatively affect the flow of photoassimilates in cacti of the genus Nopalea (Nobel and Zutta 2008). The liquid assimilation rate behaves inversely to cladode area index values. According to Queiroz et al. (2015) as the cladode area index increases, the values liquid assimilation rate decrease circumstantially according to the self-shading. Therefore, the physiological and productive indexes of the cactus are influenced by the morphology of each clone.
Morphological characterization of Nopalea cochenillifera species is indispensable because this could help us to recognize physiological and biochemical mechanisms that confer resistance to extreme environments. The shape analysis carried out seems to be an adequate procedure to recognize morphological differences among Nopalea cochenillifera cladodes orders. Only a few morphological quantitative characteristics are significantly different among the cladode order groups. Length and width to be a reliable characteristic to be used as a morphological marker in the characterization of cladode order of Nopalea cochenillifera, because small differences of this characteristic are statistically significant.
These variables, derived from shape analysis, presented high discriminatory power and can be considered as potential descriptors to identify cladodes order and even to differentiate forage cactus, making it unnecessary to go in the field for this process, generate economize costs and time.

