


 Servicios personalizados
 Inglés (pdf)
 Articulo en XML
 Referencias del artículo
 Enviar articulo por email
 Citado por SciELO
  Similares en
SciELO
Similares en
SciELO 
 Permalink
Introduction
The acquisition and maintaining of inventory is justified whether their role of satisfying clients’ needs is taken into account or just the satisfaction of production needs if the raw materials are the inventories of which is talked about. There are other reasons which make the inventories useful in an organization, for example, if it is considered that the inventory is the first component of the cash conversion cycle and that the first step in generating profits is its sale. Various authors like Parada Gutiérrez (2009); Ortiz Torres (2012); and Shenoy & Rosas (2018), have also considered that keeping a supply of inventory is necessary for serving to earn a positive return, meeting demand randomness, adjusting the curves of demand and supply, allowing flexibility in production scheduling, avoiding the occurrence of shortages by using safety stocks, providing a safeguard for variation in raw material and merchandise delivery time, among others. These issues have made possible that the inventory systems follow up to answer such questions as: what kind of articles should be ordered? how many items should be ordered? when should the items be ordered? and which are the items of the greatest importance? These questions are approached by Boru, et al. (2019), by stating that inventories should be manufactured in the right quantity, in the right place, and in the right moment.
What it has been said so far is strengthened for the case of medicines, because of being products which are used in the treatment, diagnosis and prophylaxis of the different diseases that the patients suffer, and that are dispensed, in this study case, in a pharmacy. So, as part of their management, it should be taken account of their social impact, which is materialized by the patients recovering from diseases, the maintaining an optimum state of health, the improving of the patient’s quality of life, and the prevention from spreading diseases. It should have also considered the economic impact of the medicines’ logistic process and budget constraints. This economic impact materializes through the costs and expenses incurred in the manufacturing, carrying (investment costs, costs of storage, cost of inventory risks, and cost of servicing inventory), ordering (costs of administration, cost of transportation, cost of inspection and others), those for the occurrence of shortages; and those incurred until they are available for patients in the pharmacies, according to the real needs and the morbidity levels predicted for each planning period. The other issue to consider is the environmental impact caused by the exploitation of natural resources needed in their manufacturing, distribution and sales, and due to their destruction because of expiration through procedures which affect the environment.
The strategic control of pharmaceuticals has been traditionally carried out by the combination of classical ABC method and VED (vital, essential, desirable) or VEN (vital, essential, non-essential) methods. The combination of classical ABC and VED is used by authors as: Antonoglou, Kastanioti & Niakas (2017); Ceylan & Bulkan (2017); Güner Gören & Dağdeviren (2017); and Yilmaz (2018), in a form of a matrix. Others authors as Fernández Cabrera (2015); Awle (2016); Migbaru Abate, Yigeremu Gebremariam & Shibeshi (2016): and Wogayehu Taddele, et al. (2019) have combined the classical ABC with the VEN method by creating the ABC-VEN matrix. The VEN method is used internationally by health organizations to classify medicines according to their criticality, and the category special is added in Cuba, this category is identified with the capital letter E in the Cuban national formulary, and those medicines which have a controlled distribution and that are applied in special health programs are identified under this letter (Cuba. Ministerio de Salud Pública, 2019).
The method ABC is applied by the authors mentioned previously (Awle, 2016; Migbaru Abate, et al., 2016; Antonoglou, et al., 2017; Ceylan & Bulkan, 2017; Güner Gören & Dağdeviren, 2017; Yilmaz, 2018; & Wogayehu Taddele, et al., 2019), by considering as only criterion the annual value of consumption of each item, which allow to take decisions based on: the possible effect of acquiring products which do not respond to the real demand or morbidity, the occurrence of expirations, or a low inventory turnover of items with high acquisition costs. Notwithstanding these contributions, other economic criteria are not considered, like the case of sales and gross profit on sales, which have a direct relation with the results of any organization, and with the cash conversion cycle.
In connection with what it has been said and as stated by Gitman & Zutter (2012), the cash conversion cycle is calculated by deducting the average payment period from the operating cycle, which is determined by summing the average age of inventory and the average collection period. There is no doubt that Gitman & Zutter (2012), refers to wholesalers, but for the case of retailing business, the cash conversion cycle depends on average age of inventory and average payment period. This is the case of pharmacies whose sales constitute a cash inflow which allows to satisfy the short-term obligations as they come due, to keep on doing business and to be profitable which is called by Gitman & Zutter (2012), as “the relationship between revenues and costs generated by using the firm’s assets-both current and fixed-in productive activities” (p. 601), in this study case, in commercial activities.
On the other hand, the application of the VED and VEN methods is based on the criticality of medicines, according to each of their categories. Despite the VEN method is used officially and that every medicine is classified internationally according to it in the medicine formularies, the aforesaid authors (Migbaru Abate, et al., 2016; & Wogayehu Taddele, et al., 2019) use medical and pharmaceutical specialists to endorse this classification with the pharmaceuticals they assess. This procedure is also used in the case of the VED method when it is applied by the authors mentioned above (Antonoglou, et al., 2017; Ceylan & Bulkan, 2017; Güner Gören & Dağdeviren, 2017; and Yilmaz, 2018).
Despite the VED and VEN methods measure the criticality or use value of medicines when they are applied to the treatment, diagnosis and prophylaxis of diseases, and the ABC method measure the economic impact the consumption value of medicines have on the organization; Fernández Cabrera (2015); Awle (2016); Migbaru Abate, Yigeremu Gebremariam, & Shibeshi (2016); Antonoglou, et al. (2017); Ceylan & Bulkan (2017); Güner Gören & Dağdeviren (2017); Yilmaz (2018); & Wogayehu Taddele, et al. (2019), do not consider, in their proposals, the use of other criteria which are always present in every supply network, such as the supply risk, which constitute the commonest cause of: shortages in the supply network and low quality service, as it has been demonstrated in the papers written by Hudnurkar, et al. (2017); & Carvalho Fagunde, et al. (2020); and in the case of pharmaceuticals, the negative impact on patients due to the lack of these products in treating, diagnosing and preventing the diseases suffered, as it is confirmed by Jaberidoost, et al. (2013); Fernández Cabrera (2015); and Newton, Bond, et al. (2020).
Taking into account what it has been mentioned so far, this research paper proposes the use of a multicriteria and a multimethod approach to carry out the strategic control of the medicines inventory in a pharmacy by using the multicriteria ABC method, and the matrices risk in supply (RS)-use value (UV) and cost of goods sold (CGS)- average age of inventory (AAI).
Materials and methods
The studied performed comprised 487 medicines sold in a pharmacy during five years, from 2015 to 2019. These pharmaceuticals were classified in accordance with their impact on the results and the attainment of the organization objectives, and according to the different categories of the multicriteria ABC method which is developed by considering three quantitative criteria: the cost of goods sold, the sales and the gross profit on sales of every item studied. This method allows the use of other criteria in accordance with what it is going to be measured and also the kind of inventory that is going to be analyzed, by taken account of the impact those criteria have on the achievement of the organization goals. Another two methods were proposed: the risk in supply (RS)-use value (UV) matrix and the cost of goods sold (CGS)-average age of inventory (AAI) matrix. The first one is shown in table 1, and its proposal was put forward by adapting the one proposed by Ortiz Torres (2012), with the difference that the one presented in this paper was designed for the case of medicines by combining qualitative criteria which are more related to the kind of inventory studied and its use: the treatment, diagnosis, and prophylaxis of patient’s illnesses; the criterion supply risk was used to measure the possible occurrence of shortages which have a negative impact on the patients who will not be able to treat opportunely their diseases, and on the organization performance, and it was also selected the use value, which has been purposed to measure the criticality of medicines.
Table 1 - Risk in supply (RS)-use value (UV) matrix.
| Risk in supply | High | Risky items | Critical items |
|---|---|---|---|
| Low | Non-critical items | Basic items | |
| Low | High | ||
| Use value | - |
The cost of goods sold (CGS)-average age of inventory (AAI) matrix is shown in table 2. This method is purposed by considering the Parada Gutiérrez’ (2009), proposal, but dissimilar to his, the criterion inventory turnover was substituted for the average age of inventory, mainly because the average age of inventory is easier to interpret, because of being expressed in days and the inventory turnover is expressed in times; besides the undermentioned criterion, as stated by Gitman & Zutter (2012), is meaningful only when it is compared with that of other firms in the same industry. This method also uses the cost of goods sold in place of the acquisition cost, due to: the first one takes into account the acquisition cost per unit and the quantity of units sold, and therein lies its direct association with the average age of inventory, both of which are related to the way an organization may turn these resources.
Table 2 - Cost of goods sold (CGS)-average age of inventory (AAI) matrix.
| Cost of goods sold | High | Strategic items | Risky items |
|---|---|---|---|
| Low | Preferential items | Non-risky items | |
| Low | High | ||
| Average age of inventory |
The cost of goods sold (CGS)-average age of inventory (AAI) matrix relates two quantitative criteria, the same as the multicriteria ABC method, but in this case, the matrix purposed allows to improve the decision-making process by considering the interrelationship between turning medicine inventory, i.e., obtaining a cash inflow due to its sale, and the cost of goods sold, this last criterion which diminishes the revenue achieved by the sale. So, the matrix allows to measure the risk associated to the liquidity of inventory and its influence on generating profits.
The collection and ordering of the data of each item (i) according to each criterion (c) is carried out in a Microsoft Excel spreadsheet. The information to be collected is obtained from the accounting reports and records and from the technical department of the organization, as well as from the operations report of each pharmacy where these items are sold. The data collected are the following: monthly quantity sold of every item for the five years, unit sale price, unit acquisition cost, unit subsidy (if applicable), beginning inventory in units, ending inventory in units, total quantities ordered of each item per order, total quantities received of each item per order, and quantities received outside the term agreed in the economic contract.
The impact that each criterion (c=1,...,k) have on the organization for each item (i=1,…,n) is measured when developing the multicriteria ABC method. The assessment of the three criteria used in this method is done by using the scale proposed by Ortiz Torres (2012), as follows: 3 = high impact, 2 = middle impact, and 1 = low impact. Consecutively, the assessment alternatives for each criterion are presented in accordance with the undermentioned scale:
For the case of the cost of goods sold (CGS), the quantities sold per item (q
i
) in each month in study are added, and it is obtained the total units sold of every item  . Then, this result (QVi) is multiplied by the unit acquisition cost, resulting in the cost of goods sold of every item (CGSi) for every of the periods studied (1,…,m). The undermentioned calculation is expressed as follows: CGS1 =
 , CGS2 =
 ,…, CGSn =
 . Consecutively, the grand total of the cost of goods sold is calculated by adding the total cost of goods sold of every item, this is done by using the following expression: CGST =
 . These total costs are ordered in a descending manner, such that: CGS1> CGS2> CGS3>,…,> CGSn. The simple relative frequencies of the total consumption cost of each item (CGSi) are calculated, which is expressed as follows: fi =
  , so that: f1 =
  , f2 =
  ,…, fn =
  , where
  . The cumulative relative frequency (F) is then calculated: F1 = f1, F2 = f1 + f2, and so on until Fk = 1, whose results are multiplied by 100%, and the conditions to assign the impact of the cost of goods sold to every item are set, by applying the aforementioned scale, so that: 3 points (high impact) are assigned to those products in which it is fulfilled that
  2 points (middle impact) are assigned to those items in which it is met that
  and 1 point (low impact) is assigned to those in which it is true that
  .
.
In the same way as for the previous criterion, it is proceeded for the case of the remaining two criteria. In the case of sales, after the total quantities sold by items ( ) have been determined, these are multiplied by the unit sale price of each one (spi) and the total sales values per item are obtained (Si), so that: S1=QV1*sp1, S2=QV2*sp2,…, Sn=QVn*spn. The sales obtained are added together and the general total of sales (TS) is obtained. Next, the total sales by item (Si) are ordered in descending manner and the simple and accumulated relative frequencies are calculated; then, the impact of this criterion is determined in the same way that was proposed for the case of the previous one.
For the third criterion, the gross profit on sales (GPi) is determined by subtracting the cost of goods sold of each item (CGSi) from the sales values (Si): GP1=S1 - CGS1, GP2=S2 - CGS2,…, GPn=Sn - CGSn. The profits per item are added and the total gross profit on total sales (TGP) is obtained. The dataset is ordered in a descending manner by the values of the gross profit on sales, and the simple and accumulated relative frequencies are calculated, which are multiplied by 100%. Then, the impact of this criterion is evaluated and it is scored in the same way that was proposed for the two previous criteria.
Once the impact that each criterion (c=1,...,k) has on the organization for each item (i=1,…,n) has been determined, the inventory of medicines is stratified according to the ABC method by considering the ranges proposed by Ortiz Torres (2012), for which the sum of the evaluation obtained in each criterion (c) for each item (i) is determined. This evaluation factor is calculated as follows:  for c=1,…k y i=1,...n (where, X is the impact that is measured of each criterion (c) on each item (i). The final classification that is given to each item depends on the following ranges established by Ortiz Torres (2012): group A: for Aic values = (2*(c-1)+3;3*c=(7;9), group B: for Aic values = (c+2 ; 2*c)=(5;6), and group C: for Aic values = (c ; c+1)=(3;4).
The impact of each criterion (c=1,...,k) for each item (i=1,…,n) on the development of the risk in supply (RS)-use value (UV) matrix. In this study case, to determine the risk in supply (SR), the percentage of shortages in the delivery (PSDi) is calculated, which is determined by the substraction of the total quantities ordered (TQo) and the total quantities received (TQr), all divided by the total quantities ordered (TQo) and multiplied by 100%. This is expressed mathematically as follows:
 (adapted from Ortiz Torres, 2012).
The percentage of the delivery time breach (LT B ) is determined by dividing the quantities received outside the agreed delivery time (QRO dta ) and the total quantities received (TQ r ), that is to say:
 (adapted from Ortiz Torres, 2012).
Subsequently, the mean (M) of the percentage of shortages in delivery (PSD) and the percentage of the delivery time breach is founded. This is expressed by the following formula: M = , then the supply risk is classified according to the following conditions:
If  , then it is rated with 3 points (high), and if
  , it is rated with 1 point (low).
To quantify the use value of each item, their importance or criticality in the treatment, diagnosis and prophylaxis of the different diseases in which they are applied is taken into account, which is determined by using a panel consensus of medical and pharmaceutical specialists, the same way as Awle (2016); Migbaru Abate, et al. (2016); Antonoglou, et al. (2017); Ceylan & Bulkan (2017); Güner Gören & Dağdeviren (2017); Yilmaz (2018); and Wogayehu Taddele, et al. (2019), did when applying the VED and VEN methods. In the present study, a list of candidates is drawn up by the members of the pharmaceutical committee, their experience in this field, and the results of researches published in this topic.
Specialists (S) are selected in accordance with their coefficient of knowledge, and they are asked to measure the criticality of each item on a Likert scale of 10 points (form 1 = low to 10 = very high). The answers given are analyzed in order to determine whether there is a consensus of opinion among them. Then, as part of the data processing, it is obtained an accumulated frequency table and a relative frequency table, both helps to interpret data and the possible consensus among specialists.
Subsequently, a correspondence analysis is carried out that allows the grouping of the studied variable, through an object scores plot, a correlation analysis and the discrimination measures that speak about the grouping of specialists, that is, towards which criterion of analysis they are concentrated. So, the distances between cases are represented by evaluating the importance category in which the specialists have placed them (plot of the object scores). Then, a correlation analysis is carried out to quantify the degree of linear relationship between the importance categories in which the specialists have placed the evaluated items. Hence, a matrix with the correlation coefficients between the evaluations given by the specialists is constructed, and an analysis of the discrimination measures is carried out. These two analysis are used to determine whether there is a definite consensus of opinion among specialists, in case they tend to cluster. Otherwise, it could be said that there is no coincidence of opinion among them. Whenever consensus of opinion is reached, the ranges of values that measure the importance of medicines are determined, for which a two-point scale is used: 3 points (high impact = high criticality) and 1 point (low impact = low criticality). To achieve the grouping of items in these two scales, the K means clustering procedure is used to adapt the evaluations to the scale used, taking into account the similarity of the scores obtained from the opinions given by the specialists.
Once the impact of these two criteria, supply risk and use value, has been determined, the risk in risk (RS)-use value (VU) matrix is created.
Next, the impact of the two criteria which take part of the cost of goods sold (CV)-average age of inventory (AAI) matrix are measure. In this case, the impact of the criterion cost of goods sold should be measured in two scales, by considering that:
If the arithmetic mean of the cost of goods sold (CGSi) is representative of the distribution of the data, that is to say, the mean is not pulled to the left nor to the right, the decision rule is as follows: 3 points (high impact) are assigned to those items in which it is fulfilled that  , and 1 point (low impact) is assigned to those items in which it is fulfilled that
Where,
 : average cost of goods sold.
If the arithmetic mean of the cost of goods sold (CGSi) is not representative of the distribution of the data, that is to say, the mean is either pulled to the left or to the right, due to extreme values, the decision rule is as follows: 3 points (high impact) are awarded to those items in which , and 1 point (low impact) is awarded to those items in which
Where,
CVcgs: cost of goods sold coefficient of variability
Sequentially, the impact of the criterion average age of inventory (AAI i ) is measured on every item. So, the following financial ratio is determined:
 (Gitman & Zutter, 2012), where,
AAIi: average age of inventory and,
ITi: inventory turnover.
The inventory turnover is calculated as follows:
 , where,
BIi: beginning inventory balance,
EIi: ending inventory balance.
This criterion is then measured by considering that:
If AAIi 15 days, then the item is awarded 3 points (high impact).
If AAIi ˃ 15 days, then the item is awarded 1 point (low impact).
15 days are used to measure this criterion because it coincides with the lead time established by the entity under study.
Finally, the matrix cost of goods sold (CGS)-average age of inventory (AAI) is created by classifying the items in accordance to the four quadrants in which they are located.
Next, the possible relationships that may exist between medicine classifications are determined, in accordance with three methods proposed, and a series of strategic actions are presented, which contribute to a better planning process of medicines in pharmacies.
Results and discusssion
The objective of this study was to develop a conceptual model for the control of medicines in pharmaceutical enterprises, based on the multi-criteria and multi-method classification of these items, and considering criteria of the economic (quantitative data) and medical (qualitative data) order. By implementing the procedure and steps algorithm described in the previous section, the results shown below were obtained.
The impact of each criterion (c=1,...,k) for each item (i=1,…,n) on the development of the ABC method was determined. When measuring of the cost of goods sold, it was observed that 57 itemss (11.70% of the total) consumed 79.99% of the grand total of the costs ($ 226793124.77) for the five-year period analyzed, these items were considered as high impact; likewise, 121 items (36.55% of the total) consume 14.96% of the grand total of the costs ($ 42428246.70), these were considered as middle impact and a total of 309 items (51.75% of the total) consume 5.05% of the grand total of the costs ($ 14311342.66), these latter were considered low impact. These results are shown in table 3.
Table 3 - Impact of the cost of goods sold.
| Impact of cost of goods sold | Total | |||
|---|---|---|---|---|
| 1 (low) | 2 (middle) | 3 (high) | ||
| Number of medicines | 309 | 121 | 57 | 487 |
| Cumulative % of medicines | 51.75% | 36.55% | 11.70% | 100% |
| Cumulative cost of goods | 14311342.66 | 42428246.70 | 226793124.77 | 283532714.13 |
| Cumulative % of costs | 5.05% | 14.96% | 79.99% | 100% |
The impact of the sales were measured, and its results are shown in table 4. As can be seen in this table, 49 items (10.06% of the total) turned out to be of high impact for the organization, and represented the 79.93% of the grand total of sales ($ 474371358.01); 119 items turned out to be of middle impact (24.44% of the total) and represented the 15.04% of the grand total of sales ($ 89291448.31) and 319 items (65.50% of the total) turned out to be of impact, which represented the 5.03% of the grand total of sales ($ 29842290.63).
Table 4 - Impact of sales.
| Impact of sales | Total | |||
|---|---|---|---|---|
| 1 (low) | 2 (middle) | 3 (high) | ||
| Number of medicines | 319 | 119 | 49 | 487 |
| Cumulative % of medicines | 65.50% | 24.44% | 10.06% | 100% |
| Cumulative sales | 29842290.63 | 89291448.31 | 474371358.01 | 593505096.95 |
| Cumulative % of sales | 5.03% | 15.04% | 79.93% | 100% |
The impact measurement continued with the gross profit on sales, whose results are shown in table 5. In this table, it is observed that 22 items (4.52% of the total) were classified as high impact, these ones represented 79.61 % of the grand total of the gross profit on sales ($ 237981094.83); thus, 81 items (16.63% of the total) were classified as middle impact, which represented the 15.35% of the grand total of gross profits on sale, and a quantity of 384 items (78.85% of the total) were measured as low impact, which represented the 5.04% of the grand total of gross profit on sales ($ 15065875.28).
After having determined the impact of each selected criterion, the stratification of the inventory of medicines, according the different classes of the ABC method, was carried out. The results achieved showed how the percentage relation for any of the classes were similar to those experienced by Migbaru Abate, et al. (2016); Antonoglou, et al., (2017); Ceylan & Bulkan (2017); Güner Gören & Dağdeviren (2017); Yilmaz (2018); and Wogayehu Taddele, et al. (2019), when using this method with the same purpose. This relation was mainly experienced in terms of effect, that is, in value; when observed that, in this study case, the items in zone A represented the 81.45% ≈ the 80% of participation in the total economic effect; those in zone B, the 13.38% ≈ the 15% of participation in the total economic effect, and those in zone C, the 5.17% ≈ 5% of participation in the total economic effect.
Table 5 - Impact of gross profit on sales.
| Impact of gross profit from sales | Total | |||
|---|---|---|---|---|
| 1 (low) | 2 (middle) | 3 (high) | ||
| Number of medicines | 384 | 81 | 22 | 487 |
| Cumulative % of medicines | 78.85% | 16.63% | 4.52% | 100% |
| Cumulative gross profit | 15065875.28 | 45886326.42 | 237981094.83 | 298933296.53 |
| Cumulative % of gross profit | 5.04% | 15.35% | 79.61% | 100% |
The results attained in the stratification of items in accordance with the ABC method are shown in table 6. As it is observed in this table, the percentage proportions between items pursuant to the three zones of the ABC method were: for zone A: 11.50% of items (56 of them) represented the 81.45% in terms of economic impact, for zone B: 22.59% of items (110 of them) represented the 13.38% in terms of economic impact and for zone C: 65.91% of items (321 of them) represented the 5.17% in terms of economic impact.
Table 6 Multicriteria ABC clasification.
| ABC classification | Total | |||
|---|---|---|---|---|
| A | B | C | ||
| Number of medicines | 56 | 110 | 321 | 487 |
| Cumulative % of medicines | 11.50% | 22.59% | 65.91% | 100% |
| Cumulative criteria | 319274792.01 | 52458370.39 | 20257206.80 | 391990369.20 |
| Cumulative % of criteria | 81.45% | 13.38% | 5.17% | 100% |
For a better understanding of the results previously exposed, the way in which the 487 items were distributed according to the multicriteria ABC classification is shown in fig. 1.

The development of the risk in supply (RS)-use value (UV) matrix began with the impact measurement of the two criteria wich compose it. The impact of the supply risk was measured by using the expressions developed and the decision rules presented in the previous section of this paper. The results achieved by determining the impact of the supply risk are presented in table 7.
Table 7 - Impact of supply risk.
| Impact assessment | Quantity of items | Percentage from total |
|---|---|---|
| High risk (3 points) | 177 | 36% |
| Low risk (1 point) | 310 | 64% |
| Total | 487 | 100% |
As observed in table 7, 117 items (36% of the total) were classified as being of high risk and 310 items (64%of the total) were given one point, that is to say a low risk impact.it should be taken into account that the results attained by measuring the impact of this criterion could be used for the subsequent determination of the safety stock levels of each of the articles studied, based on the uncertainty in the behavior of the demand and the influence that the supply risk has on it.
The use value of each item is determined by considering 22 specialists, of whom 68% (15 of them) are doctors and the remaining 32% (7 of them) have their first degree in pharmaceutical sciences. The 13% (3 of them) have a PhD and 25% (5 of them) have a master's degree in sciences. All the specialists have as average 14 years of experience of working with medicines which confers reliability to the study. When determining the competence coefficient of each specialist, it was observed that the 77.27% (17 of them) obtained a high score and the 22.73% (5 of them) got a middle score. As the average competence coefficient is equal to 0.907159, the 22 specialists were accepted to participate in the study.
When analyzing the results of the medicines assessment given by the specialists about the importance each medicine has on the treatment, diagnosis and prophylaxis of the diseases in which they are applied, it was observed that the 487 medicines assessed were grouped in five categories of importance, then a frequency analysis is carried out by showing light opinion differences when assessing 66 medicines, which are determined as not being significant, due to the 77% of specialists (17 of them) coincide in the grouping proposed. This fact was borne out by performing an analysis of the objet scores plot, which is shown in fig. 2.

In the fig. 2, the distances between cases (medicines) are represented, by considering the category group where they were placed by the specialists. As it is observed, the proposal of their stratification in five groups is easily seen. In the first group of importance (10 points), 175 items (36% of the total) were placed; in a second group (9 points), 12 items (2% of the total) were placed; in a third group (6 points), 127 items (26% of the total) were placed; in a fourth group (4 points), 76 items (16% of the total) were placed and in a fifth group (1 point), 97 items (20% of the total) were placed.
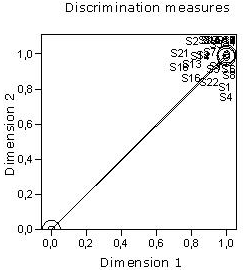
A discrimination measures analysis was performed as shown in figure 3. As observed in this figure, the assessment given by the specialists (S) have large discriminations, which indicate a high degree of discrimination between the categories of the variable studied along both dimensions. It is also noticed how the objects (specialists) are grouped together, tending to form a cluster. In spite of noticing that some specialists tend to spread far apart from the others in accordance with their opinions, specifically those labelled as S1, S2, S3, S4, S5, S8, S14 y S22, which were reduce to S1, S4, S5, S8 y S22 in a further analysis; the consensus of opinions among the 72% (15 specialists) was attained. However, the spreading out of the undermentioned five specialists is not significant, due to the trend of all of them is to cluster. This fact is easily seen in fig. 3.
The grouping obtained was measured by a 2 points scale in order to create the corresponding matrix. With the undermentioned purpose, a k-means clustering analysis was performed, in which medicines were grouped in two clusters as observed in table 8. 173 items (35.52% of the total) were grouped in the first cluster, these articles are the ones which were scored as 1 and 4 and were part of the previous 4 and groups respectively. These items were considered as having a low use value. In the cluster 2, 314 items (64.48% of the total) are grouped, these ones were those which obtained a score of 10, 9, and 6 and formed the groups 1, 2 and 3 previously conformed. These 314 items were considered as having a high use value.
Table 8 Grouping of medicines in two clusters.
| Number of Cases in each Cluster | ||
|---|---|---|
| Cluster | 1 | 173,000 |
| 2 | 314,000 | |
| Valid | 487,000 | |
| Missing | ,000 | |
The impact measurement of the criteria supply risk and use value were used to create the corresponding matrix, whose results are shown in table 9.
Table 9 - Risk in supply (RS)-use value (UV) matrix.
| Quadrants | Quantity of items | Percentage of the total |
| Non-critical items | 49 | 10.1 |
| Basic items | 261 | 54 |
| Critical items | 129 | 26 |
| Risky items | 48 | 9.9 |
| Total | 487 | 100 |
As noticed in table 9, 49 items (10.1% of the total) were classified as non-critical, these items have a low risk on supply and a low use value; 261 items (54% of the total) were classified as basic and have a high use value and a low supply risk; 129 items (26% of the total were classified as critical and have a high use value and a high supply risk and 48 items (9.9% of the total) were classified as risky, because of having a high supply risk and a low use value.
The results of the matrix should be used by the organization for establishing the corresponding safety stocks and for assessing the providers of each of the items with risky supply.
The impact measurement of the two criteria of the cost of goods sold (CGS)-average age of inventory (AAI) matrix was then carried out. The first criterion measured was the cost of goods sold, next the following statistics related to the observations of this criterion were calculated: the mean, the variance and the standard deviations. These statistics were used to select the decision rule on the impact measurement of the cost of goods sold in a 2-points scale.
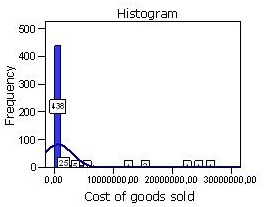
When processing the data of this criterion and determining the undermentioned statistics, it was observed that the mean was not representative of data distribution which is can be easily seen in the results shown in table 10. The results of the variance and the standard deviation showed that data were too dispersed from the mean of the distribution, due to the existence of extreme values.
The standard deviation showed that data were dispersed from mean in 2350136 units. So, taking account of the results explained above, it was concluded that the mean could not be used to measure the impact of the cost of goods sold.
Table 10 Cost of goods sold statistics.
| N | Valid | 487 |
| Missing | 0 | |
| Mean | 582202,6984 | |
| Std. Error of Mean | 106494,84424 | |
| Std. Deviation | 2350136,36848 | |
| Variance | 5523140950445,680 | |
| Minimum | ,00 | |
| Maximum | 26997080,56 | |
The dispersion of data from the mean is easily perceived in the histogram shown in fig. 4. In this histogram are represented the extreme values which occur to the left of the distribution. This histogram was created by adding a normal curve which is not a bell-shaped one because of the fact mentioned already. As it can be observed, the first bin covers the range $0 to $ 438,000, but there are some costs of goods sold that make far more than that. The reason that the histogram seems to leave so much of the blank area is that there are small numbers of observations that couldn’t be seen and that the distribution represented is not symmetric at all, in fact, it is very skewed to the right.
Considering the statistic results explained above, the impact measurement of this criterion was carried out by taking in to account the decision rule 2, for which it was necessary to determine the cost of goods sold coefficient of variability. Once calculated, it showed to be equal to 0.1760. when applying the decision rule selected, the cost of goods sold impact measurement shown in table 11 was obtained.
As observed in table 11 and in accordance with the cost of goods sold, the 57 items (12% of the total) were classified as being of high impact and 430 items (88% of the total) were classified as being of low impact.
Table 11 - Two-scale impact measurement of cost of goods sold.
| Impacts | Quantity of items | Percentage |
|---|---|---|
| High impact | 57 | 12% |
| Low impact | 430 | 88% |
| Total | 487 | 100% |
Sequentially, the average age of inventory impact was determined by considering the steps algorithm presented in the previous section of this paper. The impact measurement of this criterion is shown in table 12. As seen in this table, 410 items (84% of the total) were classified as being of high impact and 77 items (16% of the total) were classified as being of low impact in accordance with the number of days the organization has the items on hand until they are sold to the customers, in this study case, patients.
Table 12 - Average age on inventory impact measurement.
| Impact | Average age of inventory | Quantity of items | Percentage |
| High impact | Low | 410 | 84 |
| Low impact | High | 77 | 16 |
| Total | - | 487 | 100 |
After having measured the two undermentioned criteria, the cost of goods sold (CGS)-average age of inventory (AAI) matrix was created. The quantity of items and percentages per quadrants are shown in table 13. As observed, 352 items (72% of the total) presented a low average age of inventory and a low cost of goods sold, and were classified as preferential items; 57 items (12% of the total were classified as strategic, presenting a high cost of goods sold and a low average age of inventory; 12 items (2% of the total) presented a high cost of goods sold and a high average age of inventory, being classified as risky items and 66 items (14% of the total) were placed in the quadrant corresponding to the non-risky items, these ones presented a high average age of inventory and a low cost of goods sold.
Table 13 - Cost of goods sold (CGS)-average age of inventory (AAI) matrix.
| Quadrants | Quantity of items | Percentage |
|---|---|---|
| Preferential items | 352 | 72% |
| Strategic items | 57 | 12% |
| Risky items | 12 | 2% |
| Non-risky items | 66 | 14% |
| Total | 487 | 100% |
Finally, the strategic actions for the medicines management were proposed. These actions are presented as follows:
For items classified as A, preferential and strategic, as well as basic and critical, it was proposed to perform a rigorous control on the execution of their planned figures, carrying out a thorough analysis of the deviations occurred between the quantites demanded by patients, those sold and planned. To carry out their planning process by taking into account the demand performance through scientific methods, and considering the morbidity levels, as well as its sudden changes. To determine the management inventory parameters applied to medicines, and likewise the maximum and minimum level of each item (with the exception of those items that are dispensed through control cards) which sould be updated periodically.
For items classified as B and C, independently of other classifications, it is proposed to: establish a strict observation regarding any legislative change that might occur in their sale prices or acquisition costs, to observe that the quantities purchased are in correspondence with the level of prescription, starting from considering the actual morbidity.
For items clasiflied as basic, regardless of other classifications, it is proposed to: assign security stocks to protect against randomness of demand, when a change in morbidity occurs.
For items with risky and critical supply, it is proposed to: determine the inventory stocks in order to face the occurance of a random demand and the delivery time breach.
For non-critical items: to provide a minimal protection.
For high-risk items: to monitor rigorously the behaviour of demand, and periodically analyze the level of stocks and their correlation with demand.
For low risk items, not included in the classification zone A of the ABC method, neither basic nor critical: to maintain adequate levels in accordance with the actual demand.
In all cases, it is advisable to determine: the average age of inventory, lead time, safety stock, safety stock turnover schedules, and maximum and minumun levels for items of interest.
Conclusions
This work has presented the proposal of a multicriteria and multimethod approach to control the inventory of medicines from a selective way. It was used the multicriteria ABC method by combining economic parameters, their selection was intended to avoid skewing the original economic character of the ABC, as well as, preventing from distorting the results of it, when combining parameters of the quantitative and qualitative order in the same method. The results of the multicriteria ABC method pinpointed that, as an average, the 11.50% of all pharmaceuticals gathered the 81.45% of the total economic effect.
The risk in supply (RS)-use value (UV) matrix demonstrated that the combination of such criteria, help the organization to take decisions based on those medicines that are more critical for preventing, treating or diagnosing the diseases in which they are applied and the actual risk of the occurrence of shortages because of supply disruption.
The results in the application of this last method showed that: the 10.1% are non-critical, the 54% are basic, the 26% are critical and the 9.9% are risky. The cost of goods sold (CGS)-average age of inventory (AAI) matrix was introduced to support the economic decision-making process of medicine inventories, based on regarding with the costliest items in relation with the speed with which they are moved and converted into sales. According to this method, the results of its application have showed that the 72% of all medicines are preferential, the 12% are strategic, the 2% are risky and the 14% are non-risky.

