


 Servicios personalizados
 Inglés (pdf)
 Articulo en XML
 Referencias del artículo
 Enviar articulo por email
 Citado por SciELO
  Similares en
SciELO
Similares en
SciELO 
 Permalink
Introduction
Transport sector is responsible for a significant contribution to greenhouse gases emissions (GHG) and to the climate change, as well as for local air pollution, being quasi dependent (up to 95%) on liquid fossil fuels derived from crude oil, and accounting for more than 60% of total world’s oil consumption (Bartolozzi,et al., 2013).
Environmental and human impacts like climate change, acidification, human toxicity, eco-toxicity and particulate matter formation are enough reasons to motivate people to find new fuel technologies aimed to mitigate oil dependency and the environmental impacts of transport (Helmers, et al., 2017). Generally, when we see a new technology, we focus on the potential advantages and applications, but we need to establish these benefits taking into account the complete life cycle of products, including material extraction, manufacturing, use, energy supply, and end-of-life.
Electric vehicles reduce carbon, sulfur, and nitrous oxides emissions in urban areas. Reasons why they are progressively becoming an attractive option to reduce noise and greenhouse gasses and to reduce the oil dependency. However, electricity production must include alternative and renewable technologies for electricity generation (Gemechu, et al., 2017). Worst case scenario stand that we have 50 years of fossil fuels resources at present utilization rates. Increasing scarcity will increase prices but we have other worries like global warming and rising sea level.
The biggest expansion of electric vehicles is related through improvements on lithium batteries, which has a reasonable energy storage and charge time in fort of nickel and cadmium batteries. Companies like Tesla, Nissan, Mitsubishi and Renault are producing commercial electric vehicles with aims on expand sales in whole world (Egede, et al., 2015).
An increase of number of electric vehicles must carry an increase of specific metals (Onat, et al., 2016) that enrolment in global metal production is associated with anthropogenic activities, such as mining. A possible massive use of Electric Vehicles would consume strong quantities of lithium. In the future lithium supply could be come across a scarcity of resources (Notter, et al., 2010; Stamp, et al., 2012).
Electric vehicles apply technologies in a wide range of materials some of them are not in abundancy on earth, like as neodymium, cobalt, lithium, magnesium, and dysprosium (Gemechu, et al., 2017). These resources have been identified as strategic on their production countries. Other type of vehicles that are developing at this time, such as hydrogen fueled vehicles. But at current, a nearly of 97% of total hydrogen production comes from steam reforming that happens in oil and natural gas refineries, so it is fossil fuel derivate, and consequently only 3% is obtained from other sources, this is the main disadvantage that they have, because in terms of green mobility these vehicles are still depending on oil production.
The Peruvian Automotive Association notes in July 2019 that since 2016, 436 hybrids and 23 electric vehicles have been imported. The primary problem to the acquisition of these vehicles is their price, since 45% of the vehicle price corresponds only to battery value. However, the price of batteries has been falling and between 2024 and 2025 the prices of an electric will be very close to those of a traditional vehicle. (Martínez, 2016).
The second problem for electric vehicles in Peru is the installation of charge stations, and here we are in a circular problem, users will not decide to invest in vehicles that cannot supply energy and companies will not decide to implement charge stations until there is sufficient demand. In this dilemma the State had to make a political decision, in conjunction with the private company, for promotion and encourage the installation of charge stations.
Decision makers and governments must have technical, environmental and economic framework to support decisions, considering long term innovation and external costs (Bartolozzi, et al., 2013). It is necessary to have all perspectives to make the judgment, in Peru electricity generation is 48 % from hydropower so, it can reduce the greenhouse gas emissions in the “Use” step of vehicle life cycle, but there are a lot of components that is needed to build a car that can have more environmental impacts, such as rare metals used for batteries and electronic components (Du and Graedel, 2011).
This study comes from the necessity to clarify the impacts of introducing electric vehicles in Peru. We select the Life Cycle Assessment methodology to estimate and compare the potential impacts of electric vehicles in front of petrol ones.
In December 2018, through Supreme Decree No. 019-2018-MTC, the Peruvian government modified the National Vehicle Regulation (RNV) with the objective of integrating the vehicle fleet to vehicles made with technology novel and that use innovative energy, like electric cars and bicycles assisted pedaling. It also proposes to tell with a National Homologation System Vehicular, which will be supported by the Registry National Vehicle Homologation. The norm details that said record will be an important instrument for the State check if new models, whether imported, manufactured, or assembled in the country, comply with environmental standards, energy efficiency and road safety. Is measure must implement, at the latest, on December 31, 2020. The goal is model a common norm and make feasible mechanisms for competent control of registration, transit, and operation in the System National Land Transport (SNTT) of the imported vehicles before they enter in the country.
Furthermore, as a technical requirement, vehicles electric vehicles that provide taxi service must have a minimum autonomy of 200 km with a maximum power not less 80 kW. It is also noted that maximum limits for atmospheric emissions required by Supreme Decree No. 010-2017-MINAM no are applicable to electric vehicles or to those of category O (trailers). The RNV includes new definitions, including featured: bicycle with pedaling system power assist (SPA), quadricycle, rated power maximum, autonomy, electric vehicle, conventional hybrid vehicle, vehicle plug-in hybrid and electric vehicle with extended autonomy.
After 6 months of the publication of the draft of the supreme decree for the development of the electric vehicle market, the Ministry of Energy and Mines (MINEM) assured that the standard is already ready and will be made official in April of this year 2020.
Electric cars are increasing in sales and brand positioning according Musonera & Cagle (2019). The distribution of electric vehicles exceeded two million units during 2018, which meant an increase of 64% with respect to the previous year (The Electric Vehicle World Sales Database, 2020). Within the types of vehicles sold are found not just battery electric vehicles (VEB) and plug-in hybrid electric vehicles (VEHE), but also trucks and vehicles light commercial, whose main destinations They were the United States, Europe, and China. The main EV destinations register increases in the number of units sold, apart from Japan, where a slight 5.4% drop.
In the case of China, based on data collected from the (The Electric Vehicle World Sales Database, 2020), the highest registered lawsuit was filed during the last years, surpassing the million vehicles (1,182 million) and increasing the sales volume of the Asian country by 78%. It should be noted that China, to date, demands 56% of EV produced globally.
One of the incentive indicators in the use of electric and hybrid vehicles is the total cost of ownership (TCO). To calculate the CTP, the methodology developed in using information from the Peruvian vehicle market.
To make a fair comparison between the vehicles, it is necessary to consider the additional characteristics they have, as these aspects make vehicles more expensive despite belonging to the same segment. In this sense, the evaluation has been considered from three models that are commercialized in Peru. All the compared vehicles have the same number of airbags, reinforced chassis, electronic stability control, suspension system and wheels.
The accumulated cost of ownership of the selected vehicles considering fuel expenses, maintenance and initial price; With a 10-year perspective (the time that is guaranteed by the manufacturer), it is approximately USD 43000 for the electric vehicle, USD 41000 for the hybrid and 42500 for the internal combustion vehicle. It can be noted that for the electric vehicle to be feasible for the user at 10 years its initial price should be less than 34000 USD, a price that is even higher than an initial price of the same vehicle in a country like Spain.
If we make a reference to the prices of vehicles in Peru with Spain, we can see that a Hyundai Ioniq Electric costs 40 thousand dollars in Peru, compared to 31 thousand that this same vehicle costs in Spain; the hybrid version costs around 27 thousand USD while in Spain 23 thousand; While a vehicle with similar equipment with an internal combustion engine could be the Hyundai I30, whose cost in Peru is 22 thousand USD while in Spain it does not exceed 15 thousand. This factor is a limitation in the introduction of electric vehicles since, as can be seen in (Gnanapragasam, et al., 2017) the price is an extremely important factor in the purchase decision.
The purchase of an EV implies the main expense, while the costs of operation (fuel) and maintenance represent approximately 9% of CTP, compared to a range of 39% -49% in the case of a VMCI. Thus, the main concept cost of a VMCI becomes the main concept of savings in the case to use a VEB (100% electric). These energy savings are greater for taxis, when making more trips.
In 2019, Peruvian dealers sold 16 electric vehicles and 237 hybrids, for a total of 253. This amount represents 0.21% of total vehicle sales in the country. This relative percentage has been increasing since 2016, when the first electric and hybrid units were sold, at that time the relative percentage meant 0.0094%, becoming 0.074% in 2017 and 0.18% in 2018.
It is expected that in the future, the manufacturing cost of electric vehicles decrease because of innovations technologies in battery production. This is feasible, considering that, according to Bloomberg Finance L.P. (2020), the price of lithium ion batteries, measured in USD/kWh, reduced by 20% annual between the years 2010-2018. However, despite the decrease in manufacturing prices, it is necessary to have adequate promotion policies for electric mobility. Application of Artificial Intelligence in Automation of Supply Chain Management can aid the cost reduction of batteries and vehicle cost in general.
To know concretely the contribution of the introduction of electric vehicles to the mitigation of climate change, it is necessary to carry out a life cycle analysis study. It should be considered that Peru's electricity generation matrix has a good performance in the emission of greenhouse gases. As can be seen in figure 1, 55% of electricity generation is carried out from hydroelectric plants, while the energy generated from thermal plants represents 37%, it can also be noted that these thermal plants use gas natural, so they are a favorable alternative to plants that use coal or oil. Generation from renewable sources (RER) such as solar, wind and tidal waves do not yet have a great impact on the energy matrix, reaching 7%, however, state policies foresee that they may have an increase. (Figure 1).
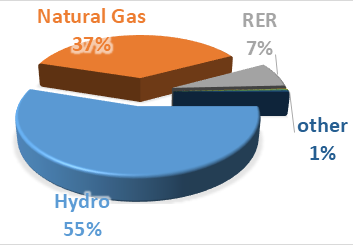
Source: Perú. Presidencia del Consejo de Ministros (2017).
Fig. 1 - Electricity generation matrix in Peru, measured by electricity production according to type of energy resource.
As can be seen, it would be expected a priori that the results of the introduction of electric vehicles will be favorable, since several studies have been consulted where it is precisely the use of vehicles that generates the greatest amount of greenhouse gas emissions.
In this study we use Life Cycle Assessment methodology, following the ISO 14 040 standard, according to which investigations must be alienated into the following four stages:
Goal and scope definition. Is the initial phase, includes describing project objectives, functional unit, system boundaries, assumptions, analytic limits and quality of data, and environmental impact categories to considered.
Life cycle inventory analysis. Currently, we execute a data gathering by means of literature searches, experiments, or any other data collection method.
Life cycle impact assessment. At this is the step we assess environmental issues, due to the resource’s consumption and pollutants emissions. The collected data is calculated according to the chosen impact assessment method, to give a valuation of potential environmental risk. This stage is further divided into three steps:
Classification. Flows resulting of life cycle inventory must be assigned to related impact categories.
Characterization. The potential effects of emissions and inputs are calculated by multiplying all elementary flows of inventory with its corresponding characterization factor, finding the results of aggregates indicators
Normalization and weighting. In general, LCA practitioners do not use this normalization when the study is proposed to show a comparative result. Because the subjectivity introduced by weighting of characterization factor to obtain category indicators.
Life cycle interpretation. This is the final phase and its aimed to highlight hot spots in the life cycle and compare possibilities of changes on materials or emissions. This phase is aimed to mitigate environmental impacts. In this phase we also compare different scenarios.
Assessing the environmental loads related with vehicles requires contemplation of their complete life cycles, since considerable loads can be produced in vehicle use, production, or fuel supply chains. According to Bauer, et al. (2015), the current stage of technological development differs from internal combustion engines and electric vehicles.
The objective of this study is to compare a hatchback electric vehicle with capacity for 5 passengers and in a mid-range, with its similar hybrid and internal combustion vehicles, fueled by petrol and liquified petroleum gas. For comparison, the Hyundai i30 was chosen as the internal combustion vehicle, considering 2 available versions (petrol and liquified petroleum gas). We also use for the comparison the Hyundai Ioniq electric and hybrid version. The reasons for choosing these vehicles are the similarity in the range of autonomy, engine power, comfort and size; keeping in mind that the hybrid version of the Ioniq uses the same engine as the i30 and all in general the same body platform, suspension, brake and steering systems.
Development
System boundaries include extraction of raw materials, fuel production, electricity generation, manufacture of vehicles and use, the use includes fueling, driving and maintenances. The functional unit is defined as “Transport 1 passenger during 3 months within an urban area with an average estimated daily route of 100 km”.
Limitations of this study comes from the impossibility of accessing the specific inventory of the construction of both studied cars. In this way, the existing data has been used and adapted to the specificities of vehicle manufacturing. In addition, it would have been more complete to have access to different models and brands of vehicles in the same segment, however it has not been possible, since there are not many options to find a fully electric vehicle in Peru. We hope to complete the study with the incorporation of other vehicles such as those that use natural gas and hybrids, but at this time these points are established as limitations of the study.
For the construction of vehicles, we use Eco-invent Database Version 3.6, in which is described the emissions and resources related to production of both vehicles, its general use and maintenance. The used datasets were parametrized using specifications of studied vehicles (potency, weigh, capacity).
During the study of the use stage, we have tested the two mentioned vehicles, recording their fuel or electricity consumption, for 3 months. In addition, a typical maintenance has been carried out for mileage of which the elements that we need to replace have been noted. We have evaluated the wear of the brakes of both vehicles, since it was assumed that in the case of the electric one there would be less wear, since it has the regenerative braking system, which performs part of the braking with the electric motor to generate electricity and charge the batteries.
For the two vehicles evaluated, we assume electric generation according to Peruvian electricity mix and petrol production according with Peruvian National Life Cycle Database.
After developing the life cycle inventories, the ReCiPe methodology has been used to compare the alternatives formed, in Figure 2, the results of the impact evaluation for a battery electric vehicle (BEV) are shown, a vehicle hybrid (HEV), an internal combustion vehicle using liquefied petroleum gas (LGP_ICEV) and an internal combustion vehicle using gasoline (P-ICEV). It is important to note that although the electric vehicle offers great benefits in the categories of "scarcity of fossil resources" and "Global Warming"; it has greater impacts in categories such as Eutrophication, ecotoxicity and water consumption.
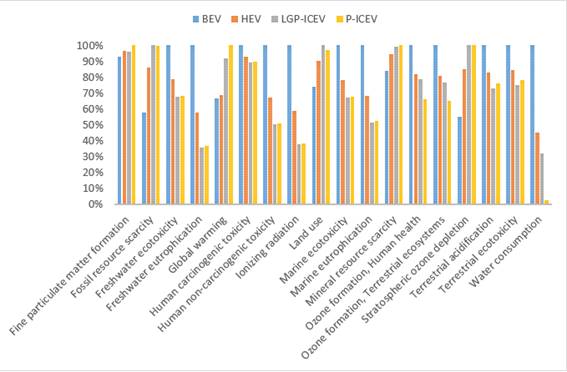
Fig. 2 - Life Cycle Impact Assessment results for 1 km trip on electric, hybrid and combustion engine vehicles.
From the results obtained in the impact evaluation, we can summarize that for each km traveled by an electric vehicle, it would be emitting 0.229 kg of equivalent CO2, while this indicator is 0.237 kg of equivalent CO2 for hybrids, 0.316 kg of CO2 equivalent for natural gas, and 0.345 kg of equivalent CO2 for gasoline. Leaving a mitigation threshold of 0.116 kg of equivalent CO2 for electric vehicles and 0.107 kg of equivalent CO2 for hybrids.
Comparing these results with the goals proposed by the government for the fulfillment of the sustainable development objectives, which amount to 0.072 MtCO2 eq, see table 1. In 2030, it is possible to develop an estimate of the number of vehicles needed to introduce to meet this goal. With an analogous method, but with the objective of being in an average position in the market shares of this type of car, an estimate has been developed that indicates 26% of the market share by 2030.
Table 1 - Projected electric and hybrid car sales scenarios.
| TOT Need | BEV-Need | HEV-Need | TOT Desirable | BEV-Desirable | HEV-Desirable | |
|---|---|---|---|---|---|---|
| 2021 | 288 | 16 | 272 | 288 | 20 | 268 |
| 2022 | 438 | 25 | 413 | 474 | 33 | 441 |
| 2023 | 666 | 38 | 628 | 807 | 56 | 750 |
| 2024 | 1012 | 58 | 955 | 1344 | 94 | 1250 |
| 2025 | 1539 | 88 | 1451 | 2269 | 159 | 2111 |
| 2026 | 2339 | 133 | 2205 | 3801 | 266 | 3535 |
| 2027 | 3555 | 202 | 3352 | 6398 | 448 | 5950 |
| 2028 | 5403 | 308 | 5095 | 10736 | 752 | 9985 |
| 2029 | 8213 | 468 | 7745 | 18051 | 1264 | 16788 |
| 2030 | 12483 | 711 | 11772 | 30310 | 2122 | 28189 |
According to the survey "Lima, how are we doing?" people in the capital of Peru feel dissatisfied with various conditions in the city. Regarding the noise in the streets, 55% are dissatisfied, while 49% are dissatisfied with the quality of the air. In addition, 61 and 65% are dissatisfied with traffic and transport safety, respectively. This situation can be verified if we analyze the air quality and noise indicators.
According to the National Institute of Statistics and Informatics (2015, 2019), all the air quality monitoring stations in Lima exceed the thresholds proposed by the World Health Organization WHO, highlighting the northern districts of Lima with the most critical values. With regard to road safety, a quantitative comparison cannot yet be established, but there are many studies that state that the introduction of technology into vehicles is capable of preventing road accidents (Rice, 2019).
Taking into account the modeled scenarios, the mitigation due to the introduction of hybrid and electric vehicles for 2030 in the Needed scenario is estimated at 0.05% for the emission of particles smaller than 2.5 micrometers and 2.01% for NO2; in the Desirable scenario they increase them to 0.12% and 4.77% respectively.
These results correspond to a population where only 13% use light vehicles for their transport in cities, most of them do so by buses (26%) and minibuses (19%), for which it is possible that the effect is higher if electromobility is studied in public transport. Objective that the present author has in a future article that is already in development.
Conclusions
In Peru there are efforts to generate policies that contribute to the mitigation of climate change, however they are not being effective in the introduction of electric and hybrid vehicles, at the moment this country is lagging behind in this matter, since it maintains a price policy where the purchase of vehicles in these categories is not encouraged. On the other hand, the measurement indicators and their desired performance thresholds have not been specifically established throughout the 2020-2030 period will not be able to have positive results until this situation is reversed.
For the commercialization of vehicles in the Peruvian territory, there are no test laboratories that guarantee that the emission standards given by the manufacturers have been met. In this sense, it would be very unlikely to see a case like the Volkswagen scandal (Merenda & Irwin, 2018) in Peru, since policies are based on the age of the cars but not on their characteristics, in this way it is not possible to import used cars older than 3 years old, despite the fact that they perform much better in terms of greenhouse gas emissions than those sold in the country.
Through the gradual incorporation of electric vehicles, it is possible to meet the CO2 emission mitigation quota in accordance with the sustainable development objectives. Although the scenario poses an ambitious goal, the benefits would be very favorable, since the use of electricity for mobility has a favorable effect in Peru due to the sources used for the generation of electricity. not counting the benefits to human health by mitigating emissions of particulate matter and nitrogen oxides.
According to the results obtained, the best option for a Peruvian user is a hybrid vehicle, since it has the lowest total cost of ownership, and the benefits of electric mobility are largely maintained. We must bear in mind that due to the excessive traffic in the cities, the average speeds in Peruvian cities are approximately 16 km per hour, having large periods of time to wait in traffic congestion, situations that in an electric vehicle such as a hybrid can be handled with great energy savings, unlike internal combustion engines that must remain on in these situations.

