


 Servicios personalizados
 Inglés (pdf)
 Articulo en XML
 Referencias del artículo
 Enviar articulo por email
 Citado por SciELO
  Similares en
SciELO
Similares en
SciELO 
 Permalink
Introduction
Colombia's agricultural potential presents a very promising context due to the great diversity of natural resources, biodiversity, land and climatic conditions that allow the development of the agricultural sector. Currently, this sector is showing economic growth in the immediate future, focusing on the production and commercialization of crops of different food products and the extraction of raw materials that respond, to a large extent, to the demand of the domestic market. In 2017, the agricultural sector contributed significantly to the Gross Domestic Product of Colombia as compared to other sectors of the country's economy, being the one with the highest percentage level of economic growth at 5.5% per year (Colombia. Departamento Administrativo Nacional de Estadística, 2019).
In this sense, the agricultural sector in Colombia is emerging as one of the most important in the country; according to Zuluaga (2018), if the country's geographical characteristics were taken advantage of with a serious and comprehensive policy and the recommendations of the United Nations and the Rural Mission were taken into account, Colombia could become a world power. Based on this viable growth of the agricultural sector, new market niches have been created for the export of Colombian agricultural products to different countries. This level of development has generated greater productivity in the rural population, thus raising the living standards of this population.
The current national context calls for an urging need to promote an investment process that guarantees responding to the demands of the consumers, through the creation of a solid technological and industrial infrastructure. Among the investment alternatives and strategies that can contribute to the development of the sector is the stock market. This has become an important means for companies to obtain resources and finance their investment projects. By 2017, the Colombian business fabric consisted of a total of 437,063 registered companies (Colombia. Departamento Administrativo Nacional de Estadística, 2019) of which only 0.015% of these business structures were listed on the Colombian Stock Exchange (BVC).
These figures evidence the low business participation in the BVC, which limits economic growth by restricting access to capital and financing opportunities, leaving traditional banking as the only option. The minimal participation of economic sectors in this field undermines the development prospects of the current Colombian scenario. To mitigate this situation and promote economic development, it is necessary to promote policies and strategies aimed at taking advantage of the qualities of each economic sector, understanding its characteristics, difficulties and relevance within the Colombian economy.
In this sense, it is vitally important for companies not only to focus on the domestic market, but also to have a holistic vision of their strengths and weaknesses in order to put forth alternatives for improving competitiveness, productivity and market positioning with the purpose of guaranteeing their durability over time. At the core of these alternatives are financial decisions, which consider the return and risk inherent in the investments undertaken by the companies. The fundamental aspect of financial decisions consists of the way the financial manager by selecting the best combination between risk and return to maximize expected profits (De la Oliva, 2016). For the quantification of these variables, financial models are used that logically integrate finance and financial procedures that make it possible to determine the risk-adjusted return of all assets.
There is a group of financial models available that allow assessing the risk-return relationship, facilitating a better efficiency in the financial decision-making process. Among the most widely used models is the Capital Asset Pricing Model (CAPM). This model allows valuing financial assets based on their return and risk, taking into account their correlation with the market portfolio and making use of stock market information. The CAPM was proposed and applied by a group of authors who formulated the theoretical bases of the model, among whom (Markowitz, 1952; Sharpe, 1963; Lintner, 1965) stand out; their contributions enriched the development and consolidation of the model. The emergence of the model starts from the portfolio diversification theory, based on the theoretical relationship between financial risk and return as a central axiom of efficient financial management (De la Oliva, 2016). From this emergence, the static and passive nature of finance is changed, giving rise to modern financial theory. The usefulness of the CAPM for companies and markets has been proven beyond doubt (Gómez, et al., 2012). Being a sufficiently accurate methodology for numerous applications, with great acceptance in the estimation of capital costs, it is considered an evolution of finance theory (De Sousa, 2013).
The CAPM allows determining the rate of return used to evaluate investment alternatives. It is a single-factor model through which beta coefficient can explain the differences between the risk-return factor of assets (Da Cunha & Veras, 2018). The risk-return relationship from financial theory is based on the theory of utility in terms of uncertainty (De la Oliva, 2016). Modern organizational management theory attributes a central role to the comprehensive management of the total risks faced by the institution. As part of these total risks are the financial risks, which are associated with obtaining a different result than expected.
Financial risks are the representation of the probability that the returns obtained from an investment will be different from the expected one. Regarding the quantification of risk, the author De la Oliva (2016) states that "the variance measures the dispersion around the measure, meaning that the higher its value, the more dispersed the observed returns (or considered in different probabilistic scenarios) will be around the expected result" (p. 25). The total risk of an asset can be decomposed into systematic and unsystematic risks (Kim & Su, 2018). Systematic and diversifiable risk in efficient investments will only recognize systematic risk in the link between risk and return, as it is the one that the investor cannot avoid, due to the fact that it is inherent to the market and is explained by its relationship with the market (De la Oliva, 2016). The non-diversifiable risk involves the part of the return variation that depends on a macro factor of an economy, therefore, this type of risk cannot be eliminated by diversification (Kim & Su, 2018). There are different specific classifications on systematic risks, among which are: economic, inflation, financial, interest, rating, foreign exchange, liquidity, reinvestment and country risk.
At the core of financial risk theory is the beta factor (β). This coefficient expresses the interdependence relationship between the returns of an asset "i" and those of the market portfolio (De la Oliva, 2016). In the financial asset valuation model the beta coefficient is used to represent the risk-return relationship. In which the higher the level of systematic risk (β) the higher the risk for the investors. The beta as a parameter can take values greater or less than 1, thus showing the sensitivity of the company to the market where it is located (Tamara, et al., 2017). These values show the relationship of the asset with the market through the following rules of behavior:
A beta greater than 1 tells us that the asset is aggressive, i.e. a variation in the market causes a greater variation in the asset. This is favorable when the market is in a growth stage but not when it is in a recession stage, that is why these assets have a higher systematic risk.
A Beta equal to 1 indicates that the asset is neutral, that is, a market variation causes the same variation in the asset.
A Beta of less than 1 indicates that the asset is not aggressive, i.e. a market variation causes a smaller variation in this asset. This indicates that these assets vary less than the market as a whole, therefore these assets have a lower systematic risk.
For the calculation of this coefficient, the market risk premium must be taken into account, which refers to the 'price of risk' (De Sousa, 2013). The risk premium represents the compensation that investors demand for asset price variation (Fassas & Papadamou, 2018). Representing the difference between the expected average return of risky assets available in the market and the risk-free investment return (Martinez, et al., 2014). The risk premium is the additional return required by an investor above the risk-free rate, as compensation for the risk assumed in the investment. Risk that in the CAPM model only corresponds to the systematic risk (Beta Coefficient) since the non-systematic risk or diversifiable risk can be reduced with the conformation of investment portfolios.
The compensation for the risk assumed is defined as return; in this sense, the higher the risk, the higher the compensation should be. The measurement of performance in companies is done by means of financial ratios analyzed with the use of company accounting information as a rule of thumb to understand the trade-off between risk and return.
The Return on Equity (ROE) is among the most widely used indicators is, which is defined as the ratio between the known or expected result, after interest, and the company's equity (Escribano & Jiménez, 2014). Return on equity measures the profit earned on the common shareholders' investment in the company (Gitman & Chad, 2012) showing the profits generated from the capital subscribed by the owners of the business. Another indicator used for profit measurement is Return on Assets (ROA) this indicator shows the capacity of the asset to produce profits regardless of how it has been financed (Anaya, 2018).
In an analysis carried out on the application of the model in different contexts, different application edges are evidenced. Taking as a starting point the research of Tamara, et al. (2017), a methodology on the calculation of beta is put forth. It analyzes three alternative methods of calculating the beta coefficient, taking as its basis of analysis companies listed on the Colombian Stock Exchange. The authors Bilinski & Lyssimachou (2014), analyze the use of the beta coefficient as a strong predictor of positive and negative returns, which can be used as a risk control in empirical tests. The research by Menéndez, et al. (2012), presents the relationship between the beta of the stock market of Spanish listed companies and and information as to efficiency and productivity indicators, accounting variables and macroeconomic environment indicators; all of which make it possible to substantiate the direct influence of the independent variables on the behavior of risk. The authors St-Pierre & Bahri (2006), verify the feasibility of using the accounting beta as a measure of risk, identifying the existence of intrinsic risk factors in the financial information used. Rotstein's research (2002) presents a comparative analysis between accounting beta and market beta, using a sample of 10 Argentinean companies listed on the stock exchange.
The research presented has its starting point on the minimal business participation in the stock market, which restricts the economic development of the SMEs by not having a tool that can be used for the identification of risk in non-listed companies. In this sense, a derivation of the CAPM model is proposed through the use of accounting information considering the financial reality of closed capital corporate structures. To this end, the use of ROE and ROA is proposed as the basis for calculating the beta coefficient to estimate the relative risk of accounting earnings and market behavior. Therefore, the objective is to use the accounting beta as a measure of systematic risk in the application of the CAPM in SMEs of the Colombian Agricultural Sector.
Materials and methods
This research was conducted following the quantitative approach because the data collected were processed through the application of a series of formulas that allow measuring the relationship between risk and return. The research design was non-experimental, for there was no manipulation of the information analyzed. For the development of the research, a procedure based on the following stages is proposed:
Stage 1, a search for information was carried out on the web page of the Superintendencia de Sociedades through the Integrated Corporate Information System. SEMs classified according to ISIC Code Group 012 Permanent agricultural crops of division 01 agriculture, livestock, hunting and related service activities of section A agriculture, livestock, hunting, forestry and fishing that reported financial information in 2017 were analyzed.
In stage 2, the segmentation of the information of Division 01 is carried out, using the data from Group 011: Permanent agricultural crops, which are distributed in the in the subcategories summarized in Table 1.
Table 1 - Summary of information for each subcategory.
| CIIU CODE | Name of the Subcategory | Companies |
|---|---|---|
| A0121 | Tropical and subtropical fruit crops | 23 |
| A0122 | Plantain and Banana crops | 41 |
| A0123 | Coffee crops | 18 |
| A0124 | Sugar cane crops | 86 |
| A0125 | Flower of Court crops | 51 |
| A0126 | Oil palm (African Palm) and other oleaginous fruit crops | 114 |
| A0127 | Crops of plants used for the production of beverages | 3 |
| A0128 | Spice, aromatic, and medicinal plants crops | 2 |
In stage 3, based on the identification of 338 companies in the selected subcategories, the ROE, ROA and accounting Beta indicators are calculated using financial information from the 2017 annual financial balance. Once the results are obtained, the CAPM model is applied.
As a starting point of the proposed sequence of calculations, the calculation of the Return on Equity is performed, as shown in equation 1 (Martínez, et al., 2014).
Equation 1. Return on equity
Once the Return on Equity has been calculated, we proceed to calculate the Return on Assets, by applying Equation 2 (Anaya, 2018).
Equation 2. Return on Assets
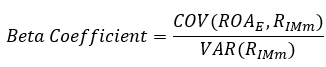
Once the ROE and ROA financial indicators have been calculated, the Beta coefficient is calculated. The calculation of the coefficient is represented by the covariance between the accounting returns of the company under analysis and the returns of the sector, divided by the variance of the sector's returns. This way of calculation is argued under the assumption that there is a significant correlation with the market portfolio returns, therefore, as this correlation exists the accounting beta tends towards the true beta of the company (Tamara, et al., 2017). With the above context as a reference, the calculation of the accounting beta is performed based on the Return on Equity using the method described in equation 3 (Rotstein, 2002).
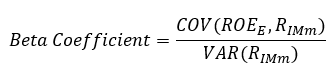
Equation 3. ROE-based Beta coefficient
Where:
ROA E : Represents the Return on Equity of the company.
RIMm: Represents the annual Return on Equity of the sample. Equation 4 (Rotstein, 2002) is applied to calculate the ROE of the sample.
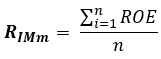
Equation 4. Accounting returns ROE of the sample.
For the calculation of the beta coefficient based on the Return on Assets, the calculation method detailed in Equation 5 (Rotstein, 2002) is applied.
Equation 5. ROA-based Beta coefficient
Where:
ROA E : Represents the Return on Assets of the company.
R IMm : Represents the Return on Assets of the sample, for its calculation equation 6 (Rotstein, 2002) is applied.

Equation 6. Annual Accounting returns ROE of the sample.
In order to measure the return generated by the companies that have been analyzed, the CAPM model is applied. Where the returns K e is equal to the risk-free rate, ( 𝑅 𝑓 ), plus the accounting beta coefficient β multiplied by the market risk premium, see equation 7.
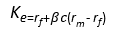
Equation 7. Capital Asset Pricing Model
Where:
|
Risk-free rate |
|
Expected rate of return of the market where the asset is listed |
|
Beta coefficient |


For the identification of the risk-free rate 𝐫 𝐟 , the interest rates of term deposit certificates (CDT) are used as a financial instrument. For the development of the research, the interest rate of the 360-day term CDTs issued by the Banco de la República de Colombia, calculated with information from the Superintendencia Financiera de Colombia, is used.
Results and discussion
Having analyzed the 338 companies under study, the results obtained from the ROE and ROA performance indicators for each subcategory of permanent agricultural crops are presented as shown in Figure 1.
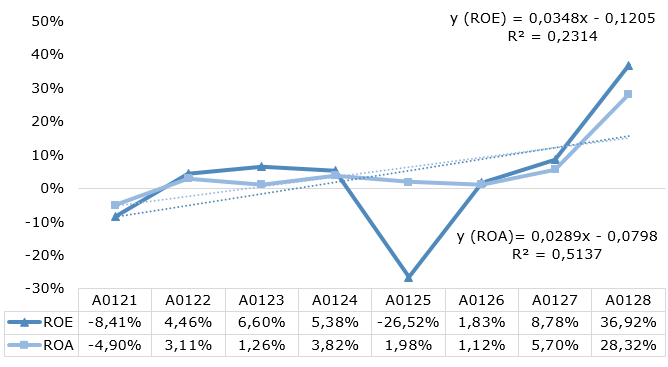
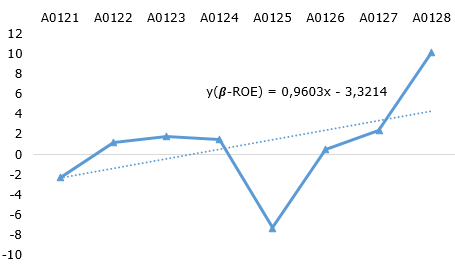
Fig. 1 shows the behavior of returns for the subcategories studied. By calculating the ROE and ROA indicators, the accounting betas of the sector can be calculated. In the case of the accounting betas calculated on the basis of the Return on Equity, see (Fig. 2). The 26.63% of the sector's betas present a negative result, 1.73% are in a range between 0.9 to 1.2, showing a movement proportional to the sector's reference index, while 71.60% are in a range of 1.2 and above. These results show a very disproportionate mobility, evidencing a higher risk in relation to the reference sector.
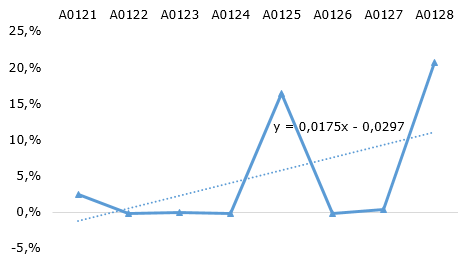
In the case of the accounting betas calculated based on the Return on Assets (Fig. 3). 27.81% of the sector betas present a negative result, 47.04% present a value between (0 and 0.9) evidencing a lower variability with reference to the sector index; while 6.21% are in a range between 0.9 and 1.2, showing a movement proportional to the sector reference index; 18.93% of the accounting betas are in a range of 1.2 onwards. These results show a very disproportionate mobility evidencing a higher risk in relation to the benchmark sector.
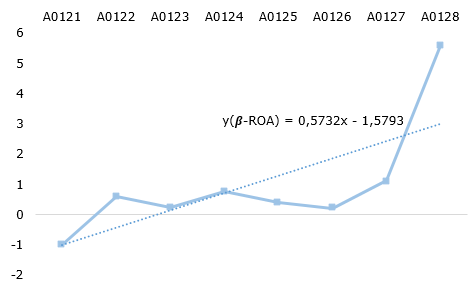
Fig. 2 and 3 show the result of the beta coefficient calculation based on the ROE and ROA financial indicators for each subcategory. The accounting betas of the sector present a very heterogeneous distribution, in an overall distribution of the results there is a significant dispersion of the results obtained. In the case of the categories with beta coefficient greater than 1, this result means that the companies in these subcategories react more aggressively to market movements, presenting a greater systematic or non-diversifiable risk. This context is beneficial when market circumstances and varying are favorable; the opposite happens when there are variables that hinder normal market operations and this reduces their returns, companies will react aggressively to this behavior and reflect a greater reduction in their returns. In the case of subcategories with an beta coefficient coefficient of less than 1, the companies in these subcategories are less aggressive and respond less to market variations, reducing systematic risk.
According to the behavior of the financial asset valuation model, companies' returns are valued taking into account their level of systematic risk or accounting beta coefficient. Regarding the results obtained from the application of the CAPM based on the Return on Assets for the subcategories of permanent agricultural crops, the result is shown in Fig. 4.
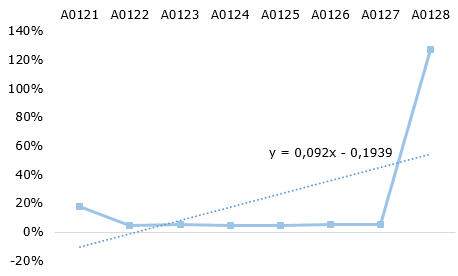
The results obtained show a positive CAPM for all the companies in this sector, according to the CAPM calculated with accounting beta based on ROA. This behavior shows that these companies have lower systematic risk and a financial viability that could satisfy the investor's expectations, as long as the market conditions guarantee the behavior of the yields to be stable or with a tendency to increase. The results obtained from the application of the CAPM based on the Return on Equity for the subcategories of permanent agricultural crops are shown in Fig. 5.
For the case of the CAPM results with ROE-based accounting beta, there is a dispersed behavior where positive CAPM results are evident for the subcategories (A0121, A0125, A0127, A0128); whereas subcategories (A0122, A0123, A0124, A0126) show negative CAPMs and an aggressive tendency to market movements, which puts these companies into a category of assets in which risk avoiders would not invest. Based on these results, we calculated the level of correlation between the financial indicators and the calculated CAPM, obtaining the following results summarized in Table 2.
Table 2 - Linear correlation coefficient.
| ROE | ROE-based CAPM | Correlation Coefficient | ROA | ROA-based CAPM | Correlation Coefficient |
| -8,41% | 2,38% | 0,158 | -4,90% | 18,06% | 0,916 |
| 4,46% | -0,19% | 3,11% | 4,51% | ||
| 6,60% | -0,02% | 1,26% | 5,39% | ||
| 5,38% | -0,14% | 3,82% | 4,54% | ||
| -26,52% | 16,44% | 1,98% | 4,89% | ||
| 1,83% | -0,17% | 1,12% | 5,51% | ||
| 8,78% | 0,33% | 5,70% | 5,56% | ||
| 36,92% | 20,74% | 28,32% | 127,62% |
Table 2 shows the correlation coefficients between the financial indicators and the CAPM. On the one hand, the correlation between the ROA indicator and the CAPM base ROA shows a high degree of association. However, there is a low degree of correlation between the CAPM base ROE and the ROE financial indicator.
Conclusions
Companies make decisions based on financial indicators, market analysis and other types of information, and do not take advantage of the qualities of CAPM as a viable source of information for assessing market performance and the risk inherent to capital.
The use of the accounting beta allows an accurate risk assessment of unlisted companies (there is a high percentage of these in Colombia) by focusing on the company’s intrinsic risk. This coefficient is very useful, for its calculation is based on available financial and accounting information, which makes it possible to identify the specific relationship between systematic risk and non-controllable variables. The application of the procedure proposed allows the calculation of the sector's return for closed capital companies, avoiding the theoretical and technical restrictions for determining the beta coefficient in emerging markets-being the Colombian market the case.
The analysis put forth in this paper can be instrumental in stimulating financial investment in the Colombian agricultural sector. It allows the investors to perform in a more up-to-date financial environment, which highlights the value of the accounting information that is obtained from the corporate structures.
The accounting information has qualities that can be used for a better financial analysis, thus allowing for better decision-making. This is only possible with the correct application of accounting standards, in order to obtain truthful and accurate information about the economic reality of the companies. The International Financial Reporting Standards (IFRS), in its regulatory framework, conceives that financial information should be treated under the following criteria:
Assets should be valued based on their current real market.
Assets should have the capacity to generate returns.
Assets should be classified into two categories: those that generate returns; and those that are for the company's internal use.
Inventories should be valued based on their price, less the cost of disposal.
Value financial instruments; recognize as deferred only those that fall into the definition of an asset.
Develop contingency plans and make provisions on the basis of possible adverse events.
Based on the above criteria, it has been corroborated that the accounting information can be used for the application of the CAPM method. The International Financial Reporting Standards application rules consider that the presentation of financial information does not rule out the time value of money.

