


 Servicios personalizados
 Inglés (pdf)
 Articulo en XML
 Referencias del artículo
 Enviar articulo por email
 Citado por SciELO
  Similares en
SciELO
Similares en
SciELO 
 Permalink
Introduction
The establishment of a payment system is crucial for a country’s political and economic infrastructure. It is one of the instruments in promoting the distribution of capital available and allows economic activities to be carried out. Therefore, it is of great importance for the financial stability and growth of a country to provide a payment system to promote the efficient movement of its funds.
According to the Malaysian Research Agency, Nielsen Survey, at the beginning of January 2019, only 8% of Malaysians used e-wallet in their daily payment transactions (Tan & Yee, 2019). Malaysian Communications and Multimedia Commission showed that the penetration of Malaysia smartphones rose from 68.7% in 2016 to 75.9% in 2017 (Malaysian Communications and Multimedia Commission, 2017), 78% in 2018 (Malaysian Communications and Multimedia Commission, 2018), and 91% in 2019 (Malaysian Communications and Multimedia Commission, 2019). Yet, the e-wallet services tend to be an unnecessary pit for both consumers and businesses. Seventy-four per cent of Malaysians are already knowledgeable about cashless payments to merchants and yet, they still prefer using credit cards or debit cards as these mechanisms offer discounts or cashbacks in their daily transactions (Malaysian Communications and Multimedia Commission, 2018). Such findings are consistent with the study from PWC Malaysia that stated the slow acceptance of e-wallets among consumers are due to low merchant adoption, security risk, as well as poor user interface (Ahmad & Ahmad, 2021).
The proceeding of 'e-Tunai Rakyat' incentive also drives an essential factor towards the embracing of e-wallets among businesses, especially the SMEs. Ian Ho, Shopee’s Regional Managing Director stated that the government and businesses would play a vital role in improving and incorporating digital payments to make them available to everyone and collaborate to achieve government goals (Nurul, 2020). The Chief Executive Officer of Boost, Mohd Khairil Abdullah said to Bernama News, apart from big brands, approximately, 60% of businesses from small and medium enterprises alike such as 'nasi lemak' vendors, night market hawkers, and food truck operators are ready to adopt this service. However, there is still the remaining 40% of small and medium businesses that still refuse to adopt it (Ahmad & Ahmad, 2019; Nurul, 2020).
This study aims to examine the factors that influence SMEs’ intention to adopt e-wallet services. The findings of this study provide understanding on the factors that influence the SMEs to adopt e-wallet services. This would assist the relevant parties such as the e-wallet providers in strategizing ways to promote and improve the use of e-wallet services among the SMEs. The remainder of this paper is structured as follows. The following section, Section 2, provides a review of relevant literature. Section 3 outlines the research framework whilst Section 4 explains the research design. The findings are presented in Section 5, and Section 6 concludes this paper.
The electronic wallet, also known as e-wallet in simple terms, is a type of electronic card that allows transactions to be made online by using a device (Karim, et al., 2020). The E-wallet can also be stated as a digital cashless services provider that is capable of easing the difficulties of coin and notes in the 21st century (Sharma, et al., 2020). E-wallet is also known as virtual cash or cashless services that replace the current physical cash (Nandhini, 2019). This cashless service can perform financial transactions using a mobile application (Jin, et al., 2020). In the services provider perspective, e-wallet is an electronic wallet that holds electronic money known as e-money. While for the merchant e-wallet services, this medium allows businesses to accept cashless payment from customer by using a static QR code scan (TnG Digital, 2020).
Studies in the literature have suggested many factors that may influence the adoption intention among users (Thu & Thidar, 2019). This study choses five factors to examine the adoption intention of e-wallet services among the SMEs. These factors are chosen based on the theory used in this study, which is the Diffusion of Innovation Theory. This theory can be seen as one of the most commonly used theories, which attempts to examine factors affecting the acceptance of innovation or new technology. Rogers (2003) described diffusion as acceptance of new technology “over time by the given social system”. It is resulting in the adoption or penetration of a new concept, behavioural of users, or physical innovation through processes of diffusion.
The first factor is relative advantages. Relative advantage is defined by Rogers (2003) as the extent to which the user is expected innovation is to be better than the idea it will supersede or replaced. Rogers (2003) also stated that relative advantages could be described as a user preparing to embrace new technology if they benefit from the technology as compared to an existing system. Other researchers supported and determined the relative advantages as the degree to which new technology is perceived as being better than its predecessor and it is economically profitable (Thu & Thidar, 2019).
The second factor is compatibility. Rogers (2003) defined compatibility as “the degree to which the technology is consistent with the current values, past experiences, and fulfil the needs of potential users”. Compatibility refers to the quality level between the newly manufactured product or services and the desires or needs of the consumer, standard expectations, dominating market, and the experience of the customer. According to Rogers (2003), compatibility is a key aspect of innovation as it can facilitate rapid adoption in line with the lifestyle of the adopter and potential adopter. The development of new technology must be consistent with the current environment and lifestyle to increase the adoption intention of it.
The third factor is complexity. Complexity can be described as the degree of a user’s belief that an innovation is difficult to understand and/or use (Rogers, 2003). In definition, the complexity of many studies is similar with prior studies (such as Thu & Thidar, 2019; LaMorte & Wayne, 2019).
The next factor is triability. Rogers (2003) defined trialability as “the ability to trying new technologies before implementing it”. Before investing money to the new technology, potential users tend to have a trial product as a demo or trial period to ensure it can benefit them in the future. Possible adopters who can try an idea will feel confident with it and will more likely adopt it in their current lifestyle (Rogers, 2003). In another point, it refers to the degree of the testing process to the new technology without the implementation of it (Rogers, 2003). This is supported by other studies that also define trialability as an extent of an invention that may be tested for a short time before its eventual adoption or rejection (Thu & Thidar, 2019). While other researchers define trialability as the degree to which an invention can be tested before adoption (Ahmad & Sahar, 2019).
The last factor is observability. Observability can be described as “the extent to which people think good results of new technology are visible to be seen by others” (Rogers, 2003). The good results shown by others will reduce the uncertainty of new adopters and motivate them to use the new technology in their own organisation. The visible aspect from observability could encourage others to see the benefit of e-wallet services especially to business peers, neighbours, as well as close friends to adopt and learn more about e-wallet services. Technological concepts are much of the advances explored in previous studies into diffusion on observability. Observability can also be defined as the level or degree to which an innovation results in communication, interpreted and connected on new ideas (Ilias, et al., 2019).
Materials and methods
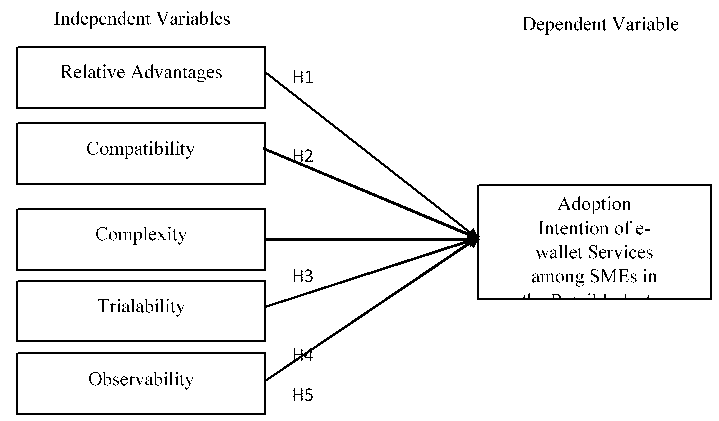
Fig. 1 depicts the proposed research framework for this study. This framework shows five factors that are relative advantages, compatibility, complexity, trialability, and observability as the independent variables whilst the adoption intention of e-wallet services among the SMEs is the dependent variable.
There are numerous studies directly examining the factor influencing adoption intention of e-wallet (Thu & Thidar, 2019). However, most of these studies tend to focus on the factor’s adoption among consumers rather than retailers.
The following hypothesis
Is proposed:
Hypothesis 1: Relative advantage significantly influences the adoption intention of e-wallet services among SMEs in the retail industry.
Hence, if the users realize that the e-wallet services are compatible with their current lifestyle and of the organisation and consumer needs, they might not refrain from using it. Therefore, the following hypothesis is proposed:
Hypothesis 2: Compatibility significantly influences the adoption intention of e-wallet services among SMEs in the retail industry.
The difficulties to understand how to use the innovation will also affect the level of adoption. When you plan to make cashless transactions or digital transactions, you can use e-wallet as an option (Machindra, 2019). If users presume that e-wallet services are complex to use, they might refrain from using it. Hence, the following hypothesis is proposed:
Hypothesis 3: Complexity significantly influences the adoption intention of e-wallet services among SMEs in the retail industry.
The early adopter of innovation normally needs a trial period to ensure the outcome will give an impact to their organisation within a trial period. Hence, the following hypothesis is proposed:
Hypothesis 4: Trialability significantly influences the adoption intention of e-wallet services among SMEs in the retail industry.
The concept of observability in the diffusion of innovation has a similar concept to the social influence in the Unified Theory of Acceptance and Use of Technology. To conclude, users tend to adopt new technology if there are encouragements and benefits of the technology in the current or future time. Therefore, the following hypothesis is proposed:
Hypothesis 5: Observability significantly influences the adoption intention of e-wallet services among SMEs in the retail industry.
The SMEs in the retail industry were selected as the sample in this study due to its highest number of the growth of GDP in the services industry in 2019 was accelerated by retail trade, food and beverage, wholesales as well as accommodation subsector (Mahidin, 2020). E-wallet transactions normally involve a small number of transactions per trade. However, although there has been a lot of research on consumer adoption and usage of e-wallet systems, there is still a lack of research on the retail's perspective (Mei, et al., 2020).
The questionnaire has three sections. Section A requests the respondents to complete their demographic profile such as position in the organisation, gender, race, age, highest education level, annual sales turnover, number of full-time employees, type of business, age of business, and level of e-wallet services adoption as well as the type of e-wallet application used. Section B relates to the independent variables namely, relative advantages, compatibility, complexity, triability and observability. This section requests the respondents to complete the questions based on a 5-point scale. The last section, Section C requests the respondents to provide their intention to adopt e-wallet services. The respondents are required to response based on a 5-point scale.
The questionnaire was printed out and distributed to the nearest SMEs retailers. The questionnaire was also transferred via an online medium, which is Google Form to make it easier to be distributed throughout online platforms such as email, WhatsApp, and other social media applications such as Instagram, Facebook, and Twitter. Due to the outbreak of Pandemic Covid-19 during the study held in the research area, which is Selangor, online questionnaires were the most suitable tool to limit personal interaction with the respondents. Overall, 786 questionnaires were distributed to potential respondents through hardcopy, email, static QR code scan, WhatsApp, Facebook Messenger, Instagram, and Twitter Direct Message.
Data collection activity was carried out over a period of one month starting with the hardcopy of the questionnaire distributed to the nearest retailers. In the second week, 38 respondents responded to the Google Form Questionnaire. A second email, as well as a reminder through online mediums, were sent to potential respondents who have not responded to answer the survey. By the third week, another 79 respondents responded to the Google Form Questionnaire. During the third week, another email and reminder have been blasted through the online platforms asking them to answer the survey. In the last week of the month, another 83 responded to the Google Form Questionnaire. There is no other reminder given to the potential respondents who did not answer the questionnaire. Thus, in total, the response received is 200. However, out of 200 responses received, 25 are excluded from this study because the respondents do not have the intention to use e-wallet services thus, making 175 useful responses over the needed sample, yielding the response rate of 46%.
Results and discussions
Table 1 indicates the sales turnover and the number of full-time employees in the organisation that determine the business size whether the business is micro, small, or medium-sized enterprises according to the definition of SMEs in Malaysia. When an organisation meets one requirement for each of the various operating sizes, a smaller size will apply. For example, if the turnover of enterprises falls into a small size enterprise, but the employment falls into medium-sized enterprises, the business will be deemed as a small-sized enterprise.
Table 1 Business Size.
| Demographic Profile | Frequency | Percent (%) | |
|---|---|---|---|
| (N=175) | 100% | ||
| Sales Turnover | < RM 300,000 | 108 | 61.7 |
| RM 300,000 to < RM 3 million | 57 | 32.6 | |
| RM 3 million to ≤ RM 20 million | 10 | 5.7 | |
| No. of Full Time Employee | < 5 people | 64 | 36.6 |
| 5 < 30 people | 89 | 50.9 | |
| 30 ≤ 75 people | 22 | 12.6 | |
| Business Size | Micro Enterprises | 114 | 65.1 |
| Small Sized Enterprises | 59 | 33.7 | |
| Medium-Sized Enterprises | 2 | 1.1 | |
The data analysis shows that out of 175 respondents, 61.7% of them meet the requirement of micro-enterprises with sales turnover less than RM 300,000 per year. Followed by 32.6% of respondents with sales turnover from RM300,000 to less than RM 3 million sales turnover per year and 5.7% respondents with sales turnover from RM3 million to not exceeding 20 million per year which are the requirement of small and medium-sized enterprises, respectively. While for full-time employees, 49.7% of business fulfilled the requirement of small-sized enterprises with the number of full-time employees from 5 to less than 30, followed by 36.6% of business with less than 5 full-time employees, and 12.6% business with the number of full-time employees from 30 to not exceeding 75 in which they meet the requirement of micro and medium-sized enterprises, respectively.
Therefore, based on the annual sales turnover and the number of full-time employee’s data analysis, business sizes were determined. According to SME Corp Malaysia, a smaller size will apply when businesses meet the requirement for SMEs definition. Out of 175 respondents, 65.1% are from micro-enterprises, followed by 33.7% from small-sized enterprises, and 1.1% balance from medium-sized enterprises. This distribution suggests that retails’ SMEs in Malaysia are dominated by microenterprises businesses.
Table 2 shows that majority of respondents established in retails industry are within 3 to 5 years with 28% out of the 175 samples in this study, followed by 21.7% with the seniors in the retails market with their business established for more than 14 years old. 20.6% of the respondents from the newbie group are 0 to 2 years old of business age and the balance 29.7% from two groups of age that are 6 to 9 years old and10 to 14 years old.
Table 2 - Business Age.
| Demographic Profile | Frequency | Percent (%) | |
|---|---|---|---|
| (N=175) | 100% | ||
| Age of Business | 0-2 years old | 36 | 20.6 |
| 3-5 years old | 49 | 28.0 | |
| 6-9 years old | 25 | 14.3 | |
| 10-14 years old | 27 | 15.4 | |
| >14 years old | 38 | 21.7 | |
According to the Ministry of Domestic Trade and Consumer Affairs (MDTCA), there are a few categories of retailers in Malaysia. Table 3 shows the respondents’ retail category out of the 175 respondents. Majority of them are from food and beverage (F & B) category including restaurant, food truck operators, and small food stalls with 30.3%. Followed by services retailer category with 24.6% of respondents. Services retailers refer to whose product line is actually a service. A physical product could be involved in services retailing, but the services offered are more important to the consumer such as car washing, pest control, repair services, hair salons, tailor, laundry services, dry cleaners, etc. Meanwhile, there are 14.3% of respondents from boutique and accessories stores, 10.9% respondents from convenience stores, groceries stores, and mini marts. Market vendors, which include pasar tani vendors, daily market, and night market traders, are 5.7%. Lastly, hardware and equipment shop as well as motor vehicle workshop account to 4 %, and 1.7% respectively.
Table 3 - Retail Category.
| Demographic Profile | Frequency | Percent (%) | |
|---|---|---|---|
| (N=175) | 100% | ||
| Retail Category | Food and Beverage / Restaurant | 53 | 30.3 |
| Services Retailer | 43 | 24.6 | |
| Boutique and Accessories Stores | 25 | 14.3 | |
| Convenience Store / Mini Mart | 19 | 10.9 | |
| Pharmacy / Personal Care | 15 | 8.6 | |
| Market Vendor | 10 | 5.7 | |
| Hardware and Equipment Shop | 7 | 4.0 | |
| Motor Vehicle Workshop | 3 | 1.7 | |
Out of 200 actuals of respondents, 25 respondents do not have the intention to adopt e-wallet services for their business. Therefore, Table 4 shows the balance of 175 respondents who already adopt an e-wallet serve and have an intention to adopt it in near future for their business. 137 of respondents distributes already adopted e-wallet services for their business with few types of applications while others 38 of respondents plan to adopt this payment services in near future. Next table shows the e-wallet services application that used by 137 respondents who already adopted e-wallet for their business.
Table 4 - Level of Adoption E-wallet services.
| Demographic Profile | Frequency | Percent (%) | |
|---|---|---|---|
| (N=175) | 100% | ||
| Level of Adoption | Already adopted e-wallet. | 137 | 78.3 |
| Will adopt e-wallet near future. | 38 | 21.7 | |
Table 5 shows that the e-wallet services applications were adopted by 137 of respondents in their businesses. Majority of the respondents use Touch ‘n Go eWallet with 83.9% of respondents. There are many marketing strategies and updated features form TNG Digital to retain and gain new retailers to register as their merchant. There are 150,000 retailers already registered as merchants of Touch ‘n Go eWallet. Subsequently, Maybank QRPayBiz with 67.9% of respondents records second highest of users out of 137 respondents. Maybank offered their new features of banking services to their existing customers and non-Maybank account holders. Users could use two types of e-wallet applications which MaybankQRPay for existing customers and MAE Apps for both existing customers and non-Maybank account holders. While 39.4% of respondents used Boost eWallet and 19% used GrabPay Wallet at their checkout counter. There are also a few e-wallet services such as BigPay, FavePay, TApay, AliPay, and ShopeePay that are used by the respondents but with a lower percentage of adoption, which is below than 10%.
Table 5 E-wallet services Application.
| Demographic Profile | Frequency | Percent (%) | |
|---|---|---|---|
| (N=137) | 100% | ||
| Touch 'n Go eWallet | Yes | 115 | 83.9 |
| No | 22 | 16.1 | |
| Maybank QRPayBiz | Yes | 93 | 67.9 |
| No | 44 | 32.1 | |
| Boost eWallet | Yes | 54 | 39.4 |
| No | 83 | 60.6 | |
| GrabPay Wallet | Yes | 26 | 19.0 |
| No | 111 | 81.0 | |
| BigPay | Yes | 13 | 9.5 |
| No | 124 | 90.5 | |
| FavePay | Yes | 8 | 5.8 |
| No | 129 | 94.2 | |
| TApay | Yes | 2 | 1.5 |
| No | 135 | 98.5 | |
| AliPay | Yes | 2 | 1.5 |
| No | 135 | 98.5 | |
| ShopeePay | Yes | 2 | 1.5 |
| No | 135 | 98.5 | |
Table 6 illustrates the descriptive statistics for respondents’ relative advantages. Based on the individual statements, the highest mean is RA1 and RA2 (M=4.43) which represent the majority of respondents agreed that e-wallet services are convenient for organisations in managing financial transactions and it enables the users to accomplish organisation tasks much quicker. Followed by RA4 (M=4.39) that represents how the respondents agreed that e-wallet services improve their business operation quality. Respondents also agreed that e-wallet services can improve worker productivity (M=4.29). The overall mean proves that the respondents believed that e-wallet services are useful for managing the organisation (M=4.42). Therefore, based on the definition of relative advantages, the respondents believed that e-wallet services give better benefits to an organisation such as in improving quality of works, the productivity of workers, as well as to increase the quality of business operation, and it is better than the current system that extinguishes the hassle of cash transactions.
Table 6 Central Tendency Score for Relative Advantages.
| Items | Statements | Mean | Std. Deviation |
| RA1 | E-wallet services are a convenient way for the organisation to manage financial transactions. | 4.43 | .731 |
| RA2 | E-wallet services enable me to accomplish organisation tasks much quicker. | 4.43 | .723 |
| RA3 | E-wallet services improve workers’ productivity. | 4.29 | .823 |
| RA4 | E-wallet services improve the quality of business operation. | 4.39 | .718 |
| RA5 | Overall, e-wallet services are useful for managing the organisation. | 4.42 | .730 |
Table 7 depicts the descriptive statistics for the respondent’s compatibility beliefs. Based on the individual statements, the highest mean is COM2 (M=4.58) which represents that the majority of respondents agreed that e-wallet services are compatible with their current lifestyle. Meanwhile, the respondents also agreed with the statements of COM4 (M=4.43) that states e-wallet services are compatible with business operation and customer needs. Both statements show that nowadays e-wallet services are trending in the payment services market in Malaysia. Followed by statements from COM4 (M=4.33) which stated that these new payment services are suitable with how they are managing the organisation’s finance transaction. Respondents also agreed that e-wallet services are compatible with their existing devices used by organisations such as the smartphone and Tablet (M=4.31). It indicates that the respondents agreed that e-wallet services are compatible with their current device, up-to-date lifestyle, customer needs, as well as it fits with the way they manage their finances in their organisation.
Table 7 Central Tendency Score for Compatibility.
| Items | Statements | Mean | Std. Deviation |
|---|---|---|---|
| COM1 | E-wallet services are compatible with existing devices used by the organisation. | 4.31 | .808 |
| COM2 | E-wallet services are compatible with the current lifestyle. | 4.58 | .664 |
| COM3 | E-wallet services are compatible with business operation and customer needs. | 4.43 | .776 |
| COM4 | E-wallet services fit well with the way I like to manage organisation finances. | 4.33 | .846 |
| COM5 | Overall, using e-wallet services fit into the organisation management style. | 4.38 | .762 |
Table 8 presents the descriptive statistics for the respondent’s complexity. Those statements under complexity are in reverse measurement as compared to other variables where the lowest represent the agreement of statement and five represents the disagreement. According to the individual statements, CPX4 and CPX3 are of moderate levels of mean, showing the respondent’s disagreement with the statements that e-wallet services are difficult to be skilful at (M=3.03) and are difficult to understand (M=2.90). Meanwhile, CPX1 and CPX2, show lower numbers of mean and the level of disagreement on both statements that e-wallet services require a lot of mental effort (M=2.41) and technical skill in order to use it (M=2.27). Therefore, the overall statements show the respondents disagreed with the statements of e-wallet services is complex to use (M=3.15).
Table 8 Central Tendency Score for Complexity.
| Items | Statements | Mean | Std. Deviation |
| CPX1 | Interaction with e-wallet services requires a lot of mental effort. | 2.41 | 1.20 |
| CPX2 | Interaction with e-wallet services requires technical skills. | 2.27 | 1.27 |
| CPX3 | Learning e-wallet services is difficult to understand. | 2.90 | 1.06 |
| CPX4 | I find it is difficult to be skilful at using the e-wallet services application. | 3.03 | 1.01 |
| CPX5 | Overall, e-wallet services are complex to use. | 3.15 | 1.00 |
Table 9 presents the descriptive statistics for respondents’ trialability beliefs. Found on the individual statements, the highest mean is TRI4 (M=4.31) which represents the majority of respondents agreed that promotion period from services provider enables them to use e-wallet services for free within a certain period without incurring any costs. Subsequently, by a near mean score, TRI2 (M=4.30) represents the statements of respondents agreeing that they would like to use e-wallet services on a trial basis to see the improvement to their business. The respondents also agreed with statements from TRI1 (M=4,21) and TRI4 (M=4.26) where it is stated that respondents would like to try e-wallet services at least for one month and have the adequate opportunity to try it before adopting this system to their organisation. It shows that respondents would like to try the e-wallet services for at least one month in trial basis as well as the promotional period to give them adequate opportunity to this service before adopting it to their organisation.
Table 9 Central Tendency Score for Trialability.
| Items | Statements | Mean | Std. Deviation |
| TRI1 | I want to try e-wallet services for my business for at least one month. | 4.21 | 0.926 |
| TRI2 | I want to use e-wallet services on a trial basis to see what it can do for my business. | 4.30 | 0.887 |
| TRI3 | I do have adequate opportunity to try the e-wallet services for my business. | 4.26 | 0.871 |
| TRI4 | Promotion period enables me to use e-wallet services for free within a certain period of time without incurring any costs. | 4.31 | 0.808 |
| TRI5 | Overall, it is better to try the e-wallet services before adopting it in the organisation. | 4.42 | 0.753 |
Table 10 illustrates the descriptive statistics for respondents’ observability beliefs. Based on individual statements, the mean score for each item ranges from 4.49 to 4.55 which show the highest mean on OBS1 (M=4.55). OBS1 represents the statement of them seeing other businesses using e-wallet services for buying and selling transaction. While OBS2 stated that the respondents agreed that they observe people making payments by using e-wallet services (M=4.53). Followed by OBS3 of the respondents could see the transaction immediately after payment is done by customers (M=4.51) as well as OBS4 that stated they believed that being seen as a user of e-wallet services is a good image to the organisation (M=4.49).
Mean score for overall shows that respondents believed that they see the benefit to use e-wallet services from others (M=4.51). It shows the highest mean score from the overall results of each variable. Therefore, based on the observability, the respondents believed that they are seeing advantages and benefits of using this new technology from other people on sales and purchase transaction, its immediate effect, as well as feeling good being one of the businesses that use e-wallet services.
Table 10 Central Tendency Score for Observability.
| Items | Statements | Mean | Std. Deviation |
|---|---|---|---|
| OBS1 | I observe other business using e-wallet services for buying and selling transactions. | 4.55 | 0.692 |
| OBS2 | I observe people making payments by using e-wallet services. | 4.53 | 0.668 |
| OBS3 | By using e-wallet services, I can see the effect of a payment transaction immediately. | 4.51 | 0.726 |
| OBS4 | Being seen as a user of e-wallet services is a good image for the organisation. | 4.49 | 0.787 |
| OBS5 | Overall, I see the benefit of using e-wallet services from others. | 4.51 | 0.749 |
Table 11 depicts the descriptive statistics for the adoption intention of e-wallet services among retailers. Those statements are designed under the dependent variable. According to individual statements, the value of the mean for each item ranges from 3.97 to 4.35. The respondents appear to mostly agree with the statement that they think is a correct decision to use e-wallet services in their organisation labelled AIE4 (M=4.35). Followed by AIE2 stating they will continue to use e-wallet services if they have already adopted it in the organisation which shows the continuity of using the technology (M=4.32). The respondents also stated that they preferred to use the innovation of the payment system as compared to the traditional system on AIE1 (M=4.21). Meanwhile, for the respondents who are willing to adopt the e-wallet services to their business soon, they have agreed with this statement under AIE3 (M=3.97). Overall, the respondents agreed to recommend using e-wallet system in the business organisation (M=4.49).
Table 11 Central Tendency Score for Adoption Intention of E-wallet Services.
| Items | Statements | Mean | Std. Deviation |
| AIE1 | I prefer to use e-wallet services as compared to the traditional system. | 4.21 | 0.968 |
| AIE2 | If I have used e-wallet services, then I will continue to use them. | 4.32 | 0.865 |
| AIE3 | It is anticipated that my organisation will adopt e-wallet services soon. | 3.97 | 1.022 |
| AIE4 | I think that I made the correct decision to use e-wallet services in the organisation. | 4.35 | 0.910 |
| AIE5 | Overall, it is recommended to use the e-wallet system in the organisation. | 4.49 | 0.801 |
Table 12 shows the correlation results between five factors and the retailers’ adoption intention of e-wallet services. Based on the data analysis, there was a significant positive moderate relationship between relative advantages and the adoption intention of e-wallet services labelled as r = 0.672, (p <0.001). Hence, if there is increasing relative advantages, there will be a moderate increase in the adoption intention of e-wallet services and vice versa.
Subsequently, the results of the correlation analysis between compatibility and the adoption intention of e-wallet services also show a significant positive moderate relationship between them labelled as r = 0.682, (p <0.001). When there is an increase in compatibility, it is associated with a moderate increase in the adoption intention of e-wallet services and contrariwise. However, the result of the complexity shows that there is a significant negative relationship between complexity and the adoption intention of e-wallet services as r = -0.376, (p <0.001). The data correlation for complexity was run using the original data without decoding it to see the original direction of the data. Thus, increasing in complexity is associated with little decrease in the adoption intention of e-wallet services and vice versa.
Meanwhile, for the fourth independent variable, which is trialability, a significant positive low relationship with the adoption intention of e-wallet services was seen labelled as r = 0.466 (p <0.001). Therefore, if there is an increase in trialability, it will have a low increase in the adoption intention of e-wallet services. Last but not least is the last independent variable, where a significant positive high relationship between the observability and the adoption intention of e-wallet services is seen and labelled as r = 0.713, (p <0.001). Hence, an increase in observability is associated with a strong increase in the adoption intention of e-wallet services and vice versa.
Table 12 The Pearson Correlation Matrix.
| AE | RA | COM | CPX | TRI | OBS | ||
|---|---|---|---|---|---|---|---|
| AIE | Pearson Correlation | 1 | |||||
| Sig. (2-tailed) | |||||||
| RA | Pearson Correlation | .672** | 1 | ||||
| Sig. (2-tailed) | .000 | ||||||
| COM | Pearson Correlation | .682** | .841** | 1 | |||
| Sig. (2-tailed) | .000 | .000 | |||||
| CPX | Pearson Correlation | -.376** | -.362** | -.397** | 1 | ||
| Sig. (2-tailed) | .000 | .000 | .000 | ||||
| TRI | Pearson Correlation | .466** | .256** | .291** | .192* | 1 | |
| Sig. (2-tailed) | .000 | 0.001 | .000 | 0.011 | |||
| OBS | Pearson Correlation | .713** | .665** | .679** | .394** | .451** | 1 |
| Sig. (2-tailed) | .000 | .000 | .000 | .000 | .000 |
**. Correlation is significant at the 0.01 level (2-tailed).
*. Correlation is significant at the 0.05 level (2-tailed).
AIE: (Adoption Intention of E-wallet Services); RA: (Relative Advantages); COM: (Compatibility); CPX: (Complexity); TRI: (Trialability); OBS: (Observability)
Table 13 shows the R-square (r 2 ) value for this research model, r 2 = 0.625 of the five independent variables, which explains approximately 62.5% of the total variation in the dependent variable. This determined that 62.5% of the variation in the adoption intention of e-wallet services among retailers was caused by the variation in relative advantages, compatibility, complexity, trialability, and observability. Meanwhile, the remaining 37.5% of the changes were affected by other factors that were not involved in this study. Overall, the model is thus considered a moderate level since r 2 = 0.625 (0.5<r 2 <0.7).
Table 13 Summary Statistics of the R2 of The Multiple Regression Model.
| Model | R | R Square | Adjusted R Square | Std. Error of the Estimate |
|---|---|---|---|---|
| 1 | .791a | .625 | .614 | .46033 |
a. Predictors: (Constant), Relative Advantages, Compatibility, Complexity, Trialability and Observability.
Table 14 sets out the F-value for this study. The results of F-test indicate whether there is a linear relationship between the independent variables with the dependent variable. Based on the F-Distribution Table, F-critical = F (5,169) = 2.21, while Table 14 indicated that F-observed = 56.407. Therefore, this indicates that there is a significant linear relationship between the dependent variable and at least one of the five independent variables since the F-observed> F-critical, F (5,169) = 56.407, (p-value <0.001). In other words, at least one of the independent variables, either relative advantages, compatibility, complexity, trialability, or observability affects retailers’ adoption intention of e-wallet services. Hence, this result proves that the research model is pertinent to this study.
Table 14 Summary Statistics of the ANOVA.
| Model | Sum of Squares | df | Mean Square | F | Sig. | |
|---|---|---|---|---|---|---|
| 1 | Regression | 59.765 | 5 | 11.953 | 56.407 | .000b |
| Residual | 35.812 | 169 | .212 | |||
| Total | 95.577 | 174 |
a. Dependent Variable: Adoption Intention of E-wallet Services
b. Predictors: (Constant), Relative Advantages, Compatibility, Complexity, Trialability and Observability.
Table 15 describes the significance of the relationship between the independent variables with the dependent variable. The p-value for relative advantages, compatibility, trialability, and observability was less than 0.05, which indicates that those independent variables significantly influenced the adoption intention of e-wallet services among SMEs in the retail industry. However, the relationship between complexity with the adoption intention of e-wallet services was insignificant since the p-value was 0.319 which is greater than 0.05.
Table 15 Summary Statistics of Multiple Regression Result.
| Unstandardized Coefficients | Standardized Coefficients | |||||
|---|---|---|---|---|---|---|
| Model | B | Std. Error | Beta | T | Sig. | |
| 1 | (Constant) | -.680 | .304 | -2.235 | .027 | |
| Relative Advantages | .247 | .100 | .222 | 2.474 | .014 | |
| Compatibility | .223 | .102 | .200 | 2.178 | .031 | |
| Complexity | -.042 | -.042 | -.052 | -1.000 | .319 | |
| Trialability | .220 | .059 | .197 | 3.714 | .000** | |
| Observability | .393 | .088 | .321 | 4.464 | .000** | |
a. Dependent Variable: Adoption Intention of E-wallet Services
**. Correlation is significant at the 0.01 level (2-tailed). *. Correlation is significant at the 0.05 level (2-tailed).
Therefore, the study on the adoption intention of e-wallet services among retailers is estimated according to the following formula:

Where:
AIE: |
Adoption Intention of E-wallet Services |
RA: |
Relative Advantages |
COM: |
Compatibility |
CPX: |
Complexity |
TRI: |
Trialability |
OBS: |
Observability |
Given the results, out that out of the five independent variables tested, four of them had a significant influence on the dependent variable. The multiple regression for the adoption intention of e-wallet services among SMEs in the retail industry demonstrated each independent variable namely relative advantages (β1=0.247, t=2.474, p-value is 0.014; p <0.05), compatibility (β2=0.223, t=2.178, p-value is 0.031; p <0.05), trialability (β4=0.220, t=3.714, p < .001), and observability (β5=0.393, t=4.464, p < .001) positively and significantly influenced the adoption intention of e-wallet services among SMEs in the retail industry. This denotes that most retailers do believe in innovation concerning its positive impact in relative advantages, compatibility, trialability, as well as observability and would ultimately increase the retailer’s adoption intention of e-wallet services for their business. In contrast, the data analysis signifies that complexity had no significant relationship with the dependent variable (β3= -.042, t=-1.000, p=.319). This shows that even though e-wallet services need a lot of mental effort and are difficult to understand, they are willing to learn and accept its challenges because they would reap benefits from using it. Therefore, complexity does not significantly affect the adoption intention of e-wallet services. Consequently, the data analysis then proves that the results accept the hypotheses for relative advantages, compatibility, trialability, as well as observability.
Conclusions
The main objective of the study is to examine the key factors influencing the adoption intention of e-wallet services among Malaysian SMEs in the retail industry. The results of this study show that relative advantages, compatibility, trialability, and observability significantly influence the adoption intention of e-wallet services among retailers. On the other hand, the complexity factor has an insignificant impact on the adoption intention. The findings of this study report similar findings to previous studies.
The findings in this study provide valuable supporting evidence to the factors that influence adoption intention of e-wallet services among businesses, therefore contributing to the technology field literature in Malaysia that is still proportionately lacking in evidence compared to the studies carried out in the context of customer behavioural intention, other cashless instruments, and the study of digital wallet from other countries.
This study also contributes to the Diffusion of Innovation Theory literature to explore decision-making and people’s behaviour using the five perceive characteristic of innovation. Furthermore, this study could offer financial institutions and application developers a deeper understanding on the internal and external factors that affect the adoption of e-wallet among adopters especially the business society and improve their market region and implementation of e-wallet successfully in Malaysia. This study could inspire the government to encourage Malaysians to become a more cashless society in future years. More initiative and programs could be planned by the Malaysian government in promoting digitalised payment.

