


 Servicios personalizados
 Inglés (pdf)
 Articulo en XML
 Referencias del artículo
 Enviar articulo por email
 Citado por SciELO
  Similares en
SciELO
Similares en
SciELO 
 Permalink
Introducción
Solar photovoltaic technology is one of the renewable energy options that can currently help decarbonize the world by mitigating greenhouse gases (Agyekum, 2022). According to Malvoni et al., (2017) it is a trend the decrease in the cost of solar photovoltaic systems, in addition to the role that governments are exercising to promote these technologies. There are numerous studies to evaluate the performance of solar PV plants in several countries.
The efficiency of a Photovoltaic Solar System (FVSS) is highly dependent on the meteorological conditions of its environment (Junaidh et al., 2017). Therefore, it is essential to study among other factors, the performance of the solar PV system before installation. There are ways to evaluate the performance, and they are by simulation using energy modeling or numerical modeling tools, or by studying the site parameters using experimental models. (Rajput, 2020) (Malvoni et al., 2017) (Ramanan et al.,2020) generally expose as results in the assembly of these systems a performance ratio higher than 77%. Among the most widespread installation options are above ground and on ceilings. Behura (2021) presents the trends for the best performance of rooftop solar systems and evaluates the influence of shading on these systems.
Among these, the most popular method is simulation using energy modeling tools such as PVsyst, Sketchup, HOMER, PVGIS, PV Watts, PV Online, PV Online, SISSIFO, RETScreen, etc. (Kumar et al., 2017) (Vishnupriyan & Manoharan, 2018). Among the various software tools mentioned above, the most popular and widely used for feasibility analysis is PVsyst (Belmahdi & Bouardi, 2020) (Sharma et al., 2018) (Vasudev et al., 2018).
(Belmahdi et al.,2020, Akshai et al, 2020, Ahmad et al.,2019, Irwan et al.,2015, Chacko & Thomas, 2015) evaluate different solar installations by using PVSyst software.
The main objective of this study is to evaluate the proposed use of a solar photovoltaic system to reduce energy consumption in a hatchery.
Materials and methods
2.1 Simulation model using PVSyst.
The PVsyst simulation tool is a commonly used software in designing solar power plants optimally and assessing the energy yields of the plants. It uses meteorological irradiation resources, extensive knowledge of PV technology, and PV system components for the simulation. As a result, the PVsyst tool can assist researchers and engineers to comprehend the PV system’s workings to improve the system’s design. The proposed grid-connected PV system was simulated using the following steps
- Identification of the study area (geographical location)
- Characteristics of meteorological data (solar radiation, ambient temperature, wind speed, etc).
- Selection of PV module orientation (e.g. azimuth and angle)
- Selection of system components (module and inverter) in relation to the requirements
2.2 Location of the site for the installation of the FVSS.
The hatchery is located in the town of San Fernando de Camarones, municipality of Palmira. It has the coordinates 22.240348 degrees north, -80.301004 west longitude. Fig 1 shows the geographic location of this site.

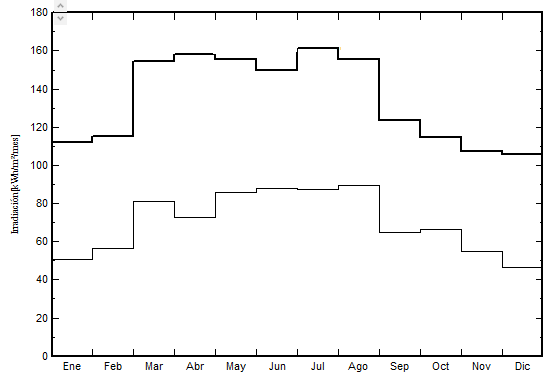
The study area has an average global horizontal irradiation (GHI) average of 130 kWh/m2/month and horizontal diffuse irradiation of 70 kWh/m2/month. The average annual temperature for the area is 24 °C, with an average wind speed of 2,0 m/s. The relative humidity of the study area is also 77 %. The weather characteristics of the study area are presented in Fig 2. The lowest solar irradiation usually occurs during the winter; similarly, May-August record relatively high temperatures and insolation. The month of July generally receives the highest solar irradiation and temperatures.
The panels will be placed in arrays in an area designated for this purpose, the UEB has sufficient availability of this for the possible location, this will be located facing south and with an angle of inclination equal to 15°. This inclination is a practice used by the Cuban Electric Company to install its panels in the photovoltaic parks, this gives a good level of generation and makes better use of the available area (since it reduces the distance between panels) (Stolik, 2019), in addition to guaranteeing greater resistance to winds, it privileges generation in summer and the decrease in solar energy captured per module is very small with respect to the recommended inclination for this type of studies in our country of 22.170 degrees (Stolik, 2019).
2.3 Available PV module characteristics
The Table 1 presents the characteristics of the PERC 156,75 mm x 156,75 mm Monocrystalline Silicon Solar Cell. The model of this module is DSM-380.
Table 1 - PERC DSM-380 Monocrystalline Silicon Solar Cell Technical Specifications.
| Technical Specifications | |
|---|---|
| Cell | Monocrystalline Silicon Solar Cell PERC 156,75 mm x 156,75 mm |
| No. of cells and connections | 72 (6x12) |
| Module dimensions | 1 968 mm x 992 mm x40 mm |
| Front Cover | Tempered Glass |
| Frame material | Anodized aluminum alloy |
| Weight | 22 kg |
| Electrical characteristics | |
| Open circuit voltage (Voc) [V] | 48,50 |
| Voltage at maximum power point (Vmp) [V] | 39,33 |
| Short circuit current (Isc) [A] | 10,17 |
| Current at maximum power point (Imp) [A] | 9,67 |
| Maximum power at STC (Pm) [Wp] | 380 |
| Tolerance [%] | +3% |
Results
The proposed FVSS array has a rated STC power of 21 kWp. This FVSS is composed of the DSM-380 MP photovoltaic module from NUMENSOLAR. The system has 3 strings of 18 modules connected in series for a total of modules occupying an area of 105 m2. The FVSS is accompanied by an inverter model TRIO-20_0-TL-OUTD-S1-US from ABB with an output of 22 kWac.
In the summary of results shown in Table 2 it can be seen that from the simulation with PVSyst 7.1 the FVSS allows the possibility of installing 54 photovoltaic modules of the DSM-380 MP model in the UEB, has an annual generation capacity (real) of 29,07 MWh/year and a performance factor (expresses the relationship between the final and reference productivity of the installation) above 0,83.
Table 2 - Simulation results with PVsyst.7.1.0 of the FVSS. (PVsyst. 7.1.0)
|
GlobHor kWh/m² |
DiffHor kWh/m² |
GlobInc kWh/m² |
GlobEff kWh/m² |
EArray |
E_Grid |
PR | |
| January | 112,2 | 54,61 | 131,5 | 127,8 | 2,395 | 2,317 | 0,859 |
| February | 115,5 | 57,75 | 129,1 | 125,5 | 2,325 | 2,249 | 0,849 |
| March | 154,7 | 72,64 | 163,2 | 158,9 | 2,893 | 2,800 | 0,836 |
| April | 158,3 | 81,61 | 159,5 | 155,2 | 2,831 | 2,738 | 0,836 |
| May | 155,4 | 89,09 | 150,5 | 145,9 | 2,667 | 2,576 | 0,834 |
| June | 149,7 | 90,90 | 142,7 | 138,3 | 2,534 | 2,447 | 0,836 |
| July | 161,2 | 90,70 | 154,6 | 149,8 | 2,733 | 2,640 | 0,832 |
| August | 155,4 | 89,09 | 153,8 | 149,5 | 2,728 | 2,636 | 0,835 |
| Year | 1613,5 | 868,31 | 1684,7 | 1636,4 | 30,073 | 29,068 | 0,841 |
The losses due to collection (array, PV module) are 0,6 kWh/kWp/day, on the other hand the losses due to inverter are around 0,13 kWh/kWp/day respectively. The Fig 3 shows the performance of the FVSS, as well as the collection losses, system and energy The average system efficiency is 0,841. The Fig 4 presents in detail the characterization of these system losses.
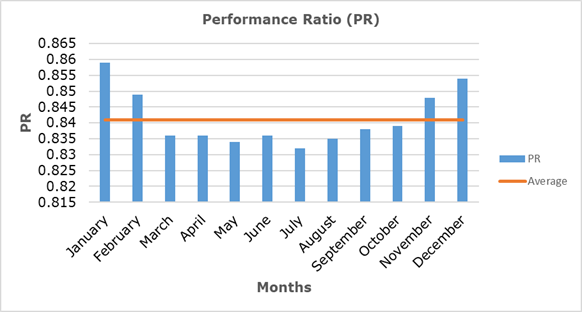
The most significant losses are due to high temperatures (7,73%). In the assembly of these systems it is necessary to take into account the correct ventilation of the modules to avoid overheating of the solar cells and thus reducing the performance of the panel.
The case study has an average electricity consumption of 8 036 kWh/month, energy paid in CUP according to the contracted M3-A tariff. The economic evaluation of the proposal should consider the monthly electricity consumption of the UEB during daytime hours (hours where the FVSS will be operating), since these represent the demand to be satisfied.
Taking into consideration the payment per kWh delivered to the SEN of 2,7808 $CUP, this value is used to determine the annual cost of electricity delivered to the SEN by the FVSS (Table 3).
Table 3 - Revenues for the economic analysis of the FVSS.
| Concept | Unit | Unit energy cost. (SEN and FVSS) | Annual energy cost (CUP) | Annual income from energy supply (CUP) |
|---|---|---|---|---|
| kWh/year | $/kWh | $/year | $/year | |
| Consumption and avoided cost of electrical energy of the SEN by supplying electrical energy from the FVSS. (C eEE SEN). | 21 801 | 1,81 | $39 459,81 | $39 459,81 |
| Annual energy generated by the FVSS in daylight hours. | 29 068 | 2,7808 | $80 809,04 | - |
| Annual cost of electricity delivered to the SEN by the FVSS during daytime hours (CE.E.FV to the SEN). | 7 267 | 2,7808 | $20 208,07 | $20 208,07 |
| Energy generated by the FVSS and total income from energy supply. | 46 607,00 | - | - | $59 667,88 |
The fig 4 shows the investment with a defined cost in China of 32 060,45 $CUP for the FVSS in question.
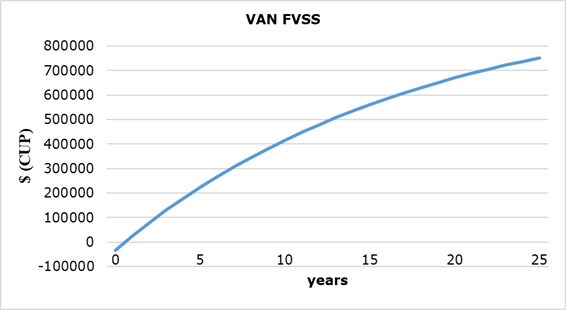
As shown in Fig 4, the initial investment, considering one of the lowest costs in the international market ($32 060,45 CUP), presents an NPV of $741 728,91 after 25 years, an Investment Recovery Period (IRP) of 1 year and an Internal Rate of Return (IRR) of 172%.
Conclusions
The evaluation with PVsyst 7.1.0 determined the photovoltaic generation potentialities for the case study, said evaluation showed that an available area of 105 m2 is needed, surface where there is the possibility of installing a total of 54 photovoltaic modules of the DSM-380 PERC model, with an annual generation capacity (real) of 29,068 MWh/year.
The costs established by the supplier of this type of technology in our country to install 1 kWp of photovoltaic solar power are in the order of US$ 2 292,00, a value that triples the total costs of the commercial kWp in countries such as India, China, Germany and Spain, which range from US$ 596,00 to US$ 761,00. Therefore, it is necessary to review the possibility of a lower cost supplier.
Considering the average annual consumption for the case study is about 100 MWh/year, it is possible to substitute approximately 30% of this consumption by using the FVSS. Considering one of the minimum costs of the international market for the FVSS of 32 060,45 $CUP, the investment presents a NPV of $ 741 728,91, after 25 years, an Investment Recovery Period (IRP) of 1 year and an Internal Rate of Return (IRR) of 172%. This investment is undoubtedly the most appropriate for the entity and if the initial prices in the given range are obtained, it is the recommended investment to be made.

