


 Servicios personalizados
 Español (pdf)
 Articulo en XML
 Referencias del artículo
 Enviar articulo por email
 Citado por SciELO
  Similares en
SciELO
Similares en
SciELO 
 Permalink
Introduction
The capacity approach has expressions in several fields. The theory of capacity refers to the human and social development of individuals. For its part, the theory of resources and capabilities has the purpose of studying the weaknesses and strengths of organizations for their empowerment as a competitive advantage (Salnikov et al., 2017). When these are combined with adaptation to a dynamic environment to achieve high levels of performance in a sustainable manner, we are in the presence of dynamic capacity management (Zapata & Mirabal, 2018).
Additionally, productive capacities refer to the analysis of improvements in the productive system that result in more and better products and services according to the demands of the clients. If each of these theories is analyzed independently, they may appear different; however, they all result in the same result if society is assumed to be a system. Within the global socioeconomic system, several organizations coexist that must adapt to changes in the environment, strengthening the capacities of their workers and their production and service systems.
The constant changes in the environment, competition, and customer demands make industries and services change the philosophy of their management towards a more competitive one. The development and competitiveness that are aspired to depend largely on factors such as decision-making and resource management. Decision-making in a company can be focused on the processes’ capacity to meet demand or other factors such as employee or financial disposition in a capacity-limited environment (Caiazza et al., 2021).
Capacity utilization is an important index to be controlled by managers because it is proven that there is a strong correlation between capacity utilization rate and performance (Salnikov et al., 2017). This global form is applied at the country level, and three types of surveys are mainly used. These focus on measuring the use of production capabilities for specific products. To do this, the maximum level is determined by the characteristics of the used equipment ("engineering" approach), and the indirect measurement of rates is based on certain models and assumptions (Salnikov et al., 2017).
For example, the United States plans and controls the capacity utilization of the main industries: manufacturing, mining, and electricity and gas services. This is evaluated between 75 and 78 percent; but in the last 60 years you can see a tendency to dismiss total industrial capacity, fundamentally after the crisis of 2009. This can translate into a current economy that balances sales and capacity use, in correspondence with the variability and instability of modern consumption.
The capacity problems solved by large companies do not have the same expression in Latin America; where productivity and financial profitability remain a challenge for them (Ríos, 2016). Therefore, the objective of this article is to show how the comprehensive analysis of capabilities in logistics systems can be used as a basis in business management decision-making. For this purpose, a general algorithm tested in more than 24 cases with different scopes and contexts of Cuba and Ecuador, is proposed. The use of the Second Generalization of Capacity Calculation (SGCC) as a mathematical formulation is exemplified in the study case of a dairy industry, where it is used to decide on the development of new products and to support the technical phase of an investment feasibility study.
This work is structured in five sections: section one of Theoretical Background of Capacity where an analysis of the concepts associated with capacity management is presented. The second section explains the methodology on which the work is based, presenting the equations for the calculation and balance of capacities in any process. The results section shows the application of the proposed capacity models in the analysis of an investment in a dairy plant in Cuba. Prior to the conclusions, there is the discussion section where the results obtained with other similar studies are contrasted; In addition, a summary of the application case is presented, which allowed us to validate this methodological proposal as generalizable to the entire context of supply chains.
Capacity theoretical background
The capacity of a logistics system is the maximum number of products that can be delivered to the end customers at a specific time in correspondence with the product specifications, the production combination, the normal work effort, with the existing plant and equipment (APICS, 2020). On the other hand, Anaya (2007) reveals that when it is calculated with a variety of products, the capacity is generally measured in aggregate terms by units of measurement to which all products can be reduced (tons, cubic meters, etc.) or in terms of results, that is, the resources that are used, such as machine hours, working hours, tons of raw material and others; and he recognizes that they are not always useful measures. Other authors, such as Bawa (2007), focus on the capacity from the point of view of the technical and chemical parameters that can guarantee the equipment of the processes to the products, such as dimensions: chemical composition, mass, precision and resistance.
Also, maximum productive capacity means the maximum quantity of products “of the quality of the corresponding assortment”, which can be produced by a workstation in a unit of time, with optimum use and under operating conditions (Su et al., 2019). It also expresses the maximum production speed of an activity and can also be taken as the maximum possible production in a given period, using fully and in correspondence with the normed work regime, the productive teams and production areas, considering the realization of the measures for the introduction of more advanced technologies.
Each system is designed with a capacity, which is the maximum amount to deliver to customers “in ideal conditions”. However, in reality, these conditions are almost never presented; therefore, an algorithm must be available to determine the effective capabilities of the logistics system. Which is considered the maximum volume of production that can be made based on the available resources and the technical-organizational conditions under which production takes place (Su et al., 2019).
Analyzing capacity involves determining the level of capacity utilization as well as identifying the factors that determine the magnitudes of these and defining the existing reserves to increase the magnitude and level of utilization of capacities; it is defined by the capacity of the bottleneck process. However, when talking about capacity, the capacity is the maximum possible process or a fundamental point defined in the line.
Then, authors agree that a process capacity is the maximum possible production in a given period in the nomenclature (Khalifehzadeh & Fakhrzad, 2019) and quality demanded by customers, is fully utilized and in correspondence with the standardized work regime, equipment and productive areas available (Muñoz et al., 2016). The purpose of this is to determine and apply the actions that guarantee to put the magnitude and use of the same at the level that the demand of the clients requires, with the maximum possible efficiency (Lopes et al., 2013). The temporal dimension of capacity of a production/ service system, is used in planning and programming at the three levels of planning; short, medium and long term.
Other authors associate the productive capacity with productive unit (Muñoz et al., 2016), this definition is valid in the industry level for a single station or job. While from a business perspective it is more frequent to define capacity as the amount of production/ service that a system can achieve during a specific period, where operations managers must take into account resource inflows and product exits (Krajewski et al., 2019), this is included in the business plan. The bottlenecks are neither negative nor positive; they are a reality and must be used to manage the flow of the productive system. What determines the possible production of the plant is the capacity of the bottleneck process. Sometimes this term is confused with the ability of the plant; however, this is determined by the capacity of the fundamental point. One of the purposes of the balance of capacity is to make these two processes coincide. However, this does not make uncertain the need to find a balance between what the bottleneck allows to produce and market demand; from there, balance the production flow of all productive resources at the rate of the productive factor of the bottleneck.
The key is to take full advantage of the bottleneck capacity; one hour lost in this type of resource is an hour lost in the entire productive system. Bottlenecks should work primarily on products that involve an immediate increase in performance and on products that will convert inventories before becoming full production. But dealing with bottlenecks does not mean neglecting those that are not, as letting them work freely increases inventories and operating expenses unnecessarily.
In demand studies, it is identified that there is correspondence between human desires and their support of purchasing power. Therefore, this implies that there will be demand for a product or service if there are people who want it and are willing to pay for it (customers). This has among its key points: human capital, information and technology, collaboration between departments, and the use of performance indicators. Consequently, demand is the main input variable of the production and services system (Khalifehzadeh & Fakhrzad, 2019). This implies that the decision-making that is made from the calculation of the capacity must be in relation to the estimate of the demand (van Hulzen et al., 2022). In short, when talking about demand in a production system, it is nothing more than the willingness and real possibility of customers to purchase a product from the production line in determined quantities, with an established quality, and in the format they want.
Materials and methods
In this research, the methodology used is the Second Generalization of Capacity Calculation (SGCC) (Lopes et al., 2013). This model allows for determining the capacity of the entire logistic system, including the production and service processes. It can be applied to the production process, the service process, or even the supply chain (analysis unit); depending on the application scope, the minimum analysis unit (MAU, defined by a group or homogeneous operations) may be the operations or processes. This model is an improvement and generalization of the General Algorithm of Capacity Calculation presented by Torres & Urquiaga-Rodríguez (2007).
The SGCC consists of a linear equations’ system (equations 1-10) and a general procedure to guide the capacity analysis. The main feature is that from the capacity calculation coefficient (equation 1), the capacity of each MAU is determined. Then, the capacity of the analysis unit is selected from the fundamental point capacity as well as the possible production from the bottleneck capacity affected by its stability or product demand limitations. It is described using the set of expressions in Equations 1 to 10.
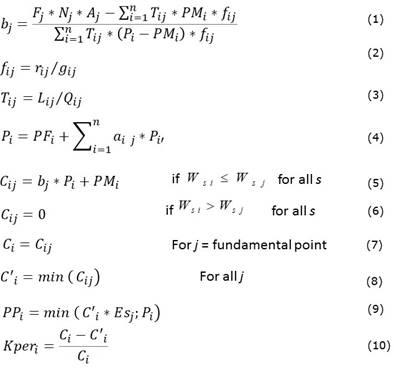
Where: Product number (i = 1, 2, 3, …, n) Intermediate product number (i = 1, 2, 3, …, p) Operation or process number (j = 1, 2, 3, …, m) Working time of operation or process j in the period (less technological requirement times Ps) Technological requirement times (scheduled maintenance, mold changes, line cleaning, etc.) Performance index of the operation or process j Quality acceptance index of the operation or process j Processing time per unit of product i in operation or process j Minimum production of the product or service i to be guaranteed Product i demand in the analyzed period Product i flow rate in process or operation or process j Proportion of the final product i that the operation or process j must ensure Consumption index of the intermediate product i’ obtained by the operation or process j for each unit of the final product i of the network Operation cycle of operation or process j for the treatment of the product i with a lot size Qij Product i lot size in operation or process j Product i production capacity in operation or process j in the period analyzed Capacity calculation coefficient in the operation or process j Number of the technical parameter considered in the operation or process (s = 1… S) Value of the technical parameter s in operation or process j or in product i Reachable product i capacity Capacity at the limiting point for the product i Operation or process operational stability Possible product i production due to the bottleneck stability or the limitation of the product demand Coefficient of product i capacity loss due to "bottleneck"
This formulation improves the previous one presented by Torres & Urquiaga-Rodríguez (2007) in the following elements:
It introduces the technological requirement times (Ps) to express the deterministic planned waste times and the performance index (Nj) and quality acceptance index (Aj) as a statistical reflection of unplanned time losses. These improvements allow us to calculate the effective capacity by taking into account only the planned wasted time (Nj = 1 and Aj = 1) and the attainable capacity based on the real conditions of the process.
The model is based on the measurement of the operations or processes (MAU) time; for this, the model is complemented by organizational techniques such as individual and collective synchronization (APICS, 2020). As sometimes it is not possible to determine the operation time for a unit using these techniques because they are continuous or complex processes (for example, the liquids flow through pipes or the cells ferment in a container), equation 3 is used to treat all cases.
Equation 4 expands the influence of demand on the analyzed system capacities since it takes into account the direct market demand and also the internal system requirements.
It introduces a technical coefficient that expresses the capacity of each MAU to guarantee each technical characteristic of the products (equation 5 and 6).
The general procedure to guide the capacity analysis begins with the first definition and characterization of the product or service under study and its operation or process (MAU). At the same time, there are several steps: the definition of the homogeneous groups of equipment, sectors, and workshops, and the nomenclature of the products to be considered in the calculation of the productive capacity. This continues with the determination of time expenditure regulations, the definition of the assortment structure to consider, the work regime, the available equipment and areas, the planned production volumes, and the working time calculation. In the last case, it is defined for each homogeneous group and must take into account the time allocated to technological and/or organizational requirements.
The capacity utilization coefficient is determined by several steps: the observations, the estimation of the capacity utilization coefficient according to the production plan, the actual production volume, and the utilization coefficient of the real capacity. In the last phase, a plan of measures is developed to increase capacity utilization. In addition, not only the capacity utilization coefficient of the industry but also that of each particular group of equipment in particular must be analyzed to detect "bottlenecks" and to be able to take technical and organizational measures to increase the capacity of said point. Also, if capacity is insufficient, what measures can modify the factors that guarantee the necessary increase in capacity? The capacity utilization analysis process is what allows for determining the factors that influence or will affect the use of the capacities and, thus, taking measures for their management.
To facilitate the application of the system of linear equations, an Excel program was designed. In "Capability11a.xls,” the equations system is programmed to show all the results and some graphics analysis. Also, it permits the analysis of capacity efficiency (attainable capacity or effective capacity), capacity utilization (attainable capacity or design capacity), and real reachable production, among others.
Results
Study case: application of the SGCC in a Dairy factory
In 2017, the possibility of an investment in the yogurt and cheese factory that supplies the universities of western Cuba (Dairy factory I) is presented. For this, a capacity analysis is carried out to determine which new products could be generated from the existing raw material and in which areas the investment would be more efficient. By using the “Capability11a.xls” tool, effective and accomplish capacities, possible production, and the real and possible capacity utilization index, are determined. From the capacity results, some actions are evaluated for selecting the finals proposals for new products and investment lines.
Costumers
The company has about 25 customers, of which nine were surveyed to know their opinions on the quality of the products and their interest in buying the biggest quantities of products. The most relevant data provided by the analysis of the same is that the level of acceptance for quality is 100% because none of the respondents has had problems with any of the products. On the other hand, 44% would like to be able to carry more yogurts, while 55% are happy with what they currently carry.
These results may give an idea of the need for better sales planning, but before knowing that it can be sold to each customer, it is necessary to know the actual production capacity of the entity.
Current products
The factory produces three products: fresh cheese, natural and flavored yogurt. To establish standards technological recipes of each one, daily production reports between 24th May 2018 and 29th March 2018 were analyzed. To describe the technological operation and its workers, a flow chart was used; and for the determination of standards times, the statistical processing method was made. From historically estimated, it was determined that the 0.8% of the milk received is lost during the yogurt production process.
Fresh cheese is sold to universities and companies that have an allocation at $35.89/ kg, while third-party customers are sold at $39/ kg. The production process of natural and flavored yogurt is very similar. They only differ in the fact that the flavor yogurt carries flavor and sugar; while the natural yogurt does not, so its process is faster and less laborious for workers. Each liter of natural yogurt is sold to companies with allocation (universities) to $3.69 and $4 to the third party; meanwhile, flavored yogurt sells for $3 and $4.75, respectively.
Determination of the parameters for capacity calculation
By using the “Capability11a.xls” that contains the SGCC model, the possible production for each assortment is determined according to the limiting point. At first, three main products are defined: fresh cheese, flavored and natural yogurt. For each one, its price was defined and their unit variable costs.
In addition, it became necessary to determine the demand and the minimum production of each product. The minimum production was defined based on the production plan for 2018, which consists of 30 000 kg of cheese, 174 403 liters of natural yogurt and 173 738 liters of flavored yogurt. On the other hand, the demand was estimated based on the monthly sales in 2018; it is 26 048 kg of cheese and 531 520 liters of yogurt in total per year. In order to know how many liters of yogurt of each type should be delivered, the productions were analyzed for 45 days, from which it was sold 65% of the time natural yogurt and the remaining 35%, flavored yogurt.
Once the products data was defined, it was necessary to define and characterize each process. Since in the cheese the first six operations are made on the same equipment, the pasteurizer, it became necessary to group them in a single operation. The same applies to the operations of filling the molds and molding and capping that are carried out in the same job, and with the placement in the press and the pressing time (which is fixed for 15 minutes) that are carried out in the press. In this case there are two pasteurizers, one with a capacity of 600 liters and one with a capacity of 700 liters, a place for pressing with space for 12 molds and three presses with capacities of 6 molds each. The stability in this process is only 0.5%.
Similar to what has been explained above, it occurs both with natural yogurt and with flavor because the filling operations of the tanks, pasteurization and cooling or cultivation are carried out on the pasteurizers, so they will be united in a single operation. In these cases, there are three tanks with different capacities and in the case of heat and cooling rooms, there is room for 48 jars at a time. The stability of the yogurt process is higher, reaching a percentage of 67.8. In all the processes, eight hours are worked per shift, one shift per week and acceptance levels for quality and compliance with performance standards per hour are 100%. The days in the period to work are 261, data provided by the human resources specialist of the entity.
The production batches were determined based on the capacities of each tank for the pausing operations and the milk discharge. The molding on the basis that they are made in 12 molds at a time, and the pressing assuming that each press is placed six molds each of approximately 5.45 kilograms. The pots filling is done one at a time, and for the operation in the heat and cooling rooms, it was assumed a batch of 40 pots are processed at a time. The coagulation test has a processing batch of 100 milliliters for each received tank of 28 00 liters, therefore less than 1% of the total production takes this test.
The consumption indexes were defined based on the recipes calculated for each of the products. Regarding the general data, the currency used is the CPU and a period of 365 days, corresponding to one year, will be analyzed. It will work with a confidence level of 95%.
The property depreciation rate is 10%, while that of productive equipment is approximately 8%. The rate of contribution to social security is 12.5%, while the rate of use of the labor force is 5%.
Regarding the fixed costs to determine the area of the jobs, the elaborated plan of the company was used. We also defined the quantities of workers per job. In the case of the area of cheese, as there are only two operators to perform all operations, it was decided to estimate that in each operation 50% of the work of an operator is invested.
Results of the capacity calculation
The Capacity11a.xls determined the possible production of each product based on current demand, as seen in Table 1.
Table 1 - Dairy factory I capacity results.
| Product | Products volume (units of 125 ml) | Capacity excess | % demand satisfaction | |||
|---|---|---|---|---|---|---|
| Demand | Minimum | Possible | Capacity | |||
| Total | 561 520 | 374 189 | 561 520 | 1 445 046 | 883 526 | 100 |
| Fresh cheese | 30 000 | 26 048 | 30 000 | 73 518 | 43 518 | 100 |
| Natural yogurt | 345 488 | 174 403 | 345 488 | 1 129 181 | 783 693 | 100 |
| Flavored yogurt | 186 032 | 173 738 | 186 032 | 242 347 | 56 315 | 100 |
Source: self-made.
As a result of the analysis, it is possible in all cases to meet the current demand; in fact, a quite significant surplus could be obtained that could be used to increase sales to third parties’ companies. The bottlenecks in operations are those related to pasteurizers in the case of yogurts and coagulation and cooking in the case of cheese. This is a product to which they constitute the fundamental points in the production of both yogurts’ types and cheese, and it is necessary that they invest a lot of time in production.
In general, the current situation provides positive results and allows meeting the demand, and there is even a surplus that can be used for sale to third parties. The following table shows the total income to be obtained with said demand and the possible production, reaching values of up to $3 039 567 Cuban pesos (Table 2).
Table 2 - Capacity results for dairy product (unit of 125 ml).
| Product name | Volume of the products | Capacity Excess | Demand | Capacity value | Possible production value | ||
|---|---|---|---|---|---|---|---|
| Demand | Possible | Capacity | |||||
| Total | 561 520 | 561 520 | 1 445 046 | 883 526 | 3 039 567 | 7 702 092 | 3 039 567 |
| Fresh cheese | 30 000 | 30 000 | 73 518 | 43 518 | 1 076 895 | 2 639 038 | 1 076 895 |
| Natural yogurt | 345 488 | 345 488 | 1 129 181 | 783 693 | 1 275 023 | 4 167 242 | 1 275 023 |
| Flavored yogurt | 186 032 | 186 032 | 242 347 | 56 315 | 687 648 | 895 811 | 687 648 |
Source: self-made.
However, in order to take full advantage of the installed capacities, it would be necessary to supply around 2 099 089 liters of milk per year. This value has not been reached in recent years, since in 2016 and 2017, 1 000 694 and 1 048 817 liters of milk were received, respectively.
In this study case, once the productive capacity of the entity has been determined, it is necessary to analyze alternatives that contribute to increasing and optimizing revenues. They are shown below.
Alternative 1: including the whey as a product to sale
In modern industry, more and more are being pursued to take advantage of the waste from production in order to increase efficiency and reduce costs. In dairy products, there is a residue of high protein value, serum. This has dissimilar uses today, such as its sale for animal consumption, its sale as a flavored drink, or even as a complement for the production of biofuels.
In order to know the amount of serum that is wasted as an average in the entity, the cheese productions of all the months of the years 2016 and 2017 were analyzed. In advance, it is a known product of historical behavior that a milk tank of 600 liters is left on average when making cheese with 400 liters of serum. This makes a standard of 0.67 liters of serum per liter of milk.
In summary, in the last two years, she has stopped earning about $149 872 Cuban pesos. However, it is known that in order to sell this product today, not only new customers are needed, but also investments must be made in infrastructure to store the whey during production without affecting the cheese-making process. At the moment, a storage tank of 1000 liters would be enough. What should be planned for the clients so that they always come to look for the serum in fixed days and hours?
At first, you can use the pump that has the local to pump the serum out of the pasteurized tanks. The Alibaba.com website was consulted with a view to knowing the approximate prices of stainless-steel storage tanks, which range between $1 420 and $9 400 Cuban pesos for capacities between 500 and 20 000 liters. If it had already been invested in a 1 000-liter tank with an approximate price of $2 000 Cuban pesos, it would have been paid in two years.
Alternative 2: optimizing the production distribution
Once the production capacity of the company is known, the allocation that must be met monthly and the costs and sales prices of the products can, using linear equations with the QSB 2000 software, determine the optimum production plan.
The objective is to design a distribution plan for the products that guarantees the greatest possible benefits. To do this, the following variables were defined:
Xa Kilograms of cheese to produce for the allocation
Xt Number of kilograms of cheese to be produced for third-party companies
Ya Quantity of liters of flavor yogurt to be delivered for the allocation
Yt Quantity of liters of flavored yogurt to be delivered to third parties
Za Quantity of liters of natural yogurt to be delivered for the allocation
Zt Quantity of liters of natural yogurt to be delivered to third-party companies
It is known that the number of kilograms of cheese to be delivered for the allocation must be greater than 2 368 kg per month, and the total liters of yogurt must exceed 48 320 liters.
In addition, the sum of each of the global variables by products must not exceed the capacity calculated in the previous chapter.
It should also be considered in this case that the total liters of milk to be used should not exceed 1048817 liters delivered the previous year. Using the QSB 2000 software, the equations were modeled, the objective being:

(11)
The result of the equation shows that the maximum benefit to obtain is $811 131 Cuban pesos. In addition, this distribution would not be limited by the production capacity but by the quantity of milk delivered. In the case of flavored yogurt, it would be delivering everything that the capacity allows it to produce.
Alternative 3: Eliminating the subsidy to the milk cost
In a similar way to the previous section, the equations were simulated in order to obtain the distribution of products by client type that would guarantee the greatest benefits, but in this case, assuming that the milk will be paid by the company at $5 Cuban pesos per liter. This is the maximum price that the ministry of agriculture pays to each farmer, and it is intended that by eliminating the subsidy, greater amounts of milk will be delivered to the entity to the extent that these are no longer a limitation and can be exploited to the maximum of the capacity.
The increase in the cost of the fundamental raw material would inevitably lead to an increase in production costs. Since the corporate purpose of the company is currently to produce for higher education entities, which are usually budgeted, the same prices must be maintained for the allocated products, even when these are below costs. What is tried is to find a balance in production that equates the expenses and, at the same time, contributes greater income to the entity.
To achieve this, it would be necessary to increase sales prices to third parties. In this simulation, the prices that the population is willing to pay were generally taken as possible. These prices will be for each pound of cheese at $25 Cuban pesos, while each liter of yogurt would sell for approximately $17 Cuban pesos.
With a view to these measures the equations were raised again, leaving as an objective function:

(12)
The results obtained show a profit value of $9 376 826 Cuban pesos, ten times higher than that found in the previous section. In this case, the limitations would be the capacities since they would be taking advantage of 100%.
It is necessary to emphasize that this alternative is only possible if it installs a yogurt packing machine for smaller containers. The cost of a packaging machine is around $200 000 Cuban pesos.
Resume of the case analysis
All the activities that make up the yogurt and cheese production processes were defined: in the case of cheese and flavored yogurt, there are 11, while for natural yogurt, there are only nine. Likewise, the time standards for each of the operations were determined. The optimal quantities to produce each product for each type of customer were also established, reaching a profit of $811 131 Cuban pesos.
The analysis showed that in the current situation, it is possible to produce 73 518 kg of fresh cheese, 1 129 181 liters of natural yogurt, and 242 347 liters of flavoring yogurt. If the stability of the semi-catering process can be increased, the income from the sale of yogurt would reach $16 318 810 Cuban pesos. If the milk serum is included as a product, it will generate about $ 72 394 Cuban pesos per year in sales.
Discussion
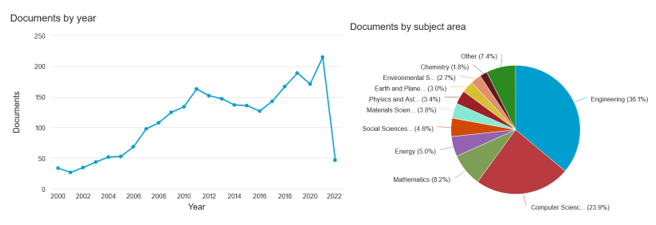
When conducting a search in Scopus with the title or keywords "capacity analysis", 2 573 documents were obtained between the years 2000 and 2022. However, of these documents, only 36% correspond to the engineering area, which shows that despite the increase in publications on the subject, it is still necessary to delve into it from the engineering area. See Figure 1.
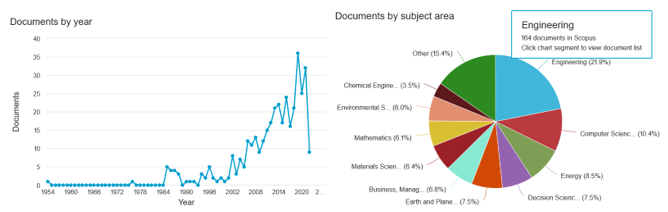
However, if a search is made for "production capacity" (Figure 2) in title and keywords, the results are reduced to only 370 documents. In this case, the highest percentage (approximately 22%) corresponds to the engineering area.
One of the studied papers establishes a simulation-based method to evaluate the passenger-carrying capacity of rail transit transfer stations. The method takes into account the service level of the bottleneck area of the station and the overall transfer situation (Gao et al., 2022). For the other part, Tursunov (2018) presents a methodology based on a weighting factor and expert assessment with the purpose of evaluating the efficiency of capacity management in the textile industry. In this, a method based on the integral rate of results and the quality of the performance of the management of the productive capacity in the textile companies has been developed.
Some of the most recent works coincide with the approach given to the SGCC, since they analyze uncertain variables such as reliability, availability, and maintainability (Moniri-Morad et al., 2022), but in this case, only for transport systems. Also, Zhang et al. (2021) presents a paper with a production capacity identification and analysis method based on multivariate nonlinear regression integrating the affinity propagation clustering algorithm for energy savings and resource optimization.
On the other hand, the work of Tyulin et al. (2017) analyzes approaches to optimizing productive capacity in cases of launching a new line of business in a company. This optimization approach accounts for the traits of high-tech businesses, a scenario in which it would be worth evaluating the SGCC application.
In each application of the SGCC, the results are used for different purposes; in the presented case, they are used for the technical evaluation of an inversion. Traditionally, inversions are evaluated from a market and economical point of view, but for technical evaluation, the machine or product aspect is evaluated. In this case, we used a capacity analysis for technical feasibility evaluation as a way to resume all the technical aspects to be taken into account to introduce a new product or production flow change. This permitted those organizational aspects were also analyzed in the feasibility analysis and not later, when the decision was already taken.
To verify the generality and applicability of the SGCC, several applications were carried out, some of which are summarized in Table 3. In this table, it is possible to distinguish the feasibility of objectives, scope, and the types of products for which it is used. In addition, it is clear how the SGCC can be used for several purposes, including the design, strategic planning, improvement, or operation of supply chain processes.
Table 3 - Applications of the Second Generalization of Capacity Calculation in different study objects.
| Objects | Classification | Product type | Scope | Objective | Country |
|---|---|---|---|---|---|
| Dairy factory I (small size) | Product | Standard | Industry | inversion analysis | Cuba |
| Research and production center of nuclear medicine | Product | Special | Supply chain | strategic production planning | Cuba |
| Dairy factory II (medium size) | Product | Standard | Industry | production plan balance | Cuba |
| Edible oil warehouses | Product | Standard | Process | Reorganization | Cuba |
| Puree tomato factory | Product | Standard | Industry | plant improvement | Cuba |
| Puree tomato in a territory | Product | Standard | Supply chain | Strategic planning | Cuba |
| Pasta factory | Product | Standard | Industry | plant improvement | Cuba |
| Audiovisual products and services company | Product | Standard | Supply chain | product's distribution organization | Cuba |
| Edible oil supply chain | Product | Standard | Supply chain | supply chain diagnostic and organization | Cuba |
| Aluminum carpentry | Product | Standard | Economic sector | productive sector diagnostic | Cuba |
| Tomato Puree Supply Chain | Product | Standard | Supply chain | supply chain diagnostic | Cuba |
| Library | Service | Standard | logistic system | design of a new service | Cuba |
| Publishing company | Service/ Product | Special | Process | production plan balance | Cuba |
| Explosives production for civil use | Product | Special | Industry | strategic production planning and new product development | Cuba |
| Mud and Pottery Workshop | Product | Handmade | Industry | new business organization | Ecuador |
| Wood workshop | Product | Handmade | Industry | plant improvement | Ecuador |
| Ceramic factory | Product | Standard | Industry | production plan balance | Ecuador |
| Block factory | Product | Standard | Industry | plant improvement | Ecuador |
| Dairy factory III (medium size) | Product | Standard | Industry | production plan balance | Ecuador |
| Water processing industry | Product | Standard | Industry | plant improvement | Ecuador |
| Poultry farm | Product | Standard | Industry | strategic production planning | Ecuador |
| Pitahaya production and selling | Product | Standard | Industry | new business organization | Ecuador |
| Sawmill | Product | Standard | Industry | strategic production planning | Ecuador |
| Flour production and unconventional bakery. | Product |
|
Industry | new business organization | Colombia |
Source: self-made and elaboration based on various postgraduate and master's projects supervised by the authors.
62% of the applications have been carried out at an industrial level, that is, to define production capacities. Another 20% of the applications have been made in supply chains, where processes of various kinds coexist: production, service, logistics, etc. One of the applications was carried out in an economic sector at the national level, which made it possible to take reorganization dictates.
Conclusions
Currently, the use of productive and service capacities is a key factor in improving competitiveness. It is a fundamental element for achieving organizational objectives and high levels of positioning. This research included, as a case study, an analysis of the operational capacity of a dairy industry in Cuba. In addition, some regression equations were used to analyze investments based on the estimated capacities to be achieved. The analysis carried out in the case study presented shows that the three alternatives analyzed make it possible to increase the production capacity of the plant. From a financial point of view, it would determine the alternatives that can be applied with respect to the financing that can be obtained.
The study includes a summary of the application of the Second Generalization of Capacity Calculation, which was applied in another twenty cases of different situations: services, industries, supply chains, and an economic sector. Therefore, the generality of the Second Generalization of the Calculation of Capacities has been demonstrated. This allows it to be applied to different contexts and objectives to facilitate decision-making, both at a strategic and tactical-operational level.
For future research, we propose to compare how the general formulation was adapted to each case study and to different types of processes and to present the adaptation of each variable in different activities. Also, it will be interesting to develop specific procedures for the decision-making process with multiple objectives.

