Servicios personalizados
 Español (pdf)
 Articulo en XML
 Referencias del artículo
 Enviar articulo por email
 Citado por SciELO
  Similares en
SciELO
Similares en
SciELO 
 Permalink
Introduction
Interlaboratory comparison is a procedure to evaluate the performance of participant laboratory for specific tests against pre-established criteria. Each participant implements his routinely measurement method. This procedure is often called proficiency testing or laboratory performance studies.1,2,3,4
The study provides experimental evidence on the lab continuous performance to realize the measurements; this gives added confidence to individual staff, management and clients, and satisfies the requirements of regulatory and accreditation bodies.
The purpose of all measurement is to provide information about a quantity of interest. The outcome depends on the measuring system, the measurement procedure, sampling and sample preparation, the skill of the operator, the environment; thus, no measurement is exact.5
There are two types of measurement error quantity, systematic and random.5,6)Kadis (2008b) assumed Chumpler and Yoe´s (1940) classification of the errors as corrigible and incorrigible, both of the random and systematic components. The incorrigible error contributes to the uncertainty of the result.7,8
A systematic error remains constant or depends in a specific manner on some other quantity. In contrast, a random error provides a measured quantity value that is different from the previous value.5
Measurement uncertainty is defined as non-negative parameter characterizing the dispersion of the quantity values within which the true value of a measurand lies, based on the information used.5,7 Uncertainties associated with analytical measurements represent the doubt or level of reliability associated with the measurement.9
Comparison the interlaboratory measurements apply different protocols such as least-squares method 5,10,11) or statistical procedures as described in ISO 13528.4,12,13 On the other hand, analytical calibration for instrumental techniques and uncertainties determination based on least-squares linear regression has been presented.9,14,15,16
Interlaboratory studies in the corporate group for the nickel production in Cuba are applied as an external quality control of chemical analysis. There is a database of these controls that includes the quantitative analysis of metals such as: nickel, cobalt, iron, silicon, magnesium, in the different stages and products of the process.17 Chemical analysis measurements provide information for important decisions concerning productivity, efficiency, commerce, environmental protection, health, among others.
The purpose of this work was to determine the uncertainty in the quantitative chemical analysis of cobalt and iron, in paired solid samples of Nickel Sulfide and sintered Nickel Oxide, using the least-squares linear regression. Then, the measurements error and confidence intervals were presented. Interlaboratory measurements were made by Atomic Absorption Spectrometry.
Materials and methods
Samples and Chemical analysis
The samples of Nickel Sulfide (NiS) and sintered Nickel Oxide (NiO) come from the nickel industry in Cuba, Ammoniacal Carbonate Technology.
Chemical analysis for cobalt and iron were taken from the external control database. These analytical determinations are carried out systematically in paired samples for the interlaboratory comparison. Paired samples consist of a data set in which each data point in one sample is uniquely paired to a data point in the second sample.
The chemical analyzes were performed by Atomic Absorption Spectrophotometry in two participating laboratories, EC y RL, using a spectrophotometer “SavantAA Σ”, and “Avanta - P” respectively.
All chemicals are of analytical-reagent grade and all solutions prepared with deionised water. Nickel Sulfide (NiS) and sintered Nickel Oxide (NiO) are decomposed by mixing 0.9 g of sample with HCl (15 mL), HNO3 (10 mL) and HCLO4 (5 mL).
Measurement uncertainty
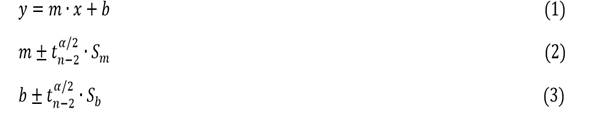
The method of least-squares was used to determine the line (1) that best fits the model and its variables the slope m and the intercept b. The independent variable x (explanatory or predictive variable) was plotted on the horizontal axis and the dependent variable y (response or predicted variable) on the vertical axis.9,14,18
The quality of fit was determined by the coefficient of determination R-squared (R2), this is the proportion of variability of y that is explained by x.
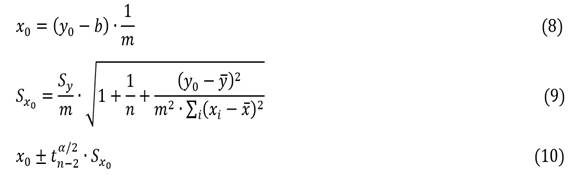
The confidence limits for the slope m and the intercept b were determined using the t-student distribution, confidence level and degrees of freedom (n-2) (2-6).14,18) Uncertainty in the measurements of y (Sy), or also called standard deviation for the lineal regression, was used in constructing confidence intervals and prediction intervals (error bars) for values of yi (7).
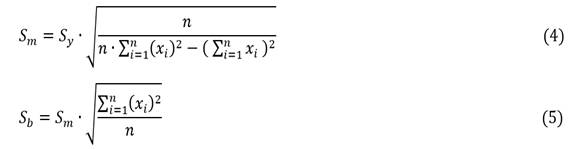
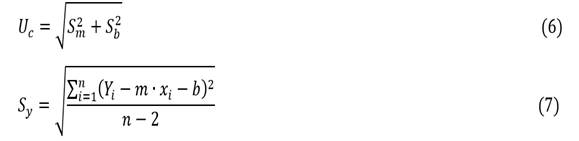
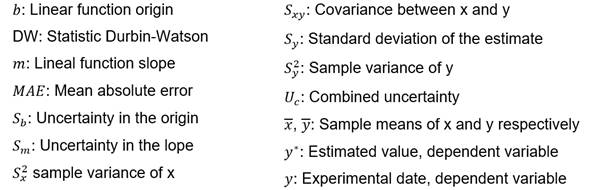
Where, Sm is uncertainty in the slope; Sb is uncertainty in the intercept; Uc is the combined uncertainty; Sy is Uncertainty in the measurements.
The expected value x0 (8) for a certain value y0 is expressed from the uncertainty (Sx0) associated with x0, when a single reading of y0 (9) is performed together at the confidence interval (10).
The results of previous equations are based on the following assumptions:
X- values are assumed to be "true" and free of error, and that any uncertainty in xi is negligible.
Y-values are assumed to show a Gaussian distribution, and the measurements of yi are all equally uncertain.
The residuals must be independent of each other. It is verified by means of the Durbin-Watson (DW) statistic. DW value should be in the range 1.5 to 2.5 with a P-value greater than 0.05, with a confidence level of 95.0 %.
Equality of variances (Homoscedasticity). Random error is assumed to be uniform over the range of the data, so, the variance of y is the same for each value of x. It is obtained by observing the graph of predicted values versus residuals, no association pattern should be appreciated. 16
Normality. The data from the analytical determinations that come from a normal distribution have standard skewness and kurtosis statistics within the range -2 to 2.
Statistical analysis was performed using StatGraphic Centurion XV and Microsoft Excel.
Results and discussion
The statistics summary for cobalt (Co) and iron (Fe) determinations with size sample (n) that were carried out in the CG and RL laboratories are shown in table 1. Measures of central tendency (average) and variability (standard deviation, coefficient of variation, range) are presented for two samples of dates; as for the shape measurements (standardized skewness and standardized kurtosis), these are shown for the paired samples.
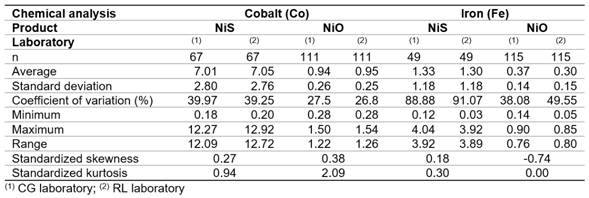
From table 1, it can be reasonably assumed that the analytical determinations of cobalt and iron in nickel sulfide (NiS) and sintered nickel oxide (NiO) come from normal distributions, according to the shape measurements between -2.0 and 2.0. All the dispersion graphics of standardized residual did not follow a pattern of association in the cloud of concentration points; therefore, the equality of variances (homoscedasticity) can also be assumed (Figures 1,2,3,4).
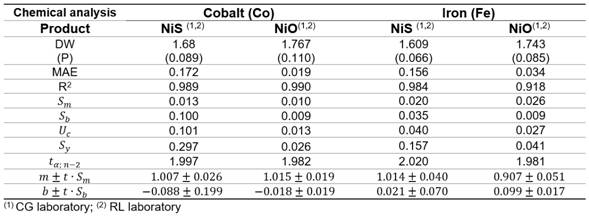
The residuals were independent among themselves, according to the satisfactory values of the Durbin-Watson (DW) statistic with a confidence level of 95.0 % (DW >1.5 and P >0.05) (table 2).
Fig. 1 Cobalt determination in Nickel Sulfide between laboratories CG-RL, a) Lineal model for NiS, b) Standardized residual
Fig. 2 Cobalt determination in Nickel Oxide between laboratories CG-RL a) Lineal model for NiO, b) Standardized residual
Fig. 3 Iron determination in Nickel Sulfide between laboratories CG-RL, a) Lineal model for NiS, b) Standardized residual
Fig. 4 Iron determination in Nickel Oxide between laboratories CG-RL, a) Lineal model for NiO, b) Standardized residual
The parameters of the linear models, slope m and the intercept b, were determined using Microsoft Excel. Uncertainty in the slope (Sm) and uncertainty in the intercept (Sb), the combined uncertainty (Uc), the standard deviation (Sy) of the measurements, and the confidence limits for m and b are shown in table 2.
The expected value of xi (UP) given a value of yi (CG) was determined by equations (8) to (10) for three values included in the cobalt and iron concentration ranges (Table 3).
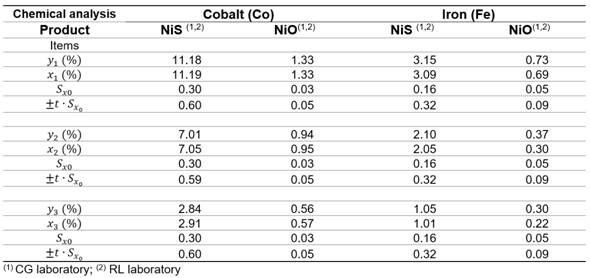
The uncertainty (Sx0) associated with x0 and the interlaboratory error (ξ) for the chemical analysis of Nickel Sulfide (NiS) resulted (Table 3):
Cobalt: Sx0 = 0,3 % and ξ = ( 0,60 %, in the concentration range [2,8 - 11,2 %]
Iron: Sx0 = 0,16 % and ξ = ( 0,32 %, [1,05 - 3,15 %].
In regards to sinterized Nickel Oxide (NiO) resulted:
Cobalt: Sx0 = 0,03 % and ξ = ( 0,05 %, [0,56 - 1,33 %]
Iron: Sx0 = 0,05 % and ξ = ( 0,09 %, [0,30 - 0,73 %].
At a cobalt concentration in NiS of y2 = 7,01 % in the CG laboratory, an expected value of x2 = 7,05 % in the RL laboratory corresponds with an error (ξ) of 0,59 %, that is 7,05 ( 0,59 %, and the confidence interval [6,46 %; 7,64 %]. Assuming a cobalt chemical analysis of X1= 6,46 % in RL lab and fallowing ISO 13528:

As |z| ≤ 2, the performance is satisfactory.
If 2 < |z| ≤ 3 then the performance is debatable and this generate a signal of warning; else if |z| > 3 then the performance unsatisfactory and this generate a signal of action.
From figures 2 to 3, it can assume a trend that both lab have almost equal results due to the values of intercept (b ≈ 0), slope (m ≈ 1) and R2>0,98 close to 1.
Cobalt determination in NiS (figure 1) showed an intercept b = 0,087 8 witch suggest a constant systematic error between the lab, as the value of b = 0 falls within the confidence interval [-0,287; 0,112], then it is assumed that the deviation is not so important.
Regarding to iron determination in NiS between laboratories CG-RL (figure 4), there is a rotational and translational bias, m = 0,907 4 within the confidence interval [0,857; 0,958] and b = 0,098 7 [0,082; 0,116]. As m = 1 and b=0 do not fall within the interval, this suggests a general systematic error (constant and proportional).
Least-squares linear regression method facilities analyzing the historical database of external controls to obtaining a sufficiently reliable estimate of the overall uncertainty of measurements and the interlaboratory error for these chemical analysis; so, using the prior information available it can be expected less cost than experimental studies. In addition, the results contribute to strategic management decisions as it indicates the laboratory performance compared to other lab.
Nevertheless, the method does not quantify the individual components of uncertainty. When the uncertainty and the interlaboratory error are found to be unacceptable, then action must be taken to reduce the estimate. By replacing devices, carefully examining the equipment and procedures, and by sufficient training of the personnel could results on minimize or eliminate errors of measurements. However, it may be necessary to evaluate individual effects of mineralogy, particle size, sampling strategy, dilution factor, calibration function, to know which part of the measurement procedure cause the dominant contribution to the overall uncertainty, under conditions to be encountered in the routine use of the procedures such as temperature and moisture.9,19,20
Conclusions
Uncertainty of measurements (Sx0) and the interlaboratory error (ξ) for chemical analysis of cobalt and iron was determined by simple linear regression and t-distribution, resulting for the products:
Nickel Sulfide (NiS)
Cobalt, Sx0 = 0,3 % and ξ = ( 0,60 % in the concentration range [2,8 - 11,2 %]
Iron, Sx0 = 0,16 % and ξ = ( 0,32 %, [1,05 - 3,15 %].
Nickel Oxide (NiO)
Cobalt: Sx0 = 0,03 % and ξ = ( 0,05 %, [0,56 - 1,33 %];
Iron: Sx0 = 0,05 % and ξ = ( 0,09 %, [0,30 - 0,73 %].