


Meu SciELO
 Serviços customizados
Serviços Personalizados
Journal

Artigo
 Inglês (pdf)
 Artigo em XML
 Referências do artigo
 Enviar este artigo por email
Indicadores
-
 Citado por SciELO
Links relacionados
-
 Similares em
SciELO
Similares em
SciELO
Compartilhar

 Permalink
Revista Cubana de Ciencias Informáticas
versão On-line ISSN 2227-1899
Rev cuba cienc informat vol.12 no.4 La Habana oct.-dez. 2018
ARTÍCULO ORIGINAL
Test signal generator for the evaluation of detection algorithms of the number of sources.
Generador de señales de prueba para la evaluación de algoritmos detectores del número de fuentes.
Raydel Ortigueira Ruiz1*
1Facultad Ingeniería en Telecomunicaciones y Electrónica. Universidad Tecnológica de La Habana. Calle 114, # 11901, e/ Ciclovía y Rotonda, Marianao. La Habana. Cuba.
*Autor para la correspondencia: rortiqueira89@gmail.com
ABSTRACT
The aim of this work is to design and implement a computational tool that allows generating, visualizing and configuring test signals required for the evaluation and comparison of detection algorithms of the number of sources. The software designed was based on a source generation model whose components were grouped into two sets: one dedicated to the waveforms generation and another one dedicated to the propagation channel. The programming of these components was done in MATLAB language. The implemented tool has two configurable modes of operation: the first one generates the test signals as a MATLAB function and the second one allows the user to visualize how the waveform of a test signal is formed, through a graphical interface. The proposed software is easy to use since the user only needs basic knowledge of signals to configure it, in addition, it allows creating the same scenarios to test and compare other detection techniques. The tool obtained is a convenient way to obtain test signals when you do not have the adequate equipment to generate them. The graphic interface implemented can be used as a virtual signaling laboratory for engineering students, since it allows observing the waveform that is modified by the elements present in the generation model.
Key words: detection algorithms, source number, test signals generator.
RESUMEN
El objetivo de este trabajo fue diseñar e implementar una herramienta computacional que permitiera generar, visualizar y configurar las señales de prueba necesarias para la evaluación y comparación de algoritmos detectores del número de fuentes. El software diseñado fue basado en un modelo de generación de fuentes cuyos componentes fueron agrupados en dos conjuntos: uno dedicado a la generación de formas de onda y otro dedicado al canal de propagación. La programación de estos componentes fue realizada en el lenguaje MATLAB. La herramienta implementada posee dos modos configurables de operación: el primero genera las señales de prueba como una función de MATLAB y el segundo permite al usuario visualizar como es conformada la forma de onda de una señal de prueba, mediante una interfaz gráfica. El software propuesto es fácil de usar ya que el usuario solo necesita conocimientos básicos de señales para configurarlo, además, permite crear iguales escenarios para poner a prueba y comparar otras técnicas de detección. La herramienta obtenida constituye una conveniente forma para obtener señales de prueba, cuando no se cuente con el equipamiento adecuado para generarlas. La interfaz gráfica implementada puede ser utilizada como laboratorio virtual de señales para estudiantes de ingeniería, dado que permite observar la forma de onda que es modificada por los elementos presentes en el modelo de generación.
Palabras clave: algoritmos detectores, generador de señales de prueba, número de fuentes.
INTRODUCTION
The processing of signals received by sensor arrays can generally be separated into two problems: the first one is to detect the number of sources and the second one is to isolate and analyze the signal produced by each source. Many of the algorithms for separating and processing array signals make the assumption that the number of sources is known a priori and may give misleading results if the wrong number of sources is used, (Qiu et al., 2015; Gao et al., 2015; Li and Liu, 2016; Wang and Zhan, 2015). A good example are the errors produced by many high resolution bearing estimation algorithms (e.g., MUSIC) when the wrong number of sources is assumed. Accordingly, to determine correctly how many signals are present is an important step for processing array signals. That leads to the fact that detector algorithms of the number of sources are often implemented on devices as a previous stage to other algorithms. To carry out a successful implementation, an evaluation process of detector algorithms must be made, which allows to determine what algorithm is the most effective in accordance with the variations of the received signals.
In the consulted references, the algorithms found are tested by using signals whose parameters are not specified with sufficient detail, (Sekmen and Bingul, 1999; Huang et al., 2007; Cheng et al., 2014; Guimarães and de Souza, 2014; Du et al., 2015; Guimaraes et al., 2015; Huang et al., 2015; Tian and Xu, 2015; Yang et al., 2015; Wenzhao et al., 2016; Zarei et al., 2016; Zhang and Chen, 2016). This situation makes it a hard to suitably reproduce the experiments and to achieve similar results to those obtained by the authors. Because of this, it will be difficult for other researchers to check the effectiveness of these algorithms and compare them with others under the same conditions.
Therefore, the aim of this article is to design and implement a computational tool that allows generating, visualizing, and configuring a prototype of a test signal, by means of which the rest of signals can be generated for the assessment and comparison of detector algorithms of the number of sources.
The designed tool has two operation modes: one that works as a MATLAB function and another one that works as a visualization tool. In both modes, they are generated in-phase and quadrature components whose waveforms are modified according to a configuration set.
MATERIALS Y METHODS
The generation model of test signals that was proposed for designing this software is part of a simulation diagram that aims at evaluating the performance of detector algorithms, in accordance to the variations of the received signals (Figure 1). This diagram is made up of two stages: the receiver stage where a digital signal processor works and the source generator stage which contains the proposed generation model. The components belonging to the model were grouped into two collections: one dedicated to the waveform generation and another one dedicated to the propagation channel. For simplicity, the components are a generator of binary polar non return to zero signals (NRZ), a generator of In-phase and Quadrature components (I & Q), a Raised Cosine Filter (RCF), a Multipath Fading channel and an Additive White Gaussian Noise channel (AWGN).
Baseband signal
When several messages are transmitted, they are first encoded into a sequence of bits called baseband signal. This sequence is grouped into k bits to form M symbols, where M=2k. A system using a symbol set size of M is referred to as an M-ary system. The duration of one symbol is denoted as Ts and Tb is the time that it takes to send 1 bit of data, both are related by Ts =kTb. The bit rate and the symbol rate of the binary signal are Rb = 1/Tb and Rs = 1/Tb, respectively, where Rs =Rb/k. Multilevel NRZ line code was selected to represent the waveform of the baseband signal (Couch, 2012)
Bandpass modulation
Bandpass modulation can be defined as the process whereby the amplitude, frequency, or phase of a carrier wave, or a combination of them, is varied in accordance with the information to be transmitted. This bandpass signal is called the modulated signal, and the baseband source signal is called the modulating signal. As a result of that, bandpass digital modulation is known as the process by which shaped pulses, that represent digital symbols, modulate a carrier wave.
Any modulated bandpass digital signal can be expressed in the general quadrature-carrier form
![]()
where fc is the carrier frequency and g(t)is known as the complex envelope and expressed as
![]()
Here, xi(t) and xq(t) are called time variant in-phase and quadrature components and both contain the baseband modulating signals. These components are represented by
![]()
where p(t) is the symbol pulse shape and is expressed as
![]()
In and Qn denote amplitude discrete levels that correspond to the desired modulation type. These levels represent the n-th symbols in the message sequence, so the amplitudes belong to a set of M discrete values (Couch, 2012).
In-phase and Quadrature amplitude discrete levels for M-ary PSK and M-ary QAM
The M-ary PSK (Multilevel Phase Shift Keying) and the M-ary QAM (Quadrature Amplitude Modulation) modulations were mainly selected for designing this software for being used in the data modulation of the wireless communications system Long Term Evolution, although these modulations are also used in other wireless communication services.
In M-ary PSK modulation, the modulating data signal shifts the phase of the bandpass waveform to one of M states, where each of them has a duration Ts. The In and Qn amplitude discrete levels to generate modulated signal waveform are obtained by

In M-ary QAM, the modulating data signal varies the phase and the amplitude of the carrier wave to one of M states. To generate the In and Qn amplitude, discrete levels belonging to this modulation, the transmitted symbols are partitioned into two streams of equal length. Each obtained subsequence is converted into an amplitude discrete level that forms a set of µ possible amplitudes. The obtained amplitudes from each subsequence are taken as In and Qn levels and are represented by
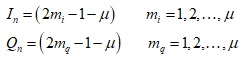
where mi and mq denote the possible amplitudes corresponding to each In and Qn subsequence, respectively. To design this software, it was taken the relationship M=µ2 to provide a square constellation modulation (Carlson et al., 2002)
Raised Cosine Filter
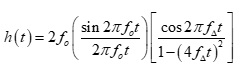
RCF is defined as a low pass filter used to restrict the bandwidth of the rectangular multilevel pulses and to minimize the intersymbol interference when they pass through a communication system. Its impulse response and its frequency response are given by

![]()
where fo is the 6-dB bandwidth of the filter, B is the absolute bandwidth and R is the Rolloff factor, which is defined as fractional excess bandwidth with respect to fo.
Multipath Fading and Additive Gaussian Noise Channels.
In a wireless mobile communication system, a signal can travel from transmitter to receiver over multiple reflective paths. This phenomenon is known as multipath propagation, which can cause fluctuations in the received signal’s amplitude, phase, and angle of arrival, thus causing the so called multipath fading. The multipath fading channels have a time variant impulse response that is produced by constantly changing physical characteristics of the media. The chosen multipath fading manifestation for this software was Rayleigh fading, since it is mainly a multipath fading produced in absence of a line of sight between the transmitter and the receiver. The channel used is based on a discrete multipath channel known as the tapped-delay-line (TDL) channel model, which basically works as a lowpass filter. (Iskander, 2008; ITU-R, 2017)
The Additive White Gaussian Noise channel is obtained by generating Gaussian random number using a MATLAB function known as randn. A variance for random variable is computed starting from signal to noise ratio and signal average power at the channel input.
Programming language and develop environment.
MATLAB is a high level language and interactive environment for numerical computation, visualization, and programming. It offers an integrated developing environment, which is available for UNIX, Windows, Mac OS X and GNU/Linux platforms. It was chosen for this software because it allows the implementation of algorithms, the creation of graphical interfaces, the communication with programs on other languages and with other hardware devices and it enables to reach solutions faster than traditional programming languages, such as C/C++ or Java.
RESULTS Y DISCUSSION
System modules
This section describes the results of applying the mathematic models which were presented in the previous section. For carrying out the design of this software this paper proposes the following modules:
-
IQ_levels: It converts binary data stream to In and Qn amplitude discrete values according to the selected modulation.
-
RCF: It makes the impulse and frequency responses of the Raised Cosine Filter.
-
Multipath_ch: It makes the impulse responses of the Multipath Rayleigh Fading Channel for which ten paths and an attenuation among paths of 1dB were assigned.
-
AWGN_ch: It adds white Gaussian noise according to input signal power and signal to noise ratio.
-
PolarNRZ_wf: It generates the binary polar NRZ waveform associated with a generated bits stream.
-
IQ_wf: It returns the in-phase and quadrature components waveform associated with the corresponding In and Qn amplitudes.
-
RCF_wf: It allows the in-phase and quadrature components waveform to pass through the designed Raised Cosine Filter.
-
Gaussian_wf: It allows the in-phase and quadrature components waveform to pass through the Additive White Gaussian Noise Channel.
-
Fading_wf: It allows the In-phase and Quadrature components waveform to pass through the Multipath Rayleigh Fading Channel.
-
Quadrature_wf: It generates the bandpass signal waveform by using a quadrature modulator.
-
Graphics: It has all the functions to generate each graphic from the interface menu.
Components Diagram
The component diagrams are used to structure the implementation model in terms of implementation subsystems and show the relationships among the implementation elements. The diagram associated with the proposed tool is shown in Figure 2.
Modes of operation
A MATLAB function was created called signal_generator, which is composed by two operation modes, two configuration objects and several M files that support it. The signal_generator function has three input arguments; the first one is the Mode argument whose values are assigned as 0 or 1 to establish the Generator or Interface modes, respectively, and the other two are configuration objects created by the transmission and channel functions. The signal_generator function is shown below
sg = signal_generator(Mode,ht,ch);
To use the signal_generator function as an interface, the Mode variable must first be set to 1, this is needed to store the quantities used in the visualization. In this mode, the signals visualization tool is opened up, which allows the user to visualize several graphics associated with the signal generation process. To use the signal_generator function as a generator, the Mode variable must be set to 0. In this mode, the generated in-phase and quadrature components are only returned after being modified through generator components. Figure 3 illustrates how the signal_generator function is used in both modes.
Interface mode
Figure 4 shows a snapshot of the visualization tool, which allows the user to visualize several quantities associated with the configuration objects. The interface consists of several sections: two dedicated to configure the propagation channel and transmission parameters, three dedicated to choose and visualize impulse and frequency responses belonging to Raised Cosine Filter used on the transmission configuration, and one dedicated to choose the graphics that correspond to the signal generation stages.

Graphics generated by the interface
Figure 5 is a snapshot of the user interface where the graphic menu generated by the tool is shown. As it can be seen, there are 6 kinds of graphics: five for the graphic menu and one dedicated to show impulse and frequency responses belonging to Raised Cosine Filter, according to the chosen Rolloff factor.
Then, all graphics produced by the tool will be shown, for which the configuration values on the previous snapshot were taken. Figure 6 shows a random binary data stream represented as a Polar NRZ signal, the In-phase and Quadrature components waveform associated with binary data stream and its corresponding spectrums. Figure 7, Figure 8 and Figure 9 have two rows where each of them represent the same components waveform from Figure 6 together with their spectrums, before and after being modified by the model components. Figure 7 illustrates the signals filtered by the selected Raised Cosine Filter, where new waveforms have restricted bandwidths and rounded tops instead of flat levels. Figure 8 shows the fluctuations produced by constantly changing physical characteristics of the Multipath Rayleigh Fading Channel on the components waveform. Figure 9 shows the effect of the Additive White Gaussian Noise Channel on components waveform where it is clearly seen how the signals are altered with more severity, what is also observable in the components spectrum. Figure 10 illustrates the components waveform and their corresponding amplitude modulations and Figure 11 shows components waveform after passing through the quadrature modulator together with their spectrums. Figure 7, Figure 8, Figure 9 are of own elaboration.


The signals generated by this software constitute a good approach to the signals received by any receiver. The proposed tool allows users to configure and watch the signals generation process and to choose those that will be used in the algorithms evaluation. Accordingly, users can also store the samples belonging to these signals in DAT-files, what later allows modifying their average powers varying their amplitudes. In addition, these modified and stored samples can be handled by other software based on MATLAB or imported by any programmable logic device that is compatible with this type of files.
CONCLUSIONS
The software developed provides a convenient way to get test signals, when the suitable devices to generate them are not available. The implemented graphical interface is easy to configure since the user only needs basic knowledges about signals; in addition, it allows watching the waveform which is modified by present elements in the generation model, so it can be used as a virtual signal laboratory for engineering students.
The detector algorithms created by the scientific community can now be tested by using signals whose parameters can be specified with enough details. This software will allow the suitable reproduction of the experiments and the achievement of similar results to those obtained by the authors. As a result, it will be easier for other researchers to check the effectiveness of these algorithms and compare them with others under the same conditions.
REFERENCES
CARLSON, A.B.; CRILLY, P.B.; RUTLEDGE, J.C. Communication Systems. Fourth ed; 2002.
CHENG, Q.; PAL, P.; TSUJI, M.; HUA, Y. An MDL algorithm for detecting more sources than sensors using outer-products of array output. IEEE Transactions on Signal Processing. 2014; 62(24):6438-6453.
COUCH, L.W. Digital and Analog Communication Systems. Eighth ed; 2012
DU, F.; LI, Y.; JIN, S. Statistical Analysis of the Performance of MDL Enumeration for Multiple-Missed Detection in Array Processing. Sensors. 2015; 15(8):20250-20266.
GAO, Y.; XU, J.; JIA, X.; LONG, T. A novel joint method for source number and DOA estimation for closely spaced sources. IEEE China Summit and International Conference on Signal and Information Processing (ChinaSIP): IEEE; 2015. p.128-131.
GUIMARÃES, D.A.; DE SOUZA, R.A. Simple and efficient algorithm for improving the MDL estimator of the number of sources. Sensors. 2014; 14(10):19477-19492.
GUIMARÃES, D.A.; SOARES, P.M.; DE SOUZA, R.A.A. An Empirical Method for Estimating the Number of Signal Sources. IEEE Latin America Transactions. 2015; 13(7):2057-2064.
HUANG, L.; QIAN, C.; SO, H.C.; FANG, J. Source enumeration for large array using shrinkage-based detectors with small samples. IEEE Transactions on Aerospace and Electronic Systems. 2015; 51(1):344-357.
HUANG, L.; WU, S.; LI, X. Reduced-rank MDL method for source enumeration in high-resolution array processing. IEEE Transactions on Signal Processing. 2007; 55(12):5658-5667.
ISKANDER, C.D. A MATLAB-based object-oriented approach to multipath fading channel simulation. Hi-Tek Multisystems. 2008; 21.
ITU-R. Multipath propagation and parameterization of its characteristics In: Union, I.T., editor. Vol. P.1407-6 (06/2017); 2017.
LI, Y.; LIU, C. An improved estimation algorithm of the source number with fewer sensors than sources. 2016 Progress in Electromagnetic Research Symposium (PIERS): IEEE; 2016. p. 4981-4985.
QIU, Z.; HE, Z.; CUI, M. A method for signal source number estimation based on MUSIC algorithm. International Conference on Communication Problem-Solving (ICCP): IEEE; 2015. p. 344-346.
SEKMEN, A.S.; BINGUL, Z. Comparison of algorithms for detection of the number of signal sources. IEEE Southeastcon'99 Proceedings IEEE; 1999. p. 70-73.
TIAN, Y.; XU, H. Extended-aperture DOA estimation with unknown number of sources. Electronics Letters. 2015; 51(7):583-584.
WANG, R.; ZHAN, Y. A method of dynamic DOA estimation with an unknown number of sources. IEEE International Conference on Mechatronics and Automation (ICMA): IEEE; 2015. p. 104-109.
WENZHAO, Z.; SHENGGUO, S.; ZHONGRUI, Z.; JINWEI, S. Detection of Number of Source and DOA Estimation in Phase-Mode Space Using Uniform Circular Acoustic Vector Sensor Array. 2016 6th International Conference on Instrumentation & Measurement, Computer, Communication and Control (IMCCC): IEEE; 2016. p.361-365.
YANG, X.; LI, S.; HU, X.; ZENG, T. Improved MDL method for estimation of source number at subarray level. Electronics Letters. 2015; 52(1):85-86.
ZAREI, A.; GHASSEMI, F.; MORADI, M.H. Information based source number estimation for probabilistic common spatial pattern in motor imagery BCI system. 24th Iranian Conference on Electrical Engineering (ICEE): IEEE; 2016. p. 555-560.
ZHANG, G.; CHEN, H. Source number estimation algorithm based on wide-band compressed sensing. IEEE Information Technology, Networking, Electronic and Automation Control Conference: IEEE; 2016. p. 216-219.
Recibido: 06/11/2017
Aceptado: 12/10/2018

