


Meu SciELO
 Serviços customizados
Serviços Personalizados
Artigo
 texto em
  Inglês (pdf)
 Artigo em XML
 Referências do artigo
 Enviar este artigo por email
Indicadores
-
 Citado por SciELO
Links relacionados
-
 Similares em
SciELO
Similares em
SciELO
Compartilhar

 Permalink
Revista Cubana de Ciencias Forestales
versão On-line ISSN 2310-3469
Rev CFORES vol.11 no.2 Pinar del Río maio.-ago. 2023 Epub 02-Set-2023
Original article
Ecological vulnerability in a low altitude rainforest on metamorphic rocks
1Universidad de Guantánamo. Guantánamo, Cuba.
The research was carried out in a low altitude rainforest on metamorphic rocks, Baracoa Conservation Department, Alejandro de Humboldt National Park (PNAH), in the period from January 2020 to December 2022, with the objective of evaluating ecological vulnerability through the modification of the methodology established by the Civil Defense. Previously in 2015, some researchers established and geo-referenced 36 plots of 0.05 hectares. In those 36 plots selected the number of individuals by species and by strata were determined. The structural parameters, the ecological importance value index, and the Simpson index were characterized. The results showed that the analysis of floristic diversity facilitated the assessment of the structure, composition and behavior of the forest. The use of the proposed indicators was feasible for the evaluation of ecological vulnerability in the forest; the methodological proposal was modified from ecological indices with output in thematic maps, to plan rehabilitation and restoration actions. The forest presented low ecological vulnerability. The species Hibiscus elatus. Sw, Calophyllum antillanum. Britton, Guarea guara. Jacq, and Jambosa vulgaris DC were the least vulnerable taxa, and the most vulnerable Mangifera indica L, Ocotea leucoxylon. Sw, Zanthoxylum martenicense. L and Brya ebenus. L.
Key words: Structural parameters; ecological indices; floristic diversity; structure and composition.
INTRODUCTION
The vulnerability analysis is the first measure of a management process focused on adaptation to climate change (EMNDC, 2017). The United Nations (UN), the United Nations Environment Program (UNEP) and the United Nations Development Program (UNDP) have called for a radical change in development practices, where emphasis is placed on disaster prevention and risk reduction as an effective method for the protection of development; they work on projects to reduce vulnerability as a result of human actions and growing climate change (ONU, 2019).
The humid forests of the eastern region of Cuba are key sites for conservation because they harbor high values of endemism and biodiversity. However, this type of ecosystem could suffer the effects of climate change by causing changes in its composition, structure and distribution (Fuentes et al., 2020), they also explain that knowledge of these valuable ecosystems implies the design of mechanisms that enables adequate management and conservation of their potential, understanding their different ecological and structural aspects, which will allow to effectively guide the successful management of these types of forests.
Although there is a methodological guide issued by the National Civil Defense Staff (EMNDC, 2017), with the aim of establishing methodological procedures that guarantee the development and control of the disaster risk assessment process; this guide does not take into account the evaluation of ecological vulnerability in the forestry sector, for which it is necessary to specify in other spheres or disciplines related to the components of the environment, since through its modification it is possible to carry out an evaluation of ecological vulnerability in low altitude rainforests on metamorphic rocks.
MATERIALS AND METHODS
The research was took place in a low altitude rainforest on metamorphic rocks, in the Baracoa Conservation Department, Alejandro de Humboldt National Park, Guantánamo province, from January 2020 to December 2022, in 60 ha and a total population size of 1000 ha (Figure 1).

Fig. 1. - Low altitude rainforest on metamorphic rocks, Baracoa Conservation Department, Alejandro de Humboldt National Park
Climate: the climate is tropical rainy, and rainfall is between 2,000 and 3,600 mm per year. The soils are typical Ferralitic Red Leached or Ferralitic Yellowish Leached (Reyes and Acosta, 2005), cited by Álvarez (2017).
Floristic inventory
0.05 ha obtained by Sánchez (2015) and the ecological importance index (IVIE) were used. For the mapping, satellite images from 2015 and 2019 were used, the preparation of thematic maps at a scale of 1:25,000 related to vulnerability, using the Super Maps software. (See 8.1.4.8)
For the vertical structure, the tree species of the low, medium and high strata were used (Finol, 1971), evaluating the Relative Sociological Position (PSr) (Finol, 1976). The determination of environmental vulnerability was made based on the results of the Simpson index (Sánchez, 2015).
Ecological vulnerability analysis
The Methodologies proposed by Delgado et al. (2016) and Noguera (2017), where qualitative and quantitative evaluation techniques were combined, through the use of indicators, as well as the assignment of evaluation ranges, and the criteria proposed by EMNDC (2017), adapted by the author to the forest context.
Analysis of environmental vulnerability indicators
It was carried out according to criteria issued by Delgado et al. (2016), based on indicators of sensitivity, exposure and adaptability. It was evaluated using the ecological importance value index (IVIE) (Sánchez, 2015); taking into account the description of the biodiversity of the forest. To determine the sensitivity levels, we started from what was proposed by Delgado et al. (2016) and Noguera (2017), adapted into non-sensitive, moderately sensitive and sensitive.
Based on the IVIE (Table 1), evaluation ranges were established for its classification, through the use of weighted quantitative criteria according to EMNDC (2017), modified in this research. The qualitative ones are shown in annex 1.
Table 1. - Classification ranges for sensitivity
| evaluation ranges(IVIE) % | Sensitivity Level | weighted value |
| ≥90 | not sensitive | 1 |
| >50 and <90 | Moderately Sensitive | 3 |
| ≤50 | sensitive | 5 |
Source: modified by the author.
Exposure (E): was evaluated through the interpretation of the IVIE, establishing that the exposure of a species is directly proportional to the results of the ecological importance value index, that is, the higher the IVIE values, the greater its exposure before any disturbing phenomenon. A qualitative evaluation scale was used (Annex 2). Weighted quantitative criteria were used for the evaluation (Table 2).
Table 2. - Exposure classification ranges
| Evaluation ranges (IVIE) | Exposure Level | weighted value |
| ≥90 | high | 5 |
| >50 and <90 | Half | 3 |
| ≤50 | Low | 1 |
Source: modified by author.
Adaptive capacity (Ca): It was carried out according to the results of the Simpson Index (D), which expresses dominance. The values of (D) oscillate between 0 and 1, for its interpretation the following criteria were taken into account: if the value of (D) is equal to 0, it means infinite diversity. If the value of (D) is equal to 1, there is no diversity (Briceño, 2019).
A diversity analysis was conducted by determining the index per plot, defending the criterion that: a high diversity favors the adaptation capacity of the species in the ecosystem and, therefore, decreases their environmental vulnerability. Quantitative (Table 3) and qualitative (Annex 3) evaluation ranges were used.
Table 3. - Classification ranges of adaptive capacity
| Simpson index ranges | Adaptability | weighted value |
| 0.61 - 1.00 | Low | 1 |
| 0.31 - 0.60 | Half | 3 |
| 0.00 -0.30 | high | 5 |
Source: modified by the author.
Environmental vulnerability assessment (Va): It was evaluated based on the indicators: exposure, sensitivity and adaptability (Annex 4). A general mathematical equation was applied, adapted for the calculation of environmental vulnerability (Va), based on the conceptual proposal made by Delgado et al. (2016), according to the equation: Va= (S + Ex) Ca (1).
Where: Va: environmental vulnerability, S: sensitivity, Ex: exposure, Ca: adaptive capacity. To determine the levels of vulnerability (Table 4) of the species and plots. Environmental indicators related to biodiversity were assessed. Each factor was given values of 1, 3 and ≥ 5 that classify the low, medium and high behavior of environmental vulnerability.
Table 4. - Environmental vulnerability assessment ranges
| evaluation ranges | Vulnerability level |
|---|---|
| 1 | Low Vulnerability |
| 3 | Medium Vulnerability |
| ≥5 | High Vulnerability |
Source: Modified by the author.
Assessment of structural vulnerability (Ve): the structural values obtained by establishing a relationship of the Relative Sociological Position of each species were taken into account, according to the formula: Ve= PSr (2).
Where: PSr = Relative Sociological Position.
The values of the sociological position are interrelated with structural vulnerability (Table 5). Each factor was given values of 1, 3 and 5 that classify the quantitative behavior of vulnerability. The qualitative interpretation is presented in Annex 5.
Table 5. - Ranks of classification of the Relative Sociological Position
| PSr ranks | Structural vulnerability | weighted value |
| 0.61 - 1.00 | Low | 1 |
| 0.31 - 0.60 | Half | 3 |
| 0.0 -0.30 | high | 5 |
Source: modified by the author.
Ecological Vulnerability Assessment (Vec): the methodology proposed by Delgado et al. (2016)was used and Noguera (2017), modified in this research. It was carried out by adding the results of the analysis of environmental and structural vulnerability, according to the formula: Vec = Va + Ve (3).
Where: Vec: ecological vulnerability, Va: environmental vulnerability, Ve: structural vulnerability. A double entry analysis matrix was used, by combining the behavior of environmental and structural vulnerability. Based on the idea that: the higher the level of environmental vulnerability and the same structural vulnerability, the plots and species contained in them must be ecologically vulnerable (Table 6). The qualitative interpretation is presented in Annex 6.
RESULTS AND DISCUSSION
Number of individuals in the different strata of the forest
The herbaceous stratum had 648 individuals, the shrubby 589 and the arboreal 95. The most abundant species in relation to individuals in the herbaceous were C. utile (93), H. elatus (79) and J. vulgaris (61). The shrub presented abundance of G. guara (65) and H. elatus (36), and the tree H. elatus (32) and Carapa guianensis. Auble (16). These results corroborate what was reported by Assef (2020) in rainforests in eastern Cuba, highlighting the predominance of the herbaceous stratum with more than 500 individuals, followed by the shrub and tree strata with 583 and 94 individuals. This ecosystem is very rich in species, highlighting the herbaceous stratum. Although in the studies of species richness and endemism of the eastern rainforests, trees constitute the second most important habit of life, but in the rainforests on metamorphic complexes, they are predominant (Martínez, 2012).
Structural values of the forest
The most important species due to their IVIE represent 13.33 % of the recorded flora, H. elatus occupies the first place by presenting the highest value of abundance and relative frequency, followed by Calophyllum utile. Bisse, Sapium laurifolium. Griseb, G. guara, J. vulgaris and Terminalia catappa. L. These taxa accumulate among themselves 33.50 % of the value of ecological importance in the ecosystem, occupying the first six positions.
J. vulgaris is the most dominant, it could be due to its frequency and abundance, since it regenerates quickly, colonizing the forest, transforming its composition and structure (Sánchez, 2015). The rest of the species that are located up to the tenth ecological position presented similar values between them. These results coincide with Fuentes et al. (2020), stating that some of these species are transformative of the floristic composition and structure of the forest and that they constitute a significant threat to many endemic species of the eastern region.
Vertical stratification of the forest
The lower stratum is represented by: J. vulgaris with 61 individuals for 13.38 %, G. guara with 38 individuals and 8.33 %, H. elatus and T. catappa with 36 and 34 individuals for 7.89 and 7.45 %. The middle stratum is represented by C. utile with 93 individuals and 11.82 %, H. elatus with 79 individuals for 10.04 %, G. guara with 65 individuals and 8.26 % and S. laurifolium with 48 individuals and 6 10 %, T. catappa with 43 individuals and 5.46% and the upper stratum is represented by H. elatus with 32 individuals and 36.68%, C. guianensis with 16 individuals and 16.84 %, Cedrela odorata. L, S. laurifolium and Cocos nucifera. L with 8 individuals and 8.42 %. The results show unequal distribution in the number of individuals in the height classes.
These results coincide with the observations made by Reyes (2018), where the predominance of shrubs stands out among the life habits in the rainforests and that H. elatus, C. guianensis, and C. odorata constitute the most abundant species in the upper stratum.
Sociological position of the species present in the forest strata
In the lower stratum, 75.55 % of the species are shared by the middle stratum and 26.66 % by the upper one, the same value is shared by the middle stratum with the upper one. The upper one presents non-continuous vertical distribution patterns, since few species are shared in the other strata, only 12 species of the 45 inventoried presented continuous vertical distribution.
These results confirm what was stated by Finol (1971) that the more regular the distribution of the individuals of a species in the vertical structure of a forest (gradual decrease in the number of trees as you go up from the lower to the upper stratum), the greater will be the value in the phytosociological position.
H. elatus, C. utile, G. guara, S. laurifolium, Z. martinicense, and C. guianensis had the highest sociological value (PSr) and, at the same time, the highest continuous distribution.
Ecological vulnerability assessment. Sensitivity
Of the 45 registered species, 39 were evaluated as sensitive for 87 %, for presenting IVIE values ≤50 %. C. occidentalis, S. mammosum , S. laevis , B. ebenus , and Ps. guajava. These results could be given by the extraction of timber and non-timber forest products, opening of roads, which provide a decrease in the density of trees, changes in their microclimatic state and in the floristic composition of the forest.
H. elatus, C. utile, S. laurifolium, G. guara, J. vulgaris and T. catappa, are evaluated as moderately sensitive because they have IVIE values >50 and <90 for 13 %. Sánchez (2015) reported that the practice of slashing, slashing, and burning produce unfavorable changes in the structure and composition of species, and in the biodiversity of the forest.
Similar results were obtained by Fuentes et al. (2020) in studies of the cloud forest of the Sierra Maestra, where they highlighted sensitivity when expressing that the succession process is very slow and complicated. They also highlighted the importance of protecting this formation from the effects of climate change and anthropic actions that influence the increase of the ecological vulnerability of forests.
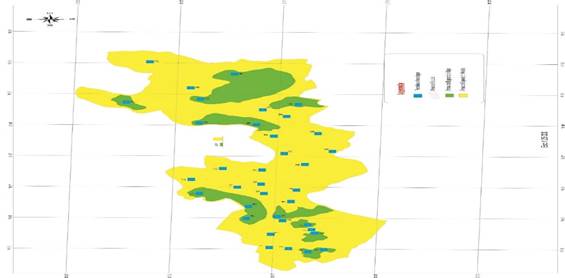
By establishing in the plots, the sensitivity evaluation based on the representativeness by species, it was obtained that plots 1, 2, 4, 6, 7, 9, 10, 11, 12, 14, 15, 22, 23, 24, 25, 26, 27, 30, 32, 33, 34 and 36 were evaluated as moderately sensitive with 61.1% as they included the largest number of species with the same classification.
Plots 3, 5, 8, 13, 16, 17, 18, 19, 20, 21, 28, 29, 31, and 35 are classified as sensitive, because they present sensitive species with 38.9 % and, therefore, the same classification criteria is inferred. These results corroborate what was stated by Fuentes et al. (2020), where they alert the probable direction of the effect of climate change in the future. This constitutes a significant threat to many endemic species in the eastern region, even in the mitigation scenario.
The evaluations obtained were used to map the areas based on the degree of sensitivity (Figure 2). The predominance of moderately sensitive areas is observed, which are characterized by being generally made up of plots and species with a medium degree of sensitivity.

Exposure
87 % of the species presented a low level of exposure with IVIE values ≤ 50 %. Of the 39 included in this range, C. occidentalis, S. mammosum, S. laevis, B. ebenus, and Ps guajava stand out for low values of ecological importance value index. The species with a low level of exposure are characterized by being less abundant, frequent and dominant, they are the least representative of the area and, therefore, it is induced that they will have few variations in their original structure, functioning and floristic composition of the forest.
Similar results coincide with Assef (2020), reporting 97 % of the species with low level of exposure in rainforests in eastern Cuba, and that these taxa present few variations in the structure and floristic composition of the forest.
At the same time, 13 % exhibit a medium level of exposure, for presenting IVIE values >50 and <90. H. elatus, C. utile, S. laurifolium, G. guara, J. vulgaris and T. catappa were the most representative. These species are characterized by having average values of abundance, frequency and relative dominance, they are moderately represented and exposed in the stand, they may present moderate changes in the original structure.
These results are corroborated by Fuentes et al. (2020), in studies of vulnerability of forests and their environmental services to climate change, when analyzing the effects of climate change in humid forests in eastern Cuba. They reported that the lowest exposure values are associated with protected areas and with little loss of forest wealth.
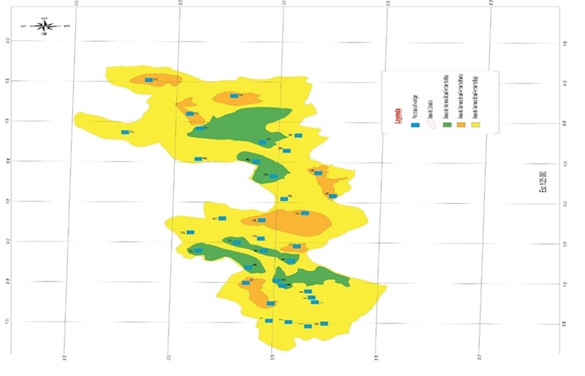
Plots 3, 5, 8, 13, 16, 17, 18, 19, 20, 21, 28, 29, 31 and 35 presented low exposure, with 38.9 % of their value, because they contained the least exposed species in the forest, and thus the same classification criteria is derived. 1, 2, 4, 6, 7, 9, 10, 11, 12, 14, 15, 22, 23, 24, 25, 26, 27, 30, 32, 33, 34, and 36 have a medium level of exposure with 61.1%, for having included the largest number of species with the same classification.
Figure 3 represents the geospatial behavior of the exposure in the study area. The forest exhibits a predominance of areas with a medium level of exposure; however, there are areas with low exposure, characterized by small values of abundance, frequency and relative dominance of the species, since they present few variations in their original structure and floristic composition.
Many of the species studied, which present low exposure, are located in restricted distribution areas, and infer susceptibility to variations in the structure, composition and function of the forest. The latter are among the ecosystems with the highest number of threatened species on the island, according to González-Torres et al. (2016b) on the state of conservation of Cuban flora.
Adaptability
Plots 1, 2, 3, 5, 6, 8, 12, 13, 16, 22, 23, 26, 28, 30, and 31, according to the values of the Simpson Index (D), presented high adaptability, for 41.7 %, related to the diversity of species with values ranging between 0.0-0.30. These plots stand out for favoring natural balance in the ecosystem, they have greater potential in the generation of ecosystem services as a representation of the functionality of the species contained in the diversity.
The aforementioned corroborates the results reported by Fuentes et al. (2020), most of the global centers of diversity are located in the mountainous regions of the humid tropics, a product of which ideal climatic conditions and high levels of geodiversity coincide. Several studies have shown that more diverse ecosystems are more resilient. A similar condition was reported by Martínez (2012) in a study of the rainforests in the eastern region, stating that the existence of high biological diversity is due to the heterogeneity of habitats.
At the same time, plots 4, 7, 14, 17, 18, 19, 24, 25, 32, 33, and 34, assume medium adaptation capacity, with 30.6 %, related to their biodiversity, will have few changes in the original structure without altering the indicators of floristic diversity, and a medium potentiality in the generation of ecosystem services.
Plots 9, 10, 11, 15, 20, 21, 27, 29, 35, and 36 presented low adaptation capacity for 27.7 %; this indicates that they lack a natural balance, exhibit a low range of ecosystem services, and therefore the possibility of adaptation of the species is lower. These behaviors could be given by the autonomous adaptation capacity of the ecosystem, which depends a lot on its state and other non-climatic pressures. For example, the degradation or fragmentation of the forest due to anthropic pressures reduces its resilience, such is the case of highly fragmented forests in urban areas and isolated forest patches.
In a study of the biodiversity of the woody flora in the PNAH rainforest, Caraballo et al. (2020), state that the areas that present less diversity and few elements in common, are located in the most anthropized sites, where inappropriate silvicultural practices were applied, an action that led to the loss of important elements in the forest's biodiversity.
In the evaluation of this indicator by species H. elatus, J. vulgaris, G. guara, C. utile, T. catappa, S. laurifolium had a high adaptation capacity (71.2 %), standing out for having greater representativeness.
M. indica, Eucalyptus sp., Dendropanax arboreus. L, P. aduncum. L, E. tinifolia. L, Lonchocarpus domingensis. and C. aurantium present low adaptation capacity for 15.5 %, when taking the same evaluation criteria of the plots that contain them. The rest of the species that are not included in the previous classifications and make up 13.3 %, show medium adaptation capacity, for having the same biodiversity values, which stand out: Ocotea leucoxylon. Sw, S. mammosum, C. occidentalis, B. ebenus, P. guajava, and S. laevis.
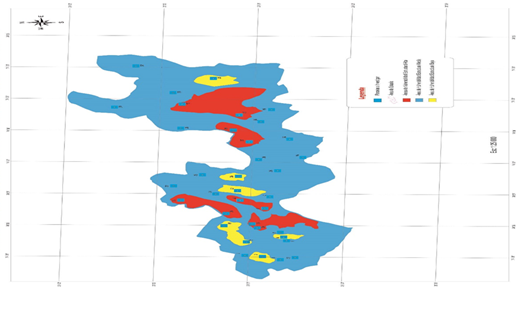
The behavior of the adaptive capacity depending on the areas, was represented by means of a map (Figure 4), observing a predominance of areas with high adaptive capacity, a condition that favors survival and stability in most species, and therefore, a natural balance in the ecosystem and greater potential in the generation of ecosystem services that they provide. The adaptation capacity based on the diversity of species, allowed understanding the vulnerability of specific ecosystems in the environmental gradients and constitutes one of the bases of management for adaptation.

Vulnerability assessment (Va)
In the results by species, low environmental vulnerability was observed with 33 taxa, followed by 6 medium vulnerabilities, and the same value for high environmental vulnerability. H. elatus, C. utile, S. laurifolium, G. guara, J. vulgaris, and T. catappa were the most representative species. These are identified as having medium sensitivity and exposure, with a high capacity for adaptation; qualities that give it the possibility of an environmental balance within the ecosystem; by contrast M. indica, E. sp, C. aurantium, L. domingensis, E. tinifolia, and P. aduncum present high vulnerability, because they are sensitive with a low level of exposure and the same adaptive capacity.
S. mammosum, C. occidentalis, B. ebenus, O. leucoxylon, P. guajava and S. laevis show medium environmental vulnerability.
In the evaluation of environmental vulnerability, plots 1, 2, 3, 5, 6, 8, 12, 13, 16, 34, and 35, were evaluated with low environmental vulnerability for 41.8 %, represented mostly by Species with medium values of exposure and sensitivity, together with high adaptability. This classification deduces the predominance of a favorable environmental conservation status, due to the existing degree of biodiversity because they are located in high areas and difficult to access.
The sampling units 9, 10, 11, 15, 20, 21, 27, 29, 35, and 36 present high environmental vulnerability for 30.5 %, generally determined by the combination of moderately exposed and sensitive species, together with low adaptive capacity, as well as sensitive species, with low exposure and the same adaptive capacity. Plots 7, 14, 19, 24, 25, 32, 33, and 34 present medium environmental vulnerability (27.7 %). These present average values of exposure, sensitivity and average adaptation capacity.
These results could be mainly associated with access roads, housing construction, poaching of timber species and crops of introduced species such as C. nucifera. Similar results were obtained by Delgado et al. (2016), in the analysis of vulnerability in mountain forests in Latin America.
To a lesser extent, there were five areas with high environmental vulnerability, where plots 9, 10, 11,15,17, 20, 21, 27, 29, 35 and 36 are located, they are susceptible because they have sensitivity and medium level of exposure with low adaptability. The high level of environmental vulnerability that they exhibit is directly related to potential alterations in the environmental services that they provide, for example, those linked to biodiversity (aesthetic, cultural services, provision of goods such as genetic resources).
These results are corroborated by the UN (2019), referring to the fact that vulnerability is given by certain environmental conditions, factors or processes, which increase the susceptibility of a community to the impact of threats.
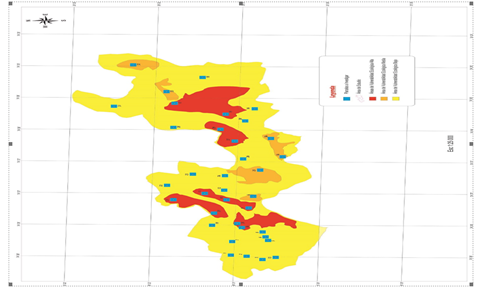
In the mapping of the results by areas (Figure 5), it was observed that low environmental vulnerability is the one that occupies the greatest extension, since it includes the most dominant and indicator species, the ones that will best adapt to the edaphoclimatic conditions of the area, guaranteeing them a greater probability of survival, a condition that favors the environmental behavior of the forest.
Environmental Vulnerability Assessment (Ve)
According to the results of the relative sociological position, of the total number of species inventoried, 25 present high structural vulnerability with PSr values ranging between 0.0-0.30, representing 55.6 %. Acalypha diversifolia. Jacq, Casasia calophylla. A, O. leucoxylon, M. indica, S. mammosum, B. ebenus, and C. aurantium were the most representative. These species are not distributed regularly in all strata, their distribution pattern is not continuous, since they do not have a guaranteed place in the structure and floristic composition of the forest.
Likewise, 16 species show medium structural vulnerability, because they are located in PSr ranges between 0.31-0.60, and for 35.5 %. Among the most distinctive are A. inermisse, S. laurifolium, T. catappa, Z. martenicense, Roystonea regia. HBK and E. sp; for being distributed regularly in some strata, and presenting an intermediate place in the structure and composition of the forest.
H. elatus, C. utile, G. guara and J. vulgaris make up the four species with low structural vulnerability for 8.9 %, they are characterized by being distributed regularly in all strata, with a continuous distribution pattern and, therefore, they have a guaranteed place in the structure and floristic composition.
Plots 9, 10, 15, 17, 20, 21, 27, 29, 35 and 36 exhibit high structural vulnerability for 27.8 %, determined from the relationship that exists between the species that have a Psr less than 0 .30. They are identified for being located in anthropized areas, with the insertion of secondary vegetation for economic purposes, as well as being close to populated points that exploit forest services.
On the contrary, sampling units 1, 2, 6, 7, 12, 18, 19 and 24 exhibit low structural vulnerability for 22.2 %, they are made up of species with the same classification, being better distributed in the different strata of the forest. González-Torres et al. (2016b) and Zhang et al. (2017), stated that the species that present a wide distribution in the pluvial forests of the eastern region of Cuba, will be the least vulnerable, these ecosystems will be the ones that present the least number of threatened species.
The remaining 5 plots (50 %) show medium structural vulnerability, depending on the species that contain it and generally characterize the structural behavior of the forest under study.
The results discussed above are summarized by area in Figure 6. They show the predominance of areas with medium structural vulnerability where plots 3, 4, 5, 8, 11, 13, 14, 16, 22, 23, 25, 26, 28 and 30-34 are included, product of the distribution in the floristic composition of the vegetation in the different substrata, and the preponderant role played by the different species in each of them.
Assessment of ecological vulnerability (Vec)
When applying the ecological vulnerability classification matrix, the results were shown by species with the predominance of medium ecological vulnerability, followed by low and high. H. elatus, C. utile, S. laurifolium, G. guara , J. vulgaris, T. catappa, A. inermis, C. peltata and Z. martinicense show low ecological vulnerability, for 20 %, characterized by moderate sensitivity, medium level of exposure, favored by high adaptation capacity, which infers low environmental and structural vulnerability to them by having a continuous vertical distribution in all strata.
On the other hand, A. diversifolia, R. regia, Guazuma tomentosa. Kunth, C. odorata, C. nucifera. L, and Carapa guianensis. Aubl present medium ecological vulnerability with 62.2 %. These results were corroborated by Sánchez (2015), when stating that the structure and composition of the low-altitude rainforest on a metamorphic complex is irregular, because it presents a very diverse and heterogeneous vegetation, with a high degree of anthropization, standing out as the most important species and abundant: H. elatus, G. guara.
M. indica, O. leucoxylon, E. sp, S. laevis, P. guajava, B. ebenus, S. mammosum, and C. occidentalis, presented high ecological vulnerability with 17.8 %, for being sensitive, with low level of exposure and medium adaptation capacity, which give it medium environmental vulnerability and high structural vulnerability, due to having a non-continuous distribution pattern. The aforementioned, could be given by variables and environmental disturbances such as: uncontrolled felling, slope, road, houses, various crops, which affect the dynamics of natural regeneration, structure and floristic composition of the forest (Sánchez, 2015).
The remaining 28 species present medium ecological vulnerability, because they are sensitive, have low exposure and high adaptability, which infer low environmental vulnerability and medium or high structural vulnerability, as appropriate. In the ecological vulnerability assessment, plots 9, 10, 11, 15, 17, 20, 21, 27, 29, 35 and 36 present high ecological vulnerability. They are identified as having species of moderate sensitivity, medium level of exposure and low adaptive capacity, which gives them high environmental vulnerability coupled with medium or high structural vulnerability.
Only plots 4, 14, 25, 32, 33, and 34 present medium ecological vulnerability, determined by having medium exposure, sensitivity, and adaptive capacity, which induce medium environmental vulnerability, together with medium structural vulnerability.
Similar results were obtained by Martínez (2012) in a study related to the ecological factors that determine the structure, functioning and floristic composition of the rainforests in the eastern region of Cuba, where the following stands out: climate, degree of exposure, slope, lighting, among other factors that act in an interrelated way in the ecosystem and affect the physiognomy of the forest.
Several studies indicate that changes in the climate and anthroponatural processes could exceed the adaptation capacity of many species, which would cause geographic displacement and extinctions of areas that generate important variations in the floristic composition and the functioning of ecosystems by causing alterations in the altitudinal ranges, horizontal and vertical structure, growth and phenological patterns of many plant species (Zhang et al., 2017).
The largest number of plots exhibit low ecological vulnerability, for 52.8 %, which characterizes the behavior of the forest in general. They stand out for having medium values of sensitivity and exposure, favored by high adaptation capacity and low structural vulnerability. Figure 7 shows the results of the degree of vulnerability that the forest presents, which allows rapid interpretation to establish priorities in management strategies for the application of management measures with approaches or decision-making related to biodiversity management, rehabilitation and restoration.
CONCLUSION
It was verified that the low altitude rainforest on metamorphic rocks presented low ecological vulnerability, standing out as sensitive species C. occidentalis, S. mammosum, S. laevis, B. ebenus, and Ps. Guajava.
Appendix 1. Qualitative evaluation criterion of sensitivity
Non-Sensitive: formed by those species that present an IVIE value (greater than and equal to 90). They are characterized by being the ones with the greatest ecological weight, the most important; they have a high representativeness that makes them not sensitive to environmental and anthropogenic disturbances, those of wide distribution in the stand and, at the same time, larger size. It is expected that there will be relatively few variations in the structure of the populations of dominant species and those best adapted to the physical-environmental factors of the habitat.
Moderately Sensitive: it is made up of those species that present average IVIE values (greater than 50 and less than 90). They are characterized by being species that have a medium representativeness that makes them moderately sensitive to environmental and anthropogenic disturbances. It is expected that there will be moderate variations in the structure of their populations, so they will be able to adapt relatively to the physical-environmental factors of the habitat.
Sensitive: they constitute those species that present a low value of IVIE, (less than and equal to 50). Those with less ecological weight, less important due to their dominance, their low representativeness makes them more susceptible to environmental and anthropogenic disturbances, they are prone to less survival, they have little distribution in the stand and important variations are expected in the structure of their populations. Hence, they will be the least adapted to the physical-environmental factors of the habitat.
Appendix 2. Qualitative evaluation criteria of the exhibition
High Exposure: it is made up of those species that present a high IVIE value (greater than and equal to 90). Characterized because they are the indicators of the area, the most representative, with high values of abundance, frequency and relative dominance, and thus, the ones with the greatest exposure, which is why they present variations in the original structure and composition of the forest.
Medium Exposure: species that present IVIE values (greater than 50 and less than 90). They are characterized by having average values of abundance, frequency and relative dominance, which is why they are moderately represented and exposed in the stand and present moderate changes in the original structure, which have not significantly altered their floristic diversity indicators.
Low Exposure: species that have low IVIE values (less than and equal to 50), are the least representative and indicative of the area, with low values of abundance, frequency and relative dominance; therefore, the least exposed, so they will present few variations in their original structure and forest composition.
Annex 3. Qualitative evaluation criteria of adaptive capacity
High adaptation capacity: when the Simpson index oscillates between the values of 0.0 0.30, the lower the value, a high level of biological diversity is considered, so there is a natural balance in the ecosystem, a greater potentiality for the generation of ecosystem services as a representation of the functionality of the species contained in the diversity, and therefore, the greater the capacity of adaptation and natural regeneration of the majority of the species will be.
Medium adaptation capacity: the Simpson index oscillates between 0.31-0.60 is when there is medium biodiversity, few changes in the original structure that have not significantly altered its indicators of floristic diversity, the natural regeneration of most of the species is medium, so there is a medium potential in the generation of ecosystem services and natural regeneration.
Adaptive capacity Low: the Simpson index ranges between 0.61 - 1.00, the higher the value, it is considered low biodiversity and indicates that the ecosystem does not present a natural balance, there is a low range of ecosystem services and natural regeneration, and therefore less is the possibility of adaptation.
Annex 4. Qualitative evaluation criteria for environmental vulnerability
High Environmental Vulnerability: made up of sensitive species, with a low level of exposure and equal adaptation capacity.
Medium Environmental Vulnerability: it is identified for presenting sensitive and moderately sensitive species, with a medium-low level of exposure, together with a low-medium adaptation capacity.
Low Environmental Vulnerability: they are characterized by having species with medium sensitivity and level of exposure, as well as a high capacity for adaptation. Or because they are sensitive species, with a low level of exposure and the same capacity for adaptation.
Annex 5. Qualitative evaluation criteria for structural vulnerability
Structural vulnerability (High): when the ranges of the relative sociological position oscillate between the values of 0.0 - 0.30, the species are not distributed regularly in all strata, their distribution pattern is non-continuous and thus, they do not have a guaranteed place in the structure and composition of the forest.
Structural vulnerability (Medium): when the ranges of the relative sociological position oscillate between 0.31-0.60. The species are distributed regularly in some of the strata, their distribution pattern is moderately regular and likewise it presents a medium place in the structure and composition of the forest.
Structural vulnerability (Low): when the ranges of the relative sociological position oscillate between 0.61-1.00. The species are distributed regularly in all strata, their distribution pattern is continuous and then, they have a guaranteed place in the structure and composition of the forest.
Exhibit 6. Qualitative evaluation criteria for ecological vulnerability
Low ecological vulnerability: made up of species that are not very sensitive, where the level of exposure and adaptive capacity are classified as high, related to low environmental vulnerability, together with low structural vulnerability.
Medium ecological vulnerability: made up of moderately sensitive species, the level of exposure and adaptation capacity have medium values, which infers a medium environmental and structural vulnerability.
High ecological vulnerability: made up of sensitive species, where the level of exposure and adaptation capacity are classified as low, related to high environmental and structural vulnerability.
REFERENCIAS BIBLIOGRÁFICAS
BRICEÑO, K. 2019. Índice de Simpson: Definición, Fórmula, Interpretación y Ejemplo. Disponible en: https://www.lifeder.com/indice-simpson/ [ Links ]
ÁLVAREZ, P. A. 2017.. Sistemas Silvícolas, Primera Edición. ISBN 978-959-07-2194-6. Editorial Universitaria Félix Varela: La Habana, 308 p. [ Links ]
ASSEF, M., PÉREZ, J., SÁNCHEZ, J. 2020. Evaluación de la vulnerabilidad ambiental en el parque nacional Alejandro de Humboldt. Revista Hombre, Ciencia y Tecnología. Vol. 24 No. Especial del 2020. ISSN:1028-0871. Disponible en: http://portal.amelica.org/ameli/journal/441/4411976008/html/ [ Links ]
CARABALLO, E. O, OSORIO, Y. 2020. Biodiversidad de la flora leñosa en un bosque pluvisilva submontano, Parque Nacional "Alejandro de Humboldt". Hombre, Ciencia y Tecnología, ISSN: 1028-0871. Vol.24, p 40-47. [ Links ]
DELGADO, D., FINEGAN, B., ACOSTA, M., CARRILLO, F. 2016. Análisis de la vulnerabilidad al cambio climático de bosques de montaña en Latinoamérica: un punto de partida para su gestión adaptativa. Centro Agronómico Tropical de Investigación y Enseñanza: Turrialba, Costa Rica, ISBN 978-9977-57-668-8. Disponible en: https://www.researchgate.net/publication/311924178_Analisis_de_la_vulnerabilidad_al_cambio_climatico_de_bosques_de_montana_en_Latinoamerica_un_punto_de_partida_para_su_gestion_adaptativa_Gestion_Integrada_de_Recursos_Naturales_a_Escala_de_Paisaje [ Links ]
PARDO GUERRA, R., MACAREÑO VELÍZ, L. A., PARRA SALINAS, A., GELY MARTÍNEZ, G., COBAS DÁVILA, W. 2017. Guía metodológica para la organización del proceso de reducción de desastres. Procedimientos para evaluar el nivel de reducción de la vulnerabilidad y el riesgo en los organismos, entidades y territorios. ONU, ISBN 978-959-224-396-5. Disponible en: https://www.preventionweb.net/files/59362_guiametodologicaparaorganizacionrrd.pdf [ Links ]
FINOL, H. 1971. Nuevos parámetros a considerarse en el análisis estructural de las selvas vírgenes tropicales. Revista Forestal Venezolana 21: 29-42 p. [ Links ]
FUENTES, I.; GONZALES, L.; MANCINA, C. 2020. Efectos del cambio climático sobre la distribución de plantas asociadas a bosques húmedos del oriente de Cuba. Acta Botánica. ISSN 2519-7754 RNPS 2402. Vol. 218, No.2. Disponible en: https://revistasgeotech.com/index.php/abc/article/download/295/240/ [ Links ]
GONZÁLEZ, T. L. R., PALMARO, L. A. A., BARRIOS, D., GONZÁLEZ,-O. L., TESTÉ, E., BÉCQUER, E.R., CASTAÑEIRA-COLOMÉ, MA., GÓMEZ HECHAVARRÍA , J.L., GARCÍA-BELTRÁN, JA., BERAZAÍN, R. 2016b. Estado de conservación de la flora de Cuba. Bissea. Disponible en: https://repositorio.geotech.cu/jspui/bitstream/1234/1054/2/02%20Estado%20de%20conservaci%C3%B3n%20de%20la%20flora%20de%20Cuba.pdf [ Links ]
MARTÍNEZ, E. 2012. Riqueza de especies y endemismo de las espermatófitas en las pluvisilvas de la Región Oriental de Cuba. Revista del Jardín Botánico Nacional 32-33: 79-109.Disponible en: https://revistas.uh.cu/rjbn/article/download/7156/6107 [ Links ]
NOGUERA, A. J. 2017. Metodologías para evaluar vulnerabilidad del bosque frente al cambio climático. Conference: Metodologias de Análisis de vulnerabilidad del recurso forestal. Universidad Nacional Agraria· Manejo de Bosques y Ecosistemas. Disponible en: https://www.researchgate.net/publication/313877562_Metodologias_para_evaluar_vulnerabilidad_del_bosque_frente_al_cambio_climatico [ Links ]
ONU. 2019. Estrategia Internacional para Reducción de Desastres. 30/01/2020 ONU. Disponible en: http://www.eird.org/esp/terminologia-esp.htm . [ Links ]
REYES, O. 2018. Fitocenosis en la pluvisilva de baja altitud sobre rocas metamórficas, Cuba Oriental. Revista del Jardín Botánico Nacional, Vol. 39: 49-57. Disponible en: 30/01/2020. Disponible en: 30/01/2020. https://revistas.uh.cu/rjbn/article/view/6721 [ Links ]
ZHANG, J., NIELSEN SE CHEN, Y., GEORGES, D., WANG, S.S., SVENNING, J.C., THUILLER, W. 2017. Extinction risk of North American seed plants elevated by climate and land-use change. Journal of Applied Ecology. 54: 303-312 Disponible en: https://besjournals.onlinelibrary.wiley.com/doi/10.1111/1365-2664.12701, https://doi.org/10.1111/1365-2664.12701 [ Links ]
Received: October 16, 2022; Accepted: July 07, 2023

