
Simulation and evaluation of the absorption edge subtraction technique in energy-resolved X-ray radiography applied to the cultural heritage studies
Simulación y evaluación de la técnica de sustracción del borde de absorción en un sistema radiográfico espectrométrico destinado al estudio del patrimonio cultural
Diana Leyva Pernía1, Ana E. Cabal Rodríguez1, Piet Van Espen2, Ibrahin Piñera Hernández1, Antonio Leyva Fabelo1 , Yamiel Abreu Alfonso1
11Departamento de Física. Centro de Aplicaciones Tecnológicas y Desarrollo Nuclear (CEADEN). Calle 30 No 502 e/ 5ta y 7ma, Miramar, Playa. La Habana
2Department of Chemistry, University of Antwerp, Belgium
ABSTRACT
In this work the mathematical simulation of photon transport in the matter was used to evaluate the potentials of a new energy-resolved X-ray radiography system. The system is intended for investigations of cultural heritage object, mainly painting. The radiographic system uses polychromatic radiation from an X-ray tube and measures the spectrum transmitted through the object with an energy-dispersive X-ray detector on a pixel-by-pixel basis. Manipulation of the data-set obtained allows constructing images with enhanced contrast for certain elements. Here the use of the absorption edge subtraction technique was emphasized. The simulated results were in good agreement with the experimental data.
Key words: photon transport, X-ray tubes, cultural objects, mathematical models, X-ray radiography, image processing, Si semiconductor detectors, absorption.
En este trabajo se utilizó la simulación matemática del transporte de los fotones en la materia para evaluar las potencialidades de un nuevo sistema radiográfi co destinado al estudio de obras del patrimonio cultural. Este sistema emplea una fuente de rayos X no monocromática y mide a nivel de píxel el espectro transmitido a través del objeto en estudio con un detector espectrométrico. El procesamiento del conjunto de datos obtenidos permite la construcción de imágenes con contraste realzado para ciertos elementos. En el presente trabajo se enfatizó en el uso de la técnica de sustracción del borde de absorción para el procesamiento de las imágenes. Los resultados de las simulaciones resultaron consistentes con las mediciones experimentales.
Palabras claves: transporte de fotones, tubos de rayos X, objetos culturales, modelos matemáticos, radiografía por rayos X, tratamiento de imágenes, detectores de semiconductor de Si, absorción.
Introduction
Art historians and conservators extensively use X-ray radiography of paintings during restoration, to study the artist’s technique and to identify forgery. The obtained contrast results from the density and the composition of the object, e.g. substrate and pigments used. However it does not provide precise information on the elemental composition and in some cases only very little contrast is obtained and little information can be deduced from this radiograph. This is the case for instance when the painting is made on a thick wooden substrate or when a lead based ground layer is present below the actual painting as is commonly found in many paintings of the nineteenth and early twentieth centuries [1].
The absorption edge subtraction technique [2,3] has the potential to obtain a more element specific radiographic image and it had been successfully used in cultural heritage studies [4,5]. Nevertheless the classical application of this technique requires the use of highly monochromatic X-ray sources or synchrotron radiation that difficult its implementation. As a solution to this inconvenient was presented in recent publications [6,7] a novel energy-resolved X-ray radiography system, which allows the absorption edge subtraction technique using low power X-ray tubes and an X-ray detector with high energy-resolution.
A quick and effective way to study such a system is the use of mathematical simulation of radiation transport in matter, which had been previously used in several investigations related to X-ray systems applied for the cultural heritage studies [8,9]. In this article the mathematical simulation was used by means of MCNPX (Monte Carlo N-Particle version X) [10] to assess in more detail the potentialities of the absorption edge subtraction technique application in the system described at [7].
Theory
X-ray attenuation in an energy-resolved radiography of paintings
The fundamental process that is responsible for the creation of radiographic contrast of a sample (a painting in our case) is the photo-electric absorption of X-rays by the sample and the fact that the absorption crosssection depends on the composition of the sample.
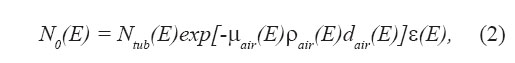
]]> In energy-resolved radiography, due to the use of energy dispersive detectors (measuring the transmitted spectrum), the radiographic image is reconstructed from the data obtained at each pixel. We modeled the radiographic contrast of this system as follow. The number of photons observed in the spectrum for a given energy E, N(E), is related to the number of photons emitted by the tube with that energy,where the first exponent refers to the attenuation in the air path and the second to the attenuation in the painting, with μ the mass absorption coefficient in ![]() ,
, ![]() the density in g
the density in g ![]() , and d the thickness in cm. The detector efficiency is given by
, and d the thickness in cm. The detector efficiency is given by ![]() (E).
(E).
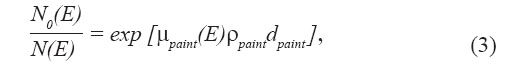
If the painting is not present, and assuming that the thickness of the painting is small relative to the air path, ie ![]() , one can write:
, one can write:
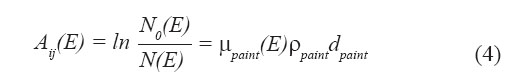
The ratio of these two intensities is
or the absorbance, A(E), which is directly proportional to the attenuation coefficients, densities and thicknesses of the painting:
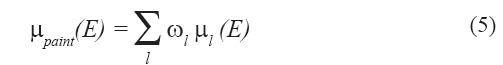
where the mass attenuation coefficient of the painting can be written as the weighted contribution of the constituent elements:
]]>
Each time the painting is moved according to a predefi ned stepping procedure, the transmitted X-ray spectrum is measured at a given location of the painting (pixel) and then it is moved to another location to acquire the next spectrum. The three dimensional data structure of the measured intensity can this represented by ![]() , with i and j referring to the x and y positions on the painting and k referring to the energy interval (channel in the spectrum).
, with i and j referring to the x and y positions on the painting and k referring to the energy interval (channel in the spectrum).
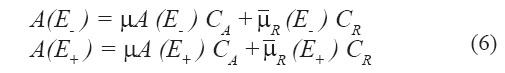
Edge subtraction radiography
The K-edge subtraction technique has the potential to obtain a more element specific radiographic image. The principle of edge subtraction radiography is to make an element-specific image using the absorbance image before and after the absorption edge of the element of interest A [2,3]. Two orthogonal images are obtained: an element specific image and a background image. The fi rst image emphasizes the distribution of the specific element due to the differences in X-ray attenuation below and above the absorption edge of that element.
If ![]() represents the energy below the edge and
represents the energy below the edge and ![]() the energy above the edge, one can write:
the energy above the edge, one can write:
which is a set of two equations in two unknowns ![]() and
and ![]() . While
. While ![]() and
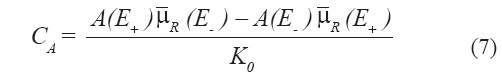
and ![]() are the mass attenuation coefficients of an element of interest, A, and the rest of the matrix, respectively. The solution, known as Lehmann
are the mass attenuation coefficients of an element of interest, A, and the rest of the matrix, respectively. The solution, known as Lehmann
algorithm, is as follows:
Applying this algorithm for each pixel results in two images, one related to the specific element image and one of residual image. The algorithm thus requires the mass attenuation coefficient of the specific element at the two energies ![]() and
and ![]() , which can be found in tables [11]. To estimate the mass attenuation coefficient of the rest of the matrix a guess must be made about the average composition. Often the rest matrix is represented by carbon or by water.
, which can be found in tables [11]. To estimate the mass attenuation coefficient of the rest of the matrix a guess must be made about the average composition. Often the rest matrix is represented by carbon or by water.
In classical K-edge subtraction radiography the difference between the two energies is of the order of few keV. In our case, we can choose ![]() and
and ![]() to be 100 to 200 eV below and above the edge energy. Because of this small difference the original Lehmann algorithm can be simplified substantially. We can assume that the mass attenuation coefficient of the rest of the matrix remain essentially constant.
to be 100 to 200 eV below and above the edge energy. Because of this small difference the original Lehmann algorithm can be simplified substantially. We can assume that the mass attenuation coefficient of the rest of the matrix remain essentially constant.
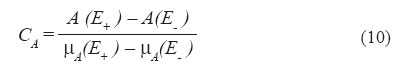
The element specific information (eq. 7) can be written as:
Because ![]() (
(![]() ) –
) – ![]() (
(![]() ) is a constant independent of the sample, and because we are not interested in the absolute value but rather in differences from pixel to pixel we can obtain element specifi c images simply by subtracting the absorbance at two energies, one just below and one just above the edge of interest. Thus, when taking absorption images close to a particular edge, the element specific image can be calculated simply by subtracting the two absorbance images. In contrast to the Lehmann algorithm the value of mass attenuation coefficient is not required.
) is a constant independent of the sample, and because we are not interested in the absolute value but rather in differences from pixel to pixel we can obtain element specifi c images simply by subtracting the absorbance at two energies, one just below and one just above the edge of interest. Thus, when taking absorption images close to a particular edge, the element specific image can be calculated simply by subtracting the two absorbance images. In contrast to the Lehmann algorithm the value of mass attenuation coefficient is not required.
Materials and methods
The transport code MCNPX [10] was used to simulate the transport of the gamma rays through the different components of the experimental set-up. In the simulations all the geometrical details related to the detection system were reproduced and the source spectrum was defined from experimental measurements made with the X-ray tube of the system.
Two test paintings, denominated D5 and D6, were used in the simulations. They were constructed to emulate the actual test paintings that were available for the study of the experimental set-up.
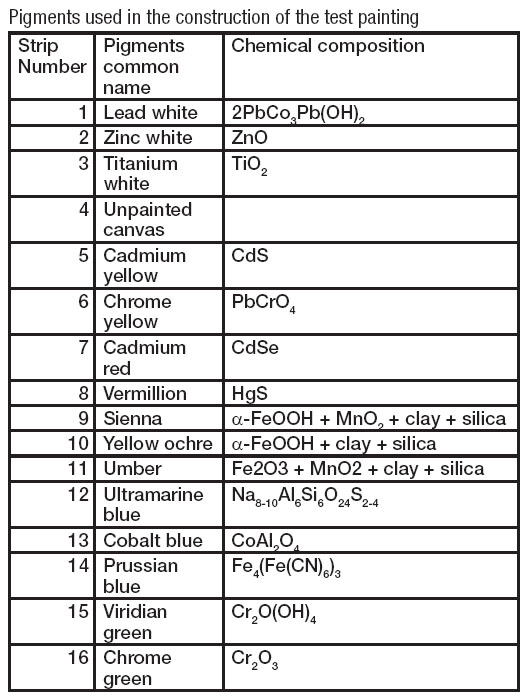
]]> The test painting D5 consisted of 15 bands of different pigments painted on a canvas of 180 mm x 240 mm. Each pigment was applied in different thickness of about 20, 40 and 60 ìm in order to observe the effect of the brushstrokes thickness in the radiographic image. The applied pigments with their chemical formula are shown in table. Between the third white band and the first yellow a band was left unpainted. The D6 test painting only differs from D5 in that between the canvas and pigment bands a ground layer of 40 μm thick lead white ![]() was painted.
was painted.
The energy distribution of pulses created in the cell, that models the physical detector, was obtained by the implementation of the pulse height tally (F8) provided by the MCNPX. To ensure that the simulation results have a relative error of 1% were carried out in each run 100 millions of histories.
The data obtained by the simulations were further processed using a Matlab program specially developed for this purpose. This program was also used to process the experimental results and it allows to obtain and visualize images of the X-ray intensity at a given energy or energy range, e.g. before and after an absorption edge and to perform mathematical operations on these images such as logarithmic subtraction. In this way the effect of selecting certain energies or energy ranges can be studied as well as the infl uence of various normalization and scaling steps. Performing the proper operations and selecting the right energies it is possible to achieve a dramatic improvement of the image contrast for a specific element.
Results and discussion
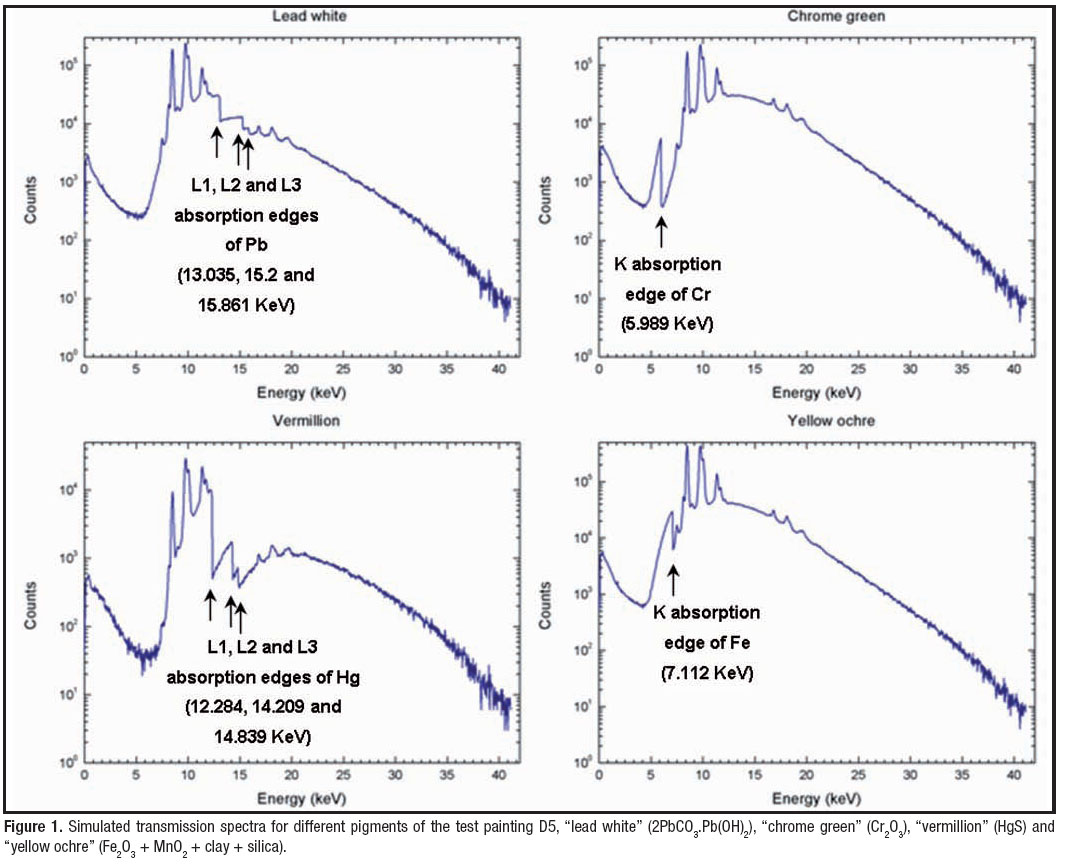
Figure 1 shows some absorption spectra after transmission through different pigments of test painting D5, obtained by simulation. Next to the overall absorption of the tube spectrum in which stands out three emission lines from the wolfram anode (8.397, 9.672 and 11.285 KeV), K and L edges of some elements (indicated with black arrows) can clearly be observed showing the possibility to discriminate, at least in principle, between different pigments based on their absorption spectrum.
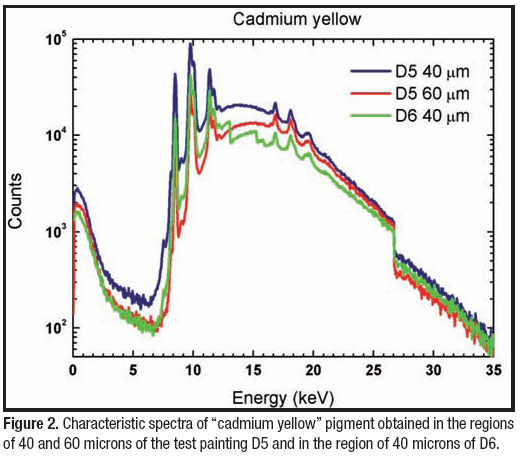
Figure 2 are presented the characteristic spectra of the “cadmium yellow” pigment acquired by simulation from two regions of D5 with different thickness (40 and 60 microns) and from the region of D6 that presents 40 microns of pigment over the ground layer. These three spectra differ in their intensities but all of them present a very distinctive K absorption edge of cadmium. The influence of the pigment thickness on the obtained spectra is evident, it is seen the clear difference of the X-ray absorption spectra intensities between the 40 microns layer and the thicker layer of 60 microns of the test painting D5. In the spectrum obtained from D6 is visible a higher attenuation due to the presence of Pb in the ground layer, which also causes the apparition of the ![]() ,
, ![]() and
and ![]() absorption edges of this element next to the already mentioned K absorption edge of cadmium.
absorption edges of this element next to the already mentioned K absorption edge of cadmium.
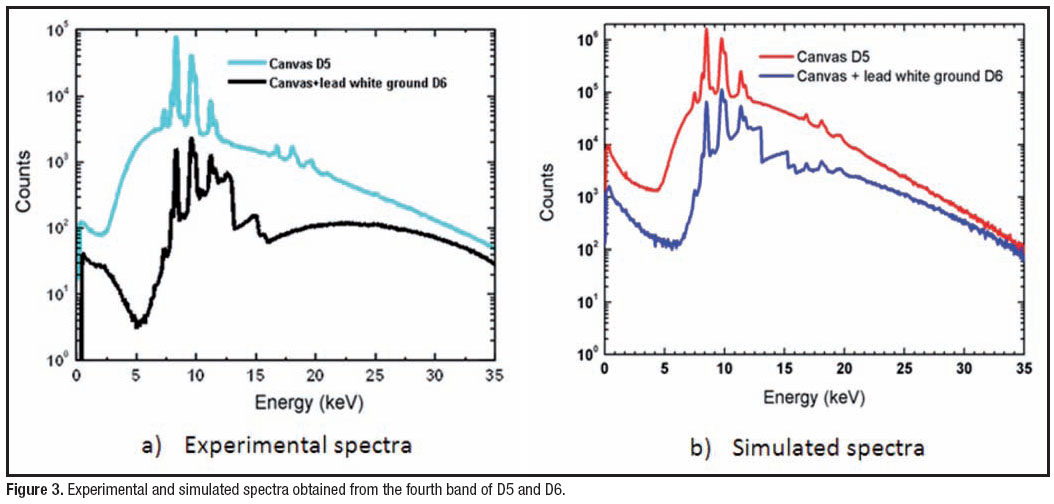
The comparison between experimental and simulated spectra obtained from the fourth band of the test paintings is sowed in figure 3. Both simulated and experimental spectra from D5 exhibit only the presence of the wolfram anode emission lines, while the D6 spectra also present the absorption edges of lead. In both cases the spectra from D6 are less intense than those from D5, due to attenuation caused by the lead in the ground layer. In this figure is also noticeable that the difference between the spectra intensities of the experimental results is larger than in the simulated case. This can be caused by non-homogeneity in the thickness of the ground layer applied on the experimental test painting. The existence of a thickness larger than the considered average in the analyzed pixel would cause a greater attenuation in the results.
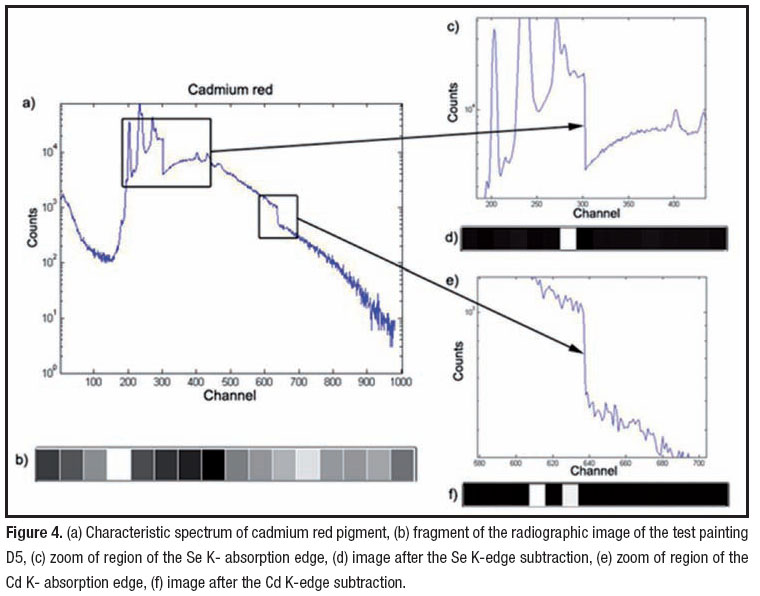
]]> Figure 4 illustrates the procedure of the application of absorption edge subtraction and its application to the analysis and identification of pigments of the test painting D5. Figure 4 (a) shows the characteristic spectrum of the “cadmium red” pigment (CdSe). It is the transmission spectrum obtained at one of the pixels of the D5 band covered by this pigment. The K-absorption edges of the two elements, comprised in the pigment, can be clearly observed. Figure 4 (c) zooms in on the region of the Se K-edge (12.658 keV), while 4 (e) shows the detail of the Cd K-edge (26.711 keV). For all pixels of the test painting were selected two region of the spectrum, below and above the Se K-edge. Then the logarithmic subtraction technique was applied and the absorbance image of the section of D5 (figure 4(d)) was obtained.In the image the single band that contains selenium can clearly be distinguished. It coincides with the distribution of the “cadmium red” pigment in the test painting D5. An image (figure 4(f)) was obtained applying the same procedure for the Cd K-edge , which has two enhanced bands where Cd is presented, the fi fth (CdS) and the seventh (CdSe). These last two figures can be compared with the original image of the same section without any mathematical treatment. Without applying the edge subtraction technique and not knowing the distribution of the pigments, it would be impossible to identify these bands.
Without prior knowledge of the distribution of pigments, as is the case in a real painting, it can be concluded from the above results that it is possible to distinguish between two pigments containing Cd, using the additional information provided by the image produced from the Se edge.
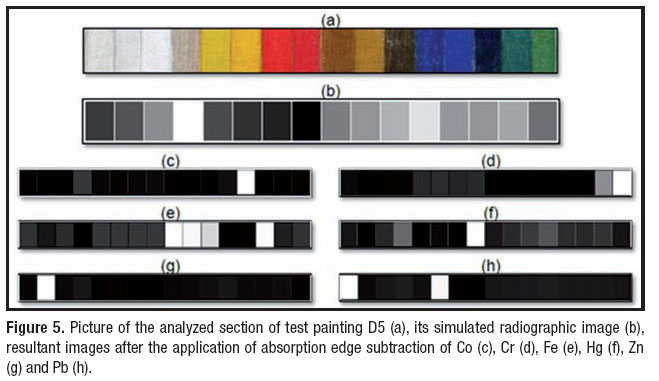
Figure 5 shows a picture obtained by simulation of the analyzed section of test painting D5 (a), the radiographic image formed from the total number of counts in each pixel (b) and the images obtained from the subtraction of some absorption edges (c-h). In the image obtained by the Co absorption edge subtraction (figure 3 (c)) the 13th band is enhanced, which is the only one in the test painting in which that element is present (“cobalt blue” ![]() pigment). Figure 5 (d) shows the image from the subtraction of the chromium edge, where the last two bands, 15 and 16 are enhanced. Band number 16
pigment). Figure 5 (d) shows the image from the subtraction of the chromium edge, where the last two bands, 15 and 16 are enhanced. Band number 16 ![]() is more intense than 15
is more intense than 15 ![]() because of the higher Cr concentration in the former. The band 6 also contains Cr, but it is not enhanced in the figure as a result of the presence of Pb in the pigment “chrome yellow”. The image corresponding to the subtraction of the iron absorption edge, shown in figure 5 (e), exhibits four bands that stand out from the rest, corresponding to “sienna”
because of the higher Cr concentration in the former. The band 6 also contains Cr, but it is not enhanced in the figure as a result of the presence of Pb in the pigment “chrome yellow”. The image corresponding to the subtraction of the iron absorption edge, shown in figure 5 (e), exhibits four bands that stand out from the rest, corresponding to “sienna” ![]() , “yellow ochre”
, “yellow ochre” ![]() , “umber”
, “umber” ![]() and “prussian blue”
and “prussian blue” ![]() pigments. Figures 5 (f) and (g) show only one prominent band, because the elements relating to absorption edges (mercury and zinc, respectively) were only present in these bands. Finally, looking at figure 5 (h), obtained from the subtraction of the lead edge, accentuated regions are observed corresponding to band 1
pigments. Figures 5 (f) and (g) show only one prominent band, because the elements relating to absorption edges (mercury and zinc, respectively) were only present in these bands. Finally, looking at figure 5 (h), obtained from the subtraction of the lead edge, accentuated regions are observed corresponding to band 1 ![]() and 6
and 6 ![]() . These are the only areas in which lead is present in the pigments in this test painting.
. These are the only areas in which lead is present in the pigments in this test painting.
The obtained results clearly demonstrate the practical usefulness of the absorption edge subtraction procedure for the study of paintings, specifically for the identification of pigments.
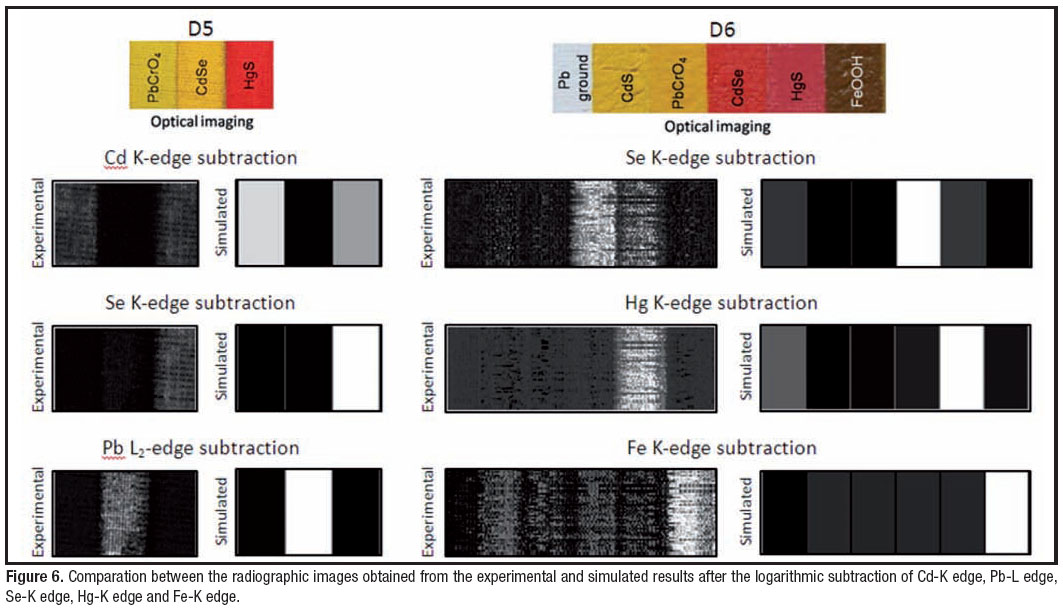
Experimental data were acquired only for a small region of D5, which corresponds to the bands of the pigments “cadmium yellow”, “chrome yellow” and “cadmium red”. While the D6 scanned area extends over the bands of the pigments “lead white” ground layer,“cadmium yellow”, “chrome yellow”, “cadmium red”,“vermillion” and “sienna”. A comparison between the radiographic images, obtained from the application of the absorption edge subtraction technique to the experimental and simulated data, is presented in figure 6. Both experimental and simulated results show enhanced bands corresponding to the element, whose absorption edge was used to produce the image. The similarity between the experimental results and the simulated validate the simulation results. Thanks to the simulation it was possible to obtain evidence of the usefulness of edge subtraction via energy-resolved radiography for more elements than available experimentally such as Co, Cr, Fe, Hg and Zn. This gives confidence about the more general applicability of this technique. Further experimental verification is planned in the near future.
Conclusions
Simulated spectra and images were obtained for energy-resolved digital X-ray radiograph system. Absorption edges of the main elements were observed in the spectra even when a ground layer of “lead white” pigment is applied. Applying the absorption edge subtraction technique it was possible to obtain the distribution of each chemical element in a selected region of the test painting. This allows the identifi cation of pigments present in the painting and to obtain their distribution.
The simulation results were compared with available experimental data and good agreement was obtained. The simulation involved a larger number of elements than experimentally available and indicated that edge subtraction technique is applicable for an extended range of elements and can be used in real situations investigating the distribution of pigments in the painting.
]]> References 1. AIBÉO CL, GOFFIN S, SCHALM O, et. al. Micro-Raman analysis for the identifi cation of pigments from 19th and 20th century paintings. J. Raman Spectrosc. 2008; 39(8): 1091–1098.
2. ALVAREZ RE, MACOVSKI A. Energy-selective Reconstructions in X-ray computerized Tomography. Phys. Med. Biol. 1976; 21(5): 733-744.
3. LEHMANN LA, ÁLVAREZ RE, MACOVSKI A, BRODY WR. Generalized image combinations in dual KVP digital radiography. Med. Phys. 1981; 8(5): 659-667.
4. BALDELLI P, BONIZZONI L, GAMBACCINI M, et. al. Application of the K-edge X-ray technique to map pigments of art paintings: Preliminary results. IL NUOVO CIMENTO. 2006; 29C (6): 663–672.
5. KRUG K, DIK J, DEN LEEUW M et. al. Visualization of pigment distributions in paintings using synchrotron K-edge imaging. Appl. Phys. A. 2006; 83(2): pp. 247–251.
6. SCHALM O, CABAL AE, VAN ESPEN P, et. al. Improved radiographic methods for the investigation of paintings using laboratory and synchrotron X-ray sources. J Anal Atom Spectr. 2011; 26: 1068-1077.
7. CABAL AE, LEYVA D, SCHALM O, et. al. Possibilities of energy-resolved X-ray radiography for the investigation of paintings. Anal. Bioanal. Chem. 2011. DOI: 10.1007/s00216-011-5230-x.
8. HARDING G, HARDING E. Compton scatter imaging A tool for historical exploration. Appl Rad and Isot. 2010; 68(6): 993– 1005.
9. TROJEK T, CECHAK T, MUSILEK L. Monte Carlo simulations of disturbing effects in quantitative n-situ X-ray fl uorescence analysis and microanalysis. Nucl Instrum and Meth Phys Res A. 2010; 619: 266– 269. ]]>
10. HENDRICKS JS, MCKINNEY GW, TRELLUE HR, et. al. MCNPXTM Version 2.6.B. [software informático]. Los Alamos National Laboratory report. LA-UR-06-3248. 2006.
11. VAN GRIEKEN R, MARKOVIC A. Handbook of X-ray spectrometry. New York: Marcel Dekker, 2002.
Recibido: 8 de septiembre de 2011
Aceptado: 27 de octubre de 2011
]]>