
Biomedical scientific publication patterns in the Scopus database: a case study of Andalusia, Spain
Patrones de publicación científica en Biomedicina en la base de datos Scopus: Un caso de estudio de Andalucía, España
]]>
Dra. C. Zaida Chinchilla-Rodríguez, Dra. C. Carmen López-Illescas, Dr. C. Félix de Moya-Anegón
SCImago Research Group. Instituto de Políticas y Bienes Públicos. Centro de Ciencias Humanas y Sociales. Consejo Superior de Investigaciones Científicas (IPP-CCHS-CSIC). Madrid, Spain.
This paper characterises scientific output in biomedicine in Andalusia, and Spain as a whole, and conduct a first-time comparison to Europe- and world-wide production. The data were extracted from the Scopus database. Three families of indicators are explored to analyse research quantity, quality and collaboration. The results show an upward trend on biomedical output in Andalusia. Over 50 % was in clinical medicine, whose growth doubled the basic medicine. We found greater than nationwide specialisation in biochemistry, genetics and molecular biology, immunology and microbiology, and pharmacology, while psychology proved to be the most prominent emerging area. The publication in most cited journals together with national and international collaboration enhanced research visibility. More citable papers were published on basic than clinical medicine, and the number of citations received by the former was also larger. The higher citation rate in basic medicine may also be explained by the bigger percentage of papers published in international instead domestic journals. Hence, publication patterns would appear to affect research visibility. The methodology proposed may provide guidance for public policy makers to improve, encourage and intensify good biomedical research practice.
Key words: bibliometrics, biomedicine, Andalusia, Spain, SCImago Journal & Country Rank, publication patterns, Heliocentric Collaboration Networks. ]]>
]]> INTRODUCTION
No twenty-first century government would question the importance of research for national progress. This truism has placed research management at the top of policy makers' political agendas in developed countries. The acknowledgement that scientific and technological capacity is instrumental to regional development lies at the root of studies such as the one discussed in this paper. The role and growing interest of regional governments in scientific policy stems partly from the general acceptance of an emerging rule whereby scientific supervision is a responsibility that should be assumed by regional authorities.1 Moreover, professional management of research projects has been imposed by the European Commission as an imperative for EU funding. Scientific and technological policy management, however, is contingent upon the ability of governments and scientific institutions to assess research performance. Quantitative studies on science and technology are proving to be highly useful in this regard. Bibliometric assessment based on publications and their impact is a subfield of quantitative studies on science and technology focusing on the development of indicators to evaluate research performance.2 As other studies pointed out not only the characterization of a scientific domain is important for the evaluation of research performance but also, some of the many variables besides scientific quality that depends of factors related with the publication patterns.3
Over the last 50 years these bibliometric indicators have been derived nearly exclusively from the citations published by Thomson Reuters, formerly Institute for Scientific Information (ISI), in particular the Web of Science (WoS). In autumn 2004, however, Elsevier, scientific publishers, launched Scopus, a new multidisciplinary citation database. In the interim, a fair number of studies have appeared to compare the two databases, most of which concur in highlighting the obvious advantage of Scopus in terms of coverage.4-5 This tool nearly doubled the volume of sources included in the WoS, making it an effective alternative to the Thomson citation index.
This is the first study of Andalusian scientific output using the Scopus database, one of the most comprehensive source of bibliographic data, and hence the first time that account has been taken of much of the research conducted in Andalusia and not reflected in the Thomson Reuters database.6-10 A substantial portion of Andalusian, as well as national production is still excluded, however, because it is absent from both databases. This situation supports the premise that bibliometric analytical findings depend on the methodologies and tools used and must be interpreted bearing in mind both the conditioning factors and the policy and structural context involved.
When assessing the suitability of a given database for the bibliometric analysis of a scientific area, the primary question is the coverage of that area in the databases considered. The quality and reliability of the information gathered, in particular with regard to citation and author affiliations, must be not only correct, but thorough and well structured. Comparative studies of databases have shown that Scopus also meets these requirements.11 The additional information included in Scopus makes it possible to develop accurate citation hyperlink algorithms.12 Scopus may therefore be regarded as an actual alternative source of data for generating bibliometric indicators with which to assess research performance in health science-related fields.
The primary objective of this study was to analyse the variations in Andalusian scientific output in biomedicine and draw comparisons with other geographic areas and fields of science with bibliometric techniques and tools. While not free of weaknesses or limitations,13-14 bibliometric methodology is generally acknowledged to be useful for research assessment.15-16
This study forms part of a broader and highly detailed analysis of biomedicine and health science. Unlike prior studies, the present paper aimed to assess biomedicine in Andalusia over a 12-year period in the national and international context, and compare the results to region-, nation-, Europe- and world-wide performance. The two specific objectives were to analyse publication patterns, determining international specialisation by subject; and to detect the fields with greatest visibility (number of citations per paper, attractivity index), identifying collaboration patterns to ascertain the strengths and weaknesses of biomedical research on each scale studied.
This paper discusses material and methods, describes the indicators used to measure the results of Andalusian biomedical production and compares regional performance with the performance in Spain as a whole, Europe and the world. It also reviews the methodology for a brief analysis of one of the areas studied. The results on research activity refer only to papers published in internationally visible journals indexed in Scopus database. Finally, the conclusions and proposals for future studies are presented.
]]>
METHODS
The data for the analysis were obtained from the bibliometric version of the Scopus database created by Spain's researchers.17 The Scopus database contains over 18 000 sources. The use of Scopus for the analysis proved to be both suitable and promising for future research18 and its inclusion of Medline, which makes Scopus the leading international source of information on biomedical articles.19
Prior studies have also compared Scopus database to Ulrich's Periodicals Directory to determine the degree of coverage and consistency in the databases, as well as to study their representativeness, characteristics and bias. Attainment of the highest possible degree of coverage does not suffice: the greatest possible uniformity is also imperative, while discipline- and nationality-based bias must be avoided. The correlation between Scopus and the Ulrich directory is high for subject matter distribution (R2= 0.99), but somewhat lower for countries (R2= 0.95).20
Given these characteristics, the database used for calculating the indicators was open access portal SCImago Journal & Country Rank (SJR) [http://www.scimagojr.com ], based on Scopus data [http://www.scopus.com]. The SJR portal, a scientific information system that ranks journals and countries, is a resource for comparison on the regional, national or international scale. In addition to its use for scientific benchmarking, it provides wider coverage of data and type of document covered and hence is more representative of scientific activity, in this particular case, in Andalusia, a region in southern Spain.
The present study entailed the development of specific software to import the records and build an ad-hoc database in Microsoft Access with the information on biomedicine. Once structured, the data were classified by date, geography and subject area. The period studied was 1996 to 2007 and the areas were Andalusia, Spain, Western Europe and the world. The Scopus subject area categories were used to classify the journals by subject. Nine areas related to biomedicine were chosen and re-grouped into two main subfields: clinical and basic medicine. The results are represented by using the Microsoft Excel and Pajek, a software for network analysis.
]]> The indicators used in the study were structured under three headings:1. quantitative information.
Ndoc: number of documents regardless document type; % Ndoc: percentage of documents with respect to the region, nation-, or world-wide total; Ndocc: number of citable documents: articles, reviews and conference papers only; GR: growth rate; AI: activity or specialisation index, reflecting the relative activity in a given subject area in terms of the level of specialisation, understood to mean the relative effort devoted to that area.
2. visibility.
Ncit: total number of citations received in 1996-2007 Cpd: number of citations per document in each aggregate; ATTI: attractivity index, which characterizes the relative impact of a country's publication in a given subject field as reflected in the citations they attract. ATT value of one is an indication that the number of citations received by the unit (institution, region, discipline...) in question is in line with the nation- or world-wide mean, or whatever other reference is adopted. ATT value of over one signifies "added value" or "strength" and means that the target unit received more citations than the reference unit. A value below one denotes the opposite.21
]]> 3. Collaboration.four types of collaboration are defined: no collaboration means papers authored by a single institution; domestic collaboration means papers authored by two or more domestic institutions but with no foreign participation; domestic and international collaboration for papers involving two or more national institutions and at least one foreign institution; and international collaboration means papers with authors in more than one country but only one institutions for the analysed country. VtC is visibility (i.e., citations per paper) depending on the type of collaboration.
NETWORK VISUALISATION
For the heliocentric network, the methodology applied was an adaptation of the methodology proposed for international collaboration networks, factoring in collaboration and visibility in terms of citations.22-24 The Kamada Kawai25 algorithm was used to position the nodes. This method assigns coordinates to the nodes to adjust the distances between them as closely as possible to the theoretical distances26 Pajek software27 was used to display the network. The map was charted on the basis of the number of articles co-authored by the country studied with each other country, taking a list of neighbours as the point of departure. The countries are positioned depending on the number of articles co-authored with the target country. The graphic, which occupies the maximum space available, is characterised by a central node (country analysed) and a number of surrounding nodes (collaborating countries) with orbits whose distance from the central node depends on the intensity of their relationship with it. The size of each sphere denotes the number of papers produced in collaboration with the country in question, while the colour reflects the country's geographic region. The citations received by articles written in collaboration with each country are represented by lines. The partnering countries orbit around the central node at a greater or lesser distance and their relationship is represented by a line whose length is inversely proportional to visibility. This type of graphic has been used to quickly identify the countries with which a country publishes most (highest volume) and with which it is more visible (closer to the centre). This analysis shows the main geographic axes and to what extent and how these relationships impact visibility, depending on the type of collaboration. Moreover, three concentric circles are included on the graphic, showing the relative impact depending on the type of collaboration: no collaboration (dashed grey line), domestic collaboration (solid black line) and international collaboration (dashed black line). Countries can therefore be identified in terms of their position with respect to the perimeter (less visible), and whether or not their impact is above the mean for the type of scientific partnering involved.
]]>
GENERAL DATA
Between 1996 and 2007 the number of Andalusian papers published in internationally visible journals were more than doubled (124 %). That rise was higher than recorded for Spanish science as a whole (97%) (Fig. 1) The region's contribution to the nationwide total rose steadily, reaching 15.65 % by the end of the period studied.
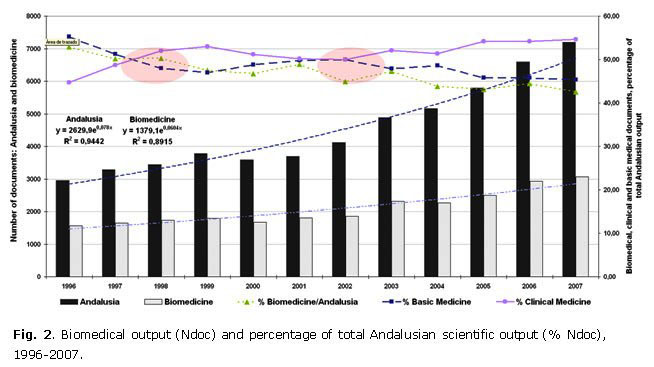
While Andalusian output grew faster than in the country overall, its biomedical output showed slightly lower growth (95.46 %). Although the number of biomedical papers per year increased, their percentage of the regional total declined slightly (Fig. 2), dotted line with triangles. This decline may have been due to the consolidation of the field of biomedicine to the point that it reached a saturation threshold, along with the appearance in overall Andalusian output of emerging areas such as agri-food sciences and mathematics, which have been gaining ground in the region. The data on research visibility, in turn, showed that the number of citations per paper received by Andalusian production as a whole was higher than observed for Spain nationwide.28
The breakdown of biomedical output showed that clinical medicine grew nearly 140 % while basic medicine rose by under 60.4 %. Consequently, the most prominent characteristic observed was the increase in clinical studies and their contribution to Andalusian biomedicine as a whole. Figure 2 shows that whereas output was higher in basic medicine in the early years, the trend reversed from 1998 to 2000, although the two subfields converged in 2001-2002. From that time on, however, production was consistently higher in clinical medicine.
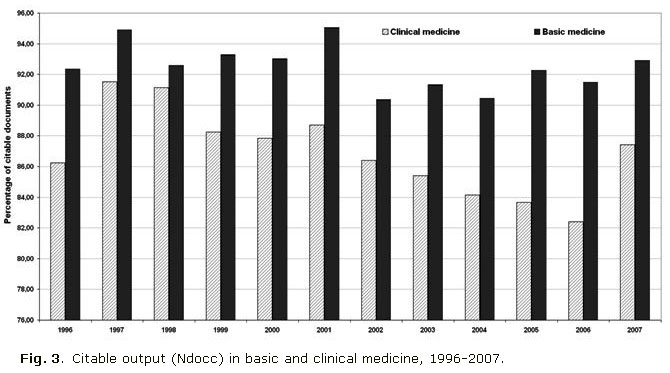
]]>This upward trend in clinical output did not carry over to equivalent growth in visibility, primarily because growth was driven by an increase in non-citable documents on clinical medicine, i.e., papers other than research articles, reviews or congress proceedings, which are the types used to measure visibility. Despite the increase in the number of documents in this area, then, since they included non-citable publications, the number of citations did not rise in the same proportion. While primary or citable output accounted for 92 % of the papers in basic medicine, the percentage dipped to 86 % in clinical medicine. This publication pattern translated into a higher percentage of documents cited and consequently a larger number of citations in basic medicine (Fig. 3).
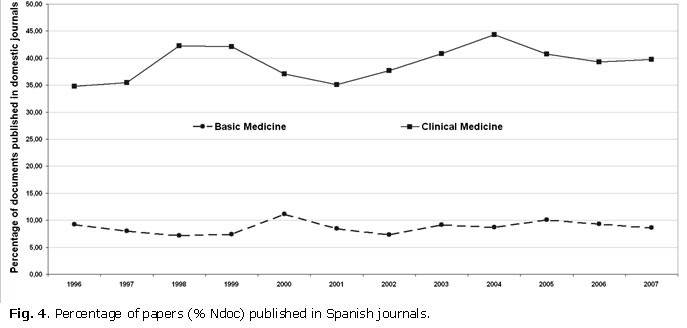
The number of papers published in Spanish journals varied widely (Fig. 4). Whereas an average 39 % of papers dealing with clinical medicine appeared in national journals, less than 9 % of the articles on basic medicine were published nationally. This would also have impacted citations, especially if the papers were published in English. This finding, while important from the standpoint of information and the possible change in publication habits, should not leave another consequential fact unnoticed: an increasing number of papers were published in domestic journals listed in the major databases. The most significant finding, in any event, was that the number of papers published in the domestic journals listed in the major databases increased in the latter years of the series. Several studies have shown, in addition, that papers published in national journals received less citations when written in a language other than English.22,29-30
]]>
COLLABORATION PATTERNS
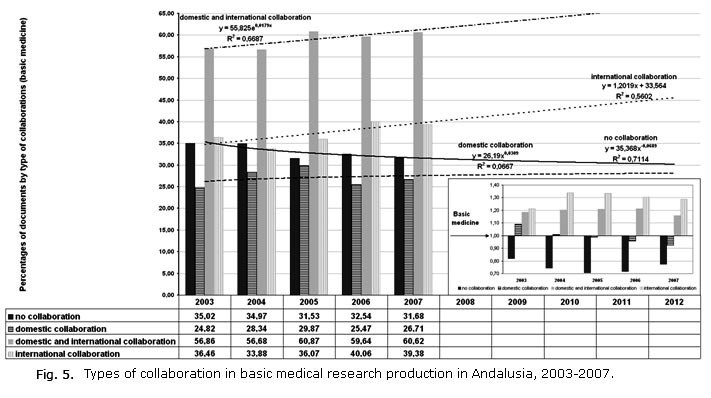
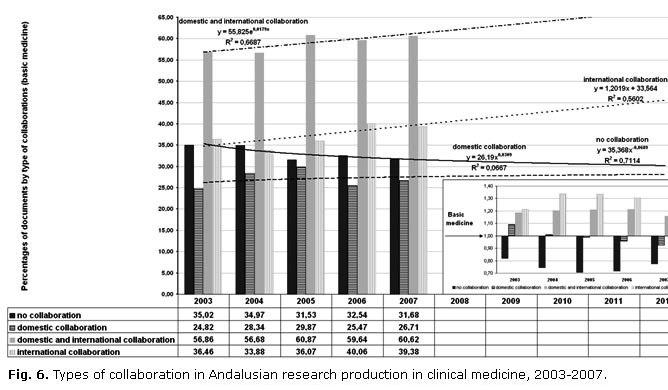
Collaboration patterns also impact visibility. The data showed that both in Andalusia as a whole and in the two specialities analysed, papers involving national or international collaboration had a higher citation rate than the articles authored by a single institution. Throughout the period, basic medicine accounted for higher percentages of national and international collaboration, while a higher percentage of papers written by a single institution dealt with clinical medicine.
Over the years, partnering tended to rise at the expense of single institution authorship (figures 5 and 6). Nonetheless, collaboration rates were highest for papers authored by Spanish institutions only. This behaviour put downward pressure on the papers co-authored with foreign institutions. A substantial share of basic medical research (59 %) was conducted in collaboration with at least one other Spanish institution, while 38 % of the papers were authored with a foreign institution. Nonetheless, participation with foreign partners also followed an upward trend in clinical medicine throughout the period.
The sub-graph at the bottom right in figures 5 and 6 represents the attractivity index for each type of collaboration (with respect to the total citations per paper for the subfield). Figure 5 shows that in basic medicine, the papers authored by a single institution had a lower average number of citations than the subfield as a whole, while those published with foreign institutions had 20 % more citations than the overall mean in 2003 and over 30 % more in the following three years. The only papers that consistently had more than the mean number of citations recorded for the entire subfield was the papers written by more than one Spanish and at least one foreign institution. The patterns observed for clinical medicine differed slightly, since collaboration involving Spanish institutions only did reach visibility levels higher than the mean for clinical medicine as a whole except in 2007 (sub-graph in figure 6).
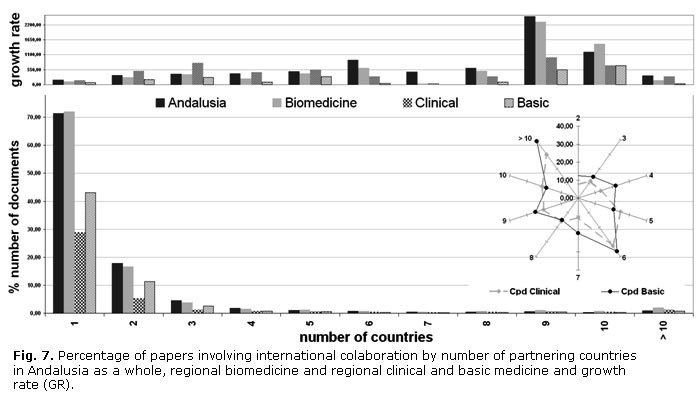
A detailed analysis of the number of participating countries (Fig. 7) showed that international collaboration with a single country accounted for over 40 % of basic medical research output, whereas for clinical medicine the figure was 30 %. This graph corroborates the greater international participation in the former than in the latter, although the papers involving the largest number of participating countries were on clinical research. The number of countries participating in clinical medicine also grew steadily, bringing Andalusian research very close to converging on international publication patterns.
]]> The subgraph in the lower right quadrant in figure 7 shows the citations per paper by number of collaborating countries (VtC) for clinical and basic medicine combined (vertical axis) and the findings for each set of papers authored by X number of countries (from two to ten or over). Basic medicine proved to be more visible when the documents were authored by 2, 3, 6, 7, or 10 or more countries. Finally, while clinical medicine had a larger percentage of papers in which over 10 countries participated, basic medicine had more than the mean number of citations.
SUBJECT SPECIALISATION AND ATTRACTIVITY INDEX
According to prior studies,6-9 the scientific fields in which Andalusia is more specialised than Spain as a whole are biochemistry, genetics and molecular biology (BGMB) and immunology and microbiology (IM). These authors reported that the region is more highly specialised than the European and world-wide mean in biochemistry, pharmacology and immunology. Specialisation in both biochemistry and pharmacology followed a downward trend world-, Europe- and region-wide, while it rose steadily in immunology, in particular beginning in 2003. While the mean for psychology was not higher in Andalusia than in Europe, this discipline exhibited the steepest rise and proved to be an emerging area across the entire period.28
The fields drawing the largest number of citations concurred with the fields where specialisation was greatest, although slight differences were noted. Trends varied across the period, however. While the relative output in immunology declined, the number of citations received rose. The reverse pattern was observed for health, where the rise in output did not carry over to the number of citations. In biology and psychology, however, the raise in the output involved a growth of the number of citations (Fig. 8).
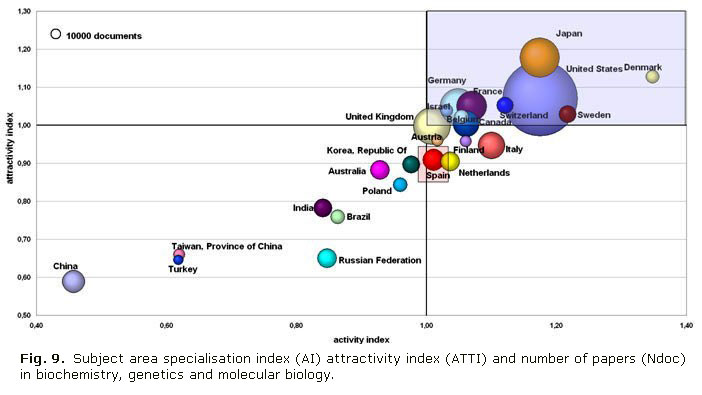
Figure 8 compares each biomedical area to the world mean values. Each bubble represents a subject area and its size is proportional to the number of papers published. Its position on the graph depends on the respective attractivity index values, which are represented on the y-axis, and the specialisation or activity index on the x-axis. The reference axes drawn in black represent the world-wide mean values for each variable. As the graph shows, the areas located in the upper right quadrant have higher values than the world-wide means for both variables, the ones in the lower left quadrant are below the mean in both specialisation and attractivity, the ones in the upper left quadrant have higher than mean attractivity but lower than mean specialisation values and lastly, the ones in the lower right quadrant have lower attractivity but higher specialisation values than the world as a whole. According to the figure, the areas with the highest potential are clearly biochemistry, immunology and pharmacology, located in the upper right quadrant, which contrast in particular with the subjects positioned in the lower left quadrant. Other information of interest with respect to the volume of papers can also be extracted from the figure, however. Publishing a substantial number of papers that outperform the world-wide mean constitutes added value for areas such as biochemistry and medicine compared to the much smaller pharmacology and immunology output. On this measure, the area with greatest international impact is biochemistry.
]]>
This area merits special mention because its indicator values were consistently higher than the world-wide reference values. Spain holds ninth position in the world ranking of knowledge producers by volume in BGMB, accounting for 8 % of Western European and 3 % of world-wide output: i.e., higher than Australia but behind China. Its activity index is slightly higher than the world mean but not so its attractivity index (Fig. 9) or the mean citations per paper. Its position is comparable to the Netherlands', although it stands at a considerable distance from the major producers: United States, Japan, United Kingdom, Germany, France and Canada, all of which are located in the quadrant with the highest international impact. That Denmark, Sweden, Switzerland, Belgium and Israel are in this upper quadrant, they are ranked high despite their relatively scant output. By contrast, so-called emerging countries such as China, Russia, Brazil, Republic of Korea, India and Taiwan are all concentrated in the lower left quadrant.
In the national ranking, biochemistry accounted for a little over 11 % of output and citations, although its relative contribution declined in both respects across the period. The percentage of Andalusian biochemical research papers cited came to 14 % of the nationwide total, which was comparable to the mean for all Spanish regions, and the area boasted a much higher citation rate than other subject categories.
In the last five years of the series, in Andalusia and Spain, collaboration with other institutions and countries was intense, involving nearly a third of the total output. The result was a higher citation rate than for papers involving no collaboration or Spanish collaboration only. Biochemistry was one of the most internationally-oriented areas, with papers co-authored with 23 countries. Bilateral partnering accounted for over 70 % of output. Of the most productive countries, the major partners of Andalusia were United States, United Kingdom, France, Germany and Italy, collaboration with all of which yielded good results in terms of visibility. With the exception of two years in the series, international partnering was more intense in biochemistry than in Spanish research overall.
Finally, a word is in order on an issue of no minor importance. While collaboration constitutes added value that favours output, internationalisation and consequently visibility for a country or region and is normally attained by intensifying international relations, the results of such collaboration must be calibrated in terms of visibility and impact on the international scientific community. In other words, impact/visibility varies depending on the partner. A recent study on citation flows by type of collaboration and neighbourhood influence concluded that science knows no boundaries. The greater influence of certain countries, regions or institutions over others is due to the existence of a number of immediate environs and the quality or prestige that entails. Influence or the citation rate is greatest in authors' most immediate environs, which need not concur with their national surrounds, and wanes with the enlargement of those environs. The bias introduced by self-citation is maximised in smaller circles. Since the greatest domestically-oriented bias appears in small and developing countries, boundaries should be avoided when establishing relationships31. On other hand, assuming that impact (citations per paper) reflects the use made by researchers of previously generated knowledge, the evidence shows that the major producers use the knowledge generated by their own or neighboring countries. This would explain why impact is so highly concentrated in the most productive regions. One of the implications is that research institutions or country reputation is influenced by their geography, and such prestige is often unattainable for institutions/countries in less productive or less advanced regions or countries. Put another way, a research institution's neighborhood may be limited by its global scientific reputation, unless it can reach beyond its neighborhood through inter-regional alliances with reputed institutions from highly productive regions.32 Therefore, the position of these small, highly visible countries may be explained by factors such as size, international collaboration rate, area specialization and the industrial status or stage of emergence of transition economies, while the position of large countries is affected by the environs and the cumulative repute of their institutions.33
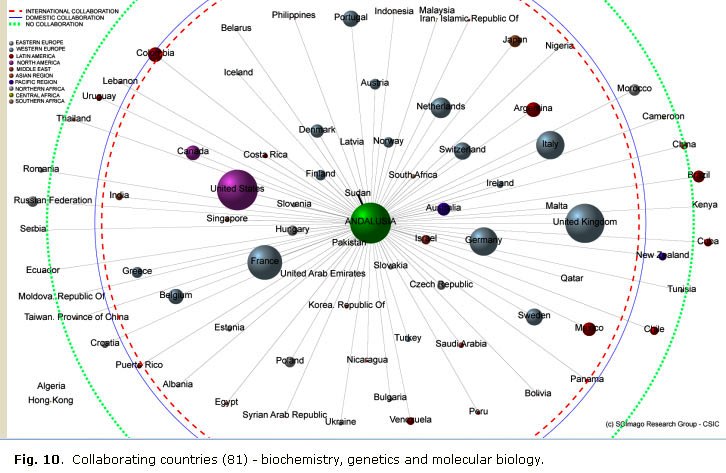
By way of example, the heliocentric network of Andalusia's international collaboration in biochemistry, genetics and molecular biology is shown in figure 10 to gain insight into the effects of collaboration.
The map shows, interestingly, that while international collaboration enhanced visibility, not all countries were equally effective in this regard. The three concentric circles define visibility with respect to the mean citation values for each type of collaboration. Note that in this subject area, the mean citation values for domestic and international collaboration (solid and dashed black lines) are very close. The countries positioned in the vicinity have the highest citation rates and are consequently the most valuable partners. As in the preceding graphs, here volume is also a factor to be borne in mind. Output with France, Germany, United Kingdom, Italy and United States was much more visible than with Australia, Finland, Israel, Pakistan or Sudan, even though these latter countries are closer to the centre. Collaboration with Brazil, Russian Federation and China, in turn, afforded the least visibility, which is why these countries are outliers, with values even lower than for papers involving no collaboration.
]]>
DISCUSSION
The findings, given in the form of indicators and graphics, compare the status of Andalusian scientific output and citations in biomedicine in 1996-2007, as recorded in the Scopus database, to nation- and world-wide data.
The results drawn from the bibliometric indicators on biomedical output in Andalusia show an upward trend, with growth of over 91 %. Over 50 % of the output was in clinical medicine, whose growth doubled the basic medicine figure. Nonetheless, more citable papers (articles, reviews and conference procceedings) were published on basic than clinical medicine, and the number of citations received by the former was also larger. The higher citation rate in basic medicine may also be explained by the fact that fewer of these papers were published in less cited domestic journals. Publication patterns would consequently appear to affect research visibility.
The findings on scientific output and research visibility in Andalusian biomedicine presented here must be viewed in conjunction with other types of indicators to be properly interpreted. The assessment of scientific activity must necessarily be «polyhedral»22,34 to obtain a meaningful overview. That means that bibliometric information, while providing very significant insight into scientific activity, is not the only criterion. It must be studied in conjunction with expert review as well as an assessment of the economic impact or translation of research findings to science, technology and society at large. The results can only be correctly interpreted when account is taken of the organisation of the research system and structure of the academic system to which they refer. Moreover, the results of any bibliometric study depend on the tools, indicators and methodologies used. The focus cannot be confined to what is being measured, but must be enlarged to encompass the universe in which it lies and the aspects of research performance reflected.
The present paper drew from the Scopus database. This is instrumental to interpreting the results and drawing conclusions. The use of Scopus meant that for the first time, a more comprehensive study could be conducted of Andalusian biomedical research, including a very significant part of the scientific output that had been excluded to date in other studies. Likewise for the first time, a more comparison can be drawn with other countries and the world as a whole.
In this context, the huge increase in the number of sources impacted the citation rate, favourably for some countries but in a negative manner for other in which the denominator (number of papers) grew faster than the numerator (number of citations received) in some regions as it is the case in our region of study. Prior analyses relating to publishers' countries and languages of publication showed that many of the journals recently included in Scopus tend to be domestically oriented. An analysis conducted on oncological journals, for instance, revealed that the periodicals listed exclusively in Scopus tended to have lower impact factors than the ones in the WoS, while the journals included in both databases had a higher mean citation rate in Scopus.18 However, the countries, regions, institutions and even individual authors whose total number of papers published was larger in Scopus, saw their citation ranking decline.35-36 As a result, the citation rates of countries that publish primarily in English have barely been affected by the enlargement. A number of papers have provided empirical evidence of the bias that language introduces in the use of WoS-based citation analyses, proving that articles published in other languages have much lower impact factors than papers published in English.29-30
]]> To confirm whether the difference in citations received by biomedical papers produced in Andalusia, as observed in the present study, was due to the language in which they were published, subsequent research is planned to track the papers published in English and Spanish in domestic biomedical journals. In addition, the citation rates in domestically- and internationally-oriented journals, i.e., the ones in both Thomson and Scopus and the ones in Scopus only, will be compared to assess the long-term effects of international accessibility of the former. While the inclusion of such journals may induce a short-term decline in institutions', regions' or countries' citation rates, in the longer run it may entail higher visibility not only for the papers and journals involved, but for research as a whole.Given the international and multidisciplinary nature of biomedicine, partnerships play a very important role both in output and in research visibility and impact. Consequently, information on collaboration patterns and their variation in terms of output and citation should be considered when designing collaboration strategies to improve research visibility, as well as when drafting cooperation and human resource mobility plans and programmes at whatever level (such as scholarships, grants or visiting scholar programmes). Since international collaboration has consistently proven to enhance the number of citations per paper, the characterisation of relationships and alliances with foreign partners is a highly significant issue for managers and decision-makers.37 The ability to position each country in terms of output and effective impact makes heliocentric mapping of international collaboration networks a useful supplementary analysis and decision-making tool. This graphic can be used for both static and dynamic descriptions of an institution, region, country or field of science. An analysis of the variations in these relationships will provide insight into their stability, expandability and visibility, enabling anyone concerned to monitor joint projects and strategic alliances, among others.
Acknowledgements
]]> The present study was funded by the Spanish National Research Council (CSIC) in the framework of the project entitled «Generation of scientometric tools for the analysis of scientific collaboration» (CISC intramural project 200810I210). The authors wish to thank reviewers for their helpful comments on an earlier draft of this paper.
BIBLIOGRAFIC REFERENCES
1. Sanz-Menéndez L, Cruz-Castro L. The Increasing Involvement of Spanish Regional Governments on Science Policy: Demand-Driven Explanations versus Diffusion Models. Durban, South Africa: International Sociological Association Conference; 2006:23-9.
]]>
2. Moed HF. Citation Analysis in Research Evaluation. Dordrecht (the Netherlands): Springer; 2005.
3. Bormann L, Schier H, Marx W, Daniel H. What factors determine citation counts of publications in chemistry besides their quality? J Informetr. 2012; 6:11-8.
4. Bar-Ilan J, Levene M, Lin L. Some measures for comparing citation databases. J Informetr. 2007;1(1):26-34.
5. Bar-Ilan J. Which h-index? - A comparison of WoS, Scopus and Google Scholar. Scientometrics. 2008;74(2):257-71.
6. Moya-Anegón F, Solís-Cabrera FM, Chinchilla-Rodríguez Z. Indicadores Científicos de Andalucía (ISI, Web of Science. 1998-2001). Granada: Programa de Divulgación Científica de Andalucía. Parque de las Ciencias. Secretaría General de Universidades. Junta de Andalucía, 2003.
]]>7. Moya-Anegón F, Solís-Cabrera FM, Carretero-Guerra R, Chinchilla-Rodríguez Z. Indicadores científicos de la producción andaluza en biomedicina y ciencias de la salud (ISI, Web of Science, 1990-2002). Sevilla: Consejería de Salud. Junta de Andalucía; 2004.
8. Moya-Anegón F, Solís-Cabrera F, Muñoz-Fernández FJ, Chinchilla-Rodríguez Z, Corera-Álvarez E, Herrero-Solana V, et al. Indicadores científicos de Andalucía: ISI, Web of Science, 2002. Granada: Consejería de Innovación, Ciencia y Empresa; 2005.
9. Moya-Anegón F, Carretero-Guerra R, Sánchez-Malo F, Solís-Cabrera FM, Muñoz-Fernández FJ, Chinchilla-Rodríguez Z, et al. Indicadores científicos de la producción andaluza en biomedicina y ciencias de la salud. (ISI, Web of Science 2003-2004). Sevilla: Junta de Andalucía, Consejería de Salud; 2006
10. Moya-Anegón F, Solís-Cabrera FM, Corera-Álvarez E, Chinchilla-Rodríguez, Z, Gómez-Crisóstomo R, González-Molina A, Vargas-Quesada B. Indicadores Bibliométricos de la Producción Científica de Andalucía: 2003-2005. Sevilla: Junta de Andalucía; 2008.
11. Zhao D, Strotmann A. Intellectual structure of stem cell research: a comprehensive author co-citation analysis of a highly collaborative and multidisciplinary field. Scientometrics. 2011;87(1):115-31.
12. González-Pereira B, Guerrero-Bote VP, Moya-Anegón F. A new approach to the metric of journals'scientific prestige: The SJR indicator. J Informetr. 2011;4(3):379-91.
13. MacRoberts MH, MacRoberts BR. Problems of citation analysis. Scientometrics. 1996;36(3):435-44.
]]>14. Seglen PO. Why the impact factor of journals should not be used for evaluating research. Brit Med J. 1997;314(7079):498502.
15. Braun T, Glänzel W, Schubert A. World flash on basic research The newest version of the facts and figures on publication output and relative citation impact of 100 countries 19811985. Scientometrics. 1988;13:181-8.
16. Van Raan AFJ. Measuring Science. In: Moed HF, Glänzel W, Schmoch U, editors. Handbook of quantitative science and technology research. The use of publication and patent statistics in studies of S&T systems. Dordrecht (the Netherlands): Kluwer Academic Publishers; 2004. p. 1950.
17. Grupo SCImago. SCImago journal & country rank: un nuevo portal, dos nuevos rankings. El profesional de la información. 2007;16(6):645-6.
]]>18. López-Illescas C, Moya-Anegón F, Moed HF. Coverage and citation impact of oncological journals in the Web of Science and Scopus. J Informetr. 2008;2(4):304-16.
19. Moya-Anegón F, Chinchilla-Rodríguez Z, Benavent-Pérez M, Corera-Álvarez E, González-Molina A, Vargas-Quesada B. Indicadores Bibliométricos de la Actividad Científica Española: 2008. Madrid: Fundación Española para la Ciencia y la Tecnología; 2011.
20. Moya-Anegón F, Chinchilla-Rodríguez Z, Vargas-Quesada B, Corera-Álvarez E, Muñoz-Fernández FJ, González-Molina A. Coverage analysis of Scopus: A journal metric approach. Scientometrics. 2007;73(1):53-78.
]]>
21. Schubert A, Braun T. Relative indicators and relational charts for comparative assessment of publication output and citation impact. Scientometrics. 1986;9(5-6):281-91.
22. Chinchilla-Rodríguez Z. Análisis del dominio científico español: 1995-2002. ISI, Web of Science [PhD Dissertation]. Granada: Universidad de Granada; 2005.
23. Chinchilla-Rodríguez Z, Vargas-Quesada B, Hassan-Montero Y, González-Molina A, Moya-Anegón F. New approach to the visualization of international scientific collaboration. Information Visualization. 2010;9(4):277-87.
24. Chinchilla-Rodríguez Z, Moya-Anegón F, Vargas-Quesada B, Corera-Álvarez E, Hassan-Montero Y. Inter-institutional scientific collaboration: an approach from social network analysis. Mexico D. F.: Paper presented at Prime Europe-Latin American Conference on Science and Innovation Policy; 2008.
25. Kamada T, Kawai S. An algorithm for drawing general undirected graphs. Information Processing Letters. 1989;31(1):7-15.
26. Vargas-Quesada B, Moya-Anegón F. Visualizing the structure of science. Berlin: Springer-Verlag; 2007.
27. Batagelj V, Mrvar A. Analysis and visualization of large networks. In: Jünger M, Mutzel P (eds.). Graph Drawing Software. Berlin: Springer. 2003. pp. 77-103.
28. Moya-Anegón F, Chinchilla-Rodríguez Z. Indicadores Bibliométricos de la Actividad Científica Española, 2002-2006. Madrid: Fundación Española para la Ciencia y la Tecnología; 2008.
]]>29. Van Leeuwen TN, Moed HF, Tijssen RJW, Visser MS, Van Raan AFJ. First Evidence of serious language-bias in the use of citation analysis for the evaluation of national science systems. Research Evaluation. 2000;9(2):1556.
30. Van Leeuwen TN, Moed HF, Tijssen RJW, Visser MS, Van Raan AFJ. Language biases in the coverage of the Science Citation Index and its consequences for international comparisons of national research performance. Scientometrics. 2001;51(1):335-46.
31. Lancho-Barrantes BS, Guerrero-Bote VP, Chinchilla-Rodríguez Z, Moya-Anegón F. Citation flows in the zones of influence of scientific collaborations. J Am Soc Inform Sci Technol. 2011;63(3):481-9.
32. SCImago Lab. Scientific Excellence Georeferenced. The neigborhood matters Retrieved [Internet]. 2011 [cited 2011 October 25] Available from: http://www.scimagolab.com/blog/2011/scientific-excellence-georeferenced-theneighborhood-matters
]]>33. Chinchilla-Rodríguez Z, Benavent-Pérez M, Miguel S, Moya-Anegón F. International Collaboration in Medical Research in Central and South America (In press). J Am Soc Inform Sci Technol. Febrero 2012.
34. Camí J, Méndez-Vásquez RI, Suñén-Pinyol E. Evolución de la productividad científica de España en Biomedicina (1981-2006). Redes. 2008 [cited 2011 March 16];10:24-9. Available from: http://bac.prbb.org/publicacions/Redes.pdf
35. Zitt M, Ramana-Rahary S, Bassecoulard E. Correcting glasses help fair comparisons in international science landscape: country indicators as a function of ISI database delineation. Scientometrics. 2003;56(2):59282.
36. López-Illescas C, Moya-Anegón F, Moed HF. Comparing bibliometric country-by-country rankings derived from the Web of Science and Scopus: the effect of poorly cited journals in oncology. J Inform Sci. 2008;35(2):244-56.
37. Perianes-Rodríguez A, Chinchilla-Rodríguez, Z, Vargas-Quesada B, Olmeda-Gómez C, Moya-Anegón F. Synthetic hybrid indicators based on scientific collaboration to quantify and evaluate individual research results. J Informetr. 2009;3(2):91-101.
Recibido 21-3-2012.
Aceptado 11-6-2012.
