<?xml version="1.0" encoding="ISO-8859-1"?><article xmlns:mml="http://www.w3.org/1998/Math/MathML" xmlns:xlink="http://www.w3.org/1999/xlink" xmlns:xsi="http://www.w3.org/2001/XMLSchema-instance">
<front>
<journal-meta>
<journal-id>1561-3003</journal-id>
<journal-title><![CDATA[Revista Cubana de Higiene y Epidemiología]]></journal-title>
<abbrev-journal-title><![CDATA[Rev Cubana Hig Epidemiol]]></abbrev-journal-title>
<issn>1561-3003</issn>
<publisher>
<publisher-name><![CDATA[Centro Nacional de Información de Ciencias MédicasEditorial Ciencias Médicas]]></publisher-name>
</publisher>
</journal-meta>
<article-meta>
<article-id>S1561-30032000000300002</article-id>
<title-group>
<article-title xml:lang="es"><![CDATA[Análisis de las enfermedades trasmitidas por alimentos, 1980-1998]]></article-title>
</title-group>
<contrib-group>
<contrib contrib-type="author">
<name>
<surname><![CDATA[Carrera Vara]]></surname>
<given-names><![CDATA[José Antonio]]></given-names>
</name>
<xref ref-type="aff" rid="A01"/>
</contrib>
<contrib contrib-type="author">
<name>
<surname><![CDATA[Márquez Rodríguez]]></surname>
<given-names><![CDATA[Humberto]]></given-names>
</name>
<xref ref-type="aff" rid="A02"/>
</contrib>
<contrib contrib-type="author">
<name>
<surname><![CDATA[Castro Domínguez]]></surname>
<given-names><![CDATA[Arnaldo]]></given-names>
</name>
<xref ref-type="aff" rid="A01"/>
</contrib>
<contrib contrib-type="author">
<name>
<surname><![CDATA[Mitidieri Jorge]]></surname>
<given-names><![CDATA[Danilo]]></given-names>
</name>
</contrib>
</contrib-group>
<aff id="A01">
<institution><![CDATA[,Ministerio de Salud Pública  ]]></institution>
<addr-line><![CDATA[ ]]></addr-line>
</aff>
<aff id="A02">
<institution><![CDATA[,Centro Provincial de Higiene y Epidemiología, Pinar del Río  ]]></institution>
<addr-line><![CDATA[ ]]></addr-line>
</aff>
<pub-date pub-type="pub">
<day>00</day>
<month>12</month>
<year>2000</year>
</pub-date>
<pub-date pub-type="epub">
<day>00</day>
<month>12</month>
<year>2000</year>
</pub-date>
<volume>38</volume>
<numero>3</numero>
<fpage>167</fpage>
<lpage>174</lpage>
<copyright-statement/>
<copyright-year/>
<self-uri xlink:href="http://scielo.sld.cu/scielo.php?script=sci_arttext&amp;pid=S1561-30032000000300002&amp;lng=en&amp;nrm=iso"></self-uri><self-uri xlink:href="http://scielo.sld.cu/scielo.php?script=sci_abstract&amp;pid=S1561-30032000000300002&amp;lng=en&amp;nrm=iso"></self-uri><self-uri xlink:href="http://scielo.sld.cu/scielo.php?script=sci_pdf&amp;pid=S1561-30032000000300002&amp;lng=en&amp;nrm=iso"></self-uri><abstract abstract-type="short" xml:lang="es"><p><![CDATA[Se analizó y evaluó el comportamiento de los brotes epidémicos de las enfermedades transmitidas por alimentos, en Pinar del Río en los últimos 18 años. Se comprobó el número de brotes y el total de personas afectadas en los diferentes años, así como en los municipios donde ocurrió. También se identificaron los principales alimentos involucrados y los agentes causales productores de estas enfermedades, los sitios de ocurrencia y los factores que han contribuido a la aparición de estos brotes. Toda la información se obtuvo a través de la vigilancia epidemiológica de las enfermedades transmitidas por alimentos, que se estableció en la década de los 70. En Cuba es obligatorio el reporte y estudio de los brotes de enfermedades transmitidas por alimentos. Se determinó que el estafilococo aureus constituyó el agente causal más frecuente en los brotes, aunque en los últimos años, se han incrementado otros patógenos como son la Salmonella, E coli y Shigella. El tiempo prolongado entre elaboración y consumo de alimentos es el factor más importante como causa de estas enfermedades en el país.]]></p></abstract>
<abstract abstract-type="short" xml:lang="en"><p><![CDATA[The behaviour of the epidemic outbreaks of food-borne diseases, in Pinar del Rio province in the last 18 years was analyzed and evaluated. The number of outbreaks and the total of people affected in the different years as well as the municipalities where they took place were checked. The main food involved, the causal agents producing these diseases, places of occurrence and the factors that have contributed to the appearence of these outbreaks were also identified. All the information was obtained through the epidemiological surveillance of food-borne diseases, which was established in the decade of the 70' s. In Cuba the report and study of food-borne diseases outbreaks is compulsory. Is was determined that the staphylococcus aureus was the causal agent more frequent in the outbreaks, though in the last years, other pathogens such as Salmomella, E. Coli and Shigella have increased. The prolonged time between food preparation and their consumption is the most important factor as a cause of these diseases in the country.]]></p></abstract>
<kwd-group>
<kwd lng="es"><![CDATA[Vigilancia Epidemiológica]]></kwd>
<kwd lng="es"><![CDATA[Factores de Riesgo]]></kwd>
<kwd lng="es"><![CDATA[Pinar del Río]]></kwd>
<kwd lng="es"><![CDATA[Manipulación de Alimentos]]></kwd>
<kwd lng="en"><![CDATA[EPIDEMIOLOGIC SURVEILLANCE]]></kwd>
<kwd lng="en"><![CDATA[FOOD MICROBIOLOGY]]></kwd>
<kwd lng="en"><![CDATA[SALMONELLA INFECTIONS]]></kwd>
</kwd-group>
</article-meta>
</front><body><![CDATA[ <p> <a href="hie03300.htm"> </a>Ministerio de Salud P&uacute;blica. Unidad Nacional    de Salud Ambiental </p>  <h2>  An&aacute;lisis de las enfermedades trasmitidas por alimentos, 1980-1998</h2>  <i><a href="#*">Dr. Jos&eacute; Antonio Carrera Vara,<sup>1</sup> Dr. Humberto  M&aacute;rquez Rodr&iacute;guez,<sup>2</sup> Dr. Arnaldo Castro Dom&iacute;nguez<sup>3</sup>  y Lic. Danilo Mitidieri Jorge<sup>4</sup></a></i>  <h4>      <br>  RESUMEN</h4>  Se analiz&oacute; y evalu&oacute; el comportamiento de los brotes epid&eacute;micos  de las enfermedades transmitidas por alimentos, en Pinar del R&iacute;o  en los &uacute;ltimos 18 a&ntilde;os. Se comprob&oacute; el n&uacute;mero  de brotes y el total de personas afectadas en los diferentes a&ntilde;os,  as&iacute; como en los municipios donde ocurri&oacute;. Tambi&eacute;n  se identificaron los principales alimentos involucrados y los agentes causales  productores de estas enfermedades, los sitios de ocurrencia y los factores  que han contribuido a la aparici&oacute;n de estos brotes. Toda la informaci&oacute;n  se obtuvo a trav&eacute;s de la vigilancia epidemiol&oacute;gica de las  enfermedades transmitidas por alimentos, que se estableci&oacute; en la  d&eacute;cada de los 70. En Cuba es obligatorio el reporte y estudio de  los brotes de enfermedades transmitidas por alimentos. Se determin&oacute;  que el estafilococo aureus constituy&oacute; el agente causal m&aacute;s  frecuente en los brotes, aunque en los &uacute;ltimos a&ntilde;os, se han  incrementado otros pat&oacute;genos como son la Salmonella, E coli y Shigella.  El tiempo prolongado entre elaboraci&oacute;n y consumo de alimentos es  el factor m&aacute;s importante como causa de estas enfermedades en el  pa&iacute;s.      <p><i>Descriptores DeCs:</i> Vigilancia Epidemiol&oacute;gica. Factores  de Riesgo; Pinar del R&iacute;o/Intoxicaci&oacute;n Alimentaria/Etiolog&iacute;a.  Manipulaci&oacute;n de Alimentos/Inspecci&oacute;n de Alimentos.  <h4>      <br>  Programa para el c&aacute;lculo de los a&ntilde;os de vida perdidos (AVP)</h4>  En un art&iacute;culo publicado en esta revista,<sup>1</sup> los autores  presentaron una revisi&oacute;n de todos los conceptos fundamentales asociados  a la evaluaci&oacute;n de la carga de las enfermedades mediante el indicador  A&ntilde;os de Vida Ajustados por Discapacidad (AVAD). Para esa revisi&oacute;n  los autores se basaron, entre otros trabajos, en el Tomo I de la Serie  de 10 Tomos <i>The Global Burden of Disease and Injury Series</i><sup>2</sup>  (GBD).      <p>En este trabajo se emplean los mismos conceptos y notaciones empleados  en el art&iacute;culo de <i>Seuc, Dom&iacute;nguez y D&iacute;az</i>.<sup>1  </sup>Se  presenta un software para el c&aacute;lculo de los AVP (DALY. EXE), codificado  en Turbo Basic,<sup>3</sup> y con los m&oacute;dulos siguientes (fig.):  a) m&oacute;dulo VIMAX: Este m&oacute;dulo determina las esperanzas de  vida que se utilizar&aacute;n para el c&aacute;lculo de los AVP. Se utiliza  la opci&oacute;n "A&ntilde;os de Vida Esperados Est&aacute;ndar Perdidos  (AVEEP)", que toma como referencia las esperanzas de vida en Jap&oacute;n  seg&uacute;n el modelo "Coale and Demeny West Level 26" con una esperanza  de vida al nacer para mujeres de 82,5 a&ntilde;os y para hombres de 80  a&ntilde;os.      <center>      <p><A HREF="/img/revistas/hie/v38n3/f0102300.jpg"><IMG SRC="/img/revistas/hie/v38n3/f0102300.jpg" ALT="
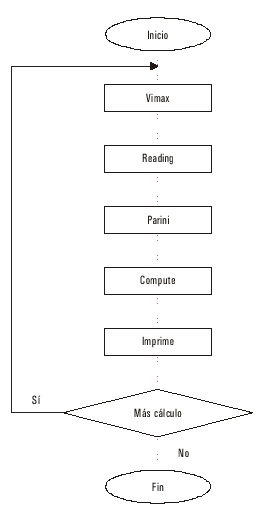
FIG. Diagrama de flujo del programa DALY." BORDER=1 height=216 width=121></a>      
<p>FIG. <i>Diagrama de flujo del programa DALY.</i></center>        <p>Espec&iacute;ficamente las esperanzas de vida para cada edad se tomaron  de la Tabla 1.1, p&aacute;g. 17, en <i>Murray &amp; Lopez</i>;<sup>2 </sup>en  esta tabla las esperanzas aparecen en general para cada 5 a&ntilde;os,  es decir, para las edades 0, 1, 5, 10, 15, ..., 100. Para las edades intermedias  las esperanzas se asignaron de manera escalonada, o sea, para cada edad  entre "i" e "i + 5" se asign&oacute; la esperanza correspondiente a la  edad "i". b) M&oacute;dulo READING: en este m&oacute;dulo se leen los datos  a procesar. La estructura de estos datos debe ser la siguiente: i) n&uacute;mero  de Grupos que se comparan, ii) n&uacute;mero de edades diferentes en las  que ocurren muertes, iii) relaci&oacute;n de edades en la que ocurren muertes,  y iv) frecuencia de muertes para las edades relacionadas en iii). Se dan  opciones para entrar datos separados o no por sexo, y para entrar los datos  por teclado o leyendo desde un fichero. c) M&oacute;dulo PARINI: en este  m&oacute;dulo se determinan los par&aacute;metros que se utilizar&aacute;n  para el c&aacute;lculo de los AVP. Hay 3 par&aacute;metros susceptibles  de ser modificados: el par&aacute;metro K (entre 0 y 1) indica si se utilizar&aacute;  la ponderaci&oacute;n por edad determinada por el par&aacute;metro b (K  = 1) o si se considerar&aacute; una ponderaci&oacute;n uniforme (K = 0);  el par&aacute;metro b indica la ponderaci&oacute;n por edad utilizada (en  GBD se emple&oacute; b = 0,04), que da mayor peso a edades alrededor de  los 20 a 25 a&ntilde;os); y el par&aacute;metro r que indica el porcentaje  de descuento anual que sufre un a&ntilde;o de vida saludable (en GBD se  emple&oacute; r = 0,03). d) M&oacute;dulo COMPUTE: en este m&oacute;dulo  se efect&uacute;an los c&aacute;lculos, seg&uacute;n las f&oacute;rmulas  presentadas en el art&iacute;culo de <i>Seuc, Dom&iacute;nguez y Diaz</i>.<sup>1</sup>  e) M&oacute;dulo IMPRIME: este m&oacute;dulo presenta en pantalla y, opcionalmente  guarda en disco, los resultados del procesamiento.      <p>Los m&oacute;dulos anteriores han sido integrados en el programa seg&uacute;n  el diagrama de flujo que se presenta en el Anexo. En proceso de terminaci&oacute;n  se encuentra el m&oacute;dulo que calcula los a&ntilde;os de vida saludable  perdidos como consecuencia de vivir con una determinada discapacidad por  un determinado per&iacute;odo de a&ntilde;os.  <h4>      ]]></body>
<body><![CDATA[<br>  Algunos resultados</h4>  El programa DALY.EXE descrito anteriormente fue aplicado a los datos contenidos  en dos tablas del Anuario estad&iacute;stico 1997, elaborado por la Direcci&oacute;n  Nacional de Estad&iacute;stica del Ministerio de Salud P&uacute;blica de  Cuba.<sup>4</sup> Las 2 tablas utilizadas son la tabla de defunciones y  tasas seg&uacute;n<i> </i>grupos de edad, 1970, 1975-1997 (p&aacute;g.  23), y la tabla de Mortalidad seg&uacute;n grupos de edad y provincias  de residencia, 1997 (p&aacute;g. 24).      <p>Estas tablas se seleccionaron para ilustrar la aplicaci&oacute;n del  programa y la interpretaci&oacute;n de los resultados; para ello era fundamental  que las tablas reflejaran las muertes por (grupos de edad), lo cual ocurr&iacute;a  en ambos casos. Otras tablas (por ejemplo la de mortalidad por 6 grandes  grupos de causas seg&uacute;n edad, 1988 y 1997) hubieran sido incluso  de mayor inter&eacute;s que las 2 seleccionadas, pero el formato de los  datos no permit&iacute;an una aplicaci&oacute;n l&oacute;gica del programa.  De igual forma se habr&iacute;a deseado ilustrar la aplicaci&oacute;n del  procedimiento para datos referidos a a&ntilde;os vividos con distintas  discapacidades, pero estad&iacute;sticas de este tipo no se presentan en  el Anuario estad&iacute;stico del MINSAP, y en general son de muy dif&iacute;cil  obtenci&oacute;n. La inclusi&oacute;n de datos sobre discapacidades en  los Anuarios estad&iacute;sticos del MINSAP constituye un reto muy grande  que, no obstante, valdr&iacute;a la pena enfrentar.      <p>En las dos tablas seleccionadas los grupos de edades presentados son:  1) menos de 1 a&ntilde;o, 2) entre 1 y 4 a&ntilde;os, 3) entre 5 y 14 a&ntilde;os,  4) entre 15 y 49 a&ntilde;os, 5) entre 50 y 64 a&ntilde;os y 6) 65 a&ntilde;os  o m&aacute;s.      <p>Las edades para las cuales se consider&oacute; que hab&iacute;an ocurrido  las muertes en cada intervalo fueron las marcas de clase enteras de cada  intervalo, aproximando hacia arriba; por tanto, las edades en las cuales  se consider&oacute; que hab&iacute;an ocurrido las muertes para los intervalos  anteriores fueron 1, 3, 10, 32, 58 y 70. El valor 70 para el &uacute;ltimo  intervalo (abierto por la derecha) se tom&oacute; arbitrariamente.      <p>En este art&iacute;culo calculamos las tasas (&acute; 1 000) de mortalidad  y de AVP, tanto para a&ntilde;os 1970-1997 como para las 15 provincias  del pa&iacute;s; el presentar las tasas por supuesto impide que los resultados  est&eacute;n influenciados por el incremento sistem&aacute;tico que ha  tenido la poblaci&oacute;n de nuestro pa&iacute;s desde 1970, as&iacute;  como por los diferentes tama&ntilde;os de las poblaciones de las 15 provincias  en 1997.      <p>Las tasas (x1 000) de AVP se calcularon para 6 combinaciones de los  par&aacute;metros K y r (en todos los casos se mantuvo b = 0,04); las seis  combinaciones fueron: 1) COMB1: K = 1; r = 0,03 (combinaci&oacute;n usada  en GBD), 2) COMB2: K = 0; r = 0,03, 3. COMB3: K = 0,5; r = 0,03, 4) COMB4:  K = 1; r = 0, 5) COMB 5: K = 1; r = 0,06 y 6) COMB 6: K = 0; r = 0      <p>La tabla 1A presenta las tasas (x 1 000) de mortalidad y de AVP para  las 6 combinaciones de los par&aacute;metros K y r, para los a&ntilde;os  1970, 1975, 1980-1997; la tabla 1B presenta los rangos para las tasas de  mortalidad, y los rangos para las 6 combinaciones de los par&aacute;metros  de las tasas de AVP.      <br>&nbsp;      <br>&nbsp;      <br>      ]]></body>
<body><![CDATA[<p>      <center>TABLA 1A. <i>Tasas (x 1 000) de mortalidad y de AVP, para 6 combinaciones  de los par&aacute;metros "K" y "r", para los a&ntilde;os 1970, 1975, 1980-1997</i></center>        <center><table CELLPADDING=5 >  <tr>  <td VALIGN=TOP WIDTH="13%">&nbsp;</td>    <td VALIGN=TOP WIDTH="13%">      <center>Tasa de Mortalidad</center>  </td>    <td VALIGN=TOP COLSPAN="2" WIDTH="25%">      <center>Tasas de AVP ( x 1 000)</center>  </td>    <td VALIGN=TOP WIDTH="13%">&nbsp;</td>    <td VALIGN=TOP WIDTH="13%">&nbsp;</td>    <td VALIGN=TOP WIDTH="13%">&nbsp;</td>    <td VALIGN=TOP WIDTH="13%">&nbsp;</td>  </tr>    <tr>  <td VALIGN=TOP WIDTH="13%">A&ntilde;o&nbsp;</td>    <td VALIGN=TOP WIDTH="13%">      <center>(x 1000)</center>  </td>    <td VALIGN=TOP WIDTH="13%">      <center>COMB1</center>  </td>    <td VALIGN=TOP WIDTH="13%">      <center>COMB2</center>  </td>    <td VALIGN=TOP WIDTH="13%">      <center>COMB3</center>  </td>    <td VALIGN=TOP WIDTH="13%">      <center>COMB4</center>  </td>    <td VALIGN=TOP WIDTH="13%">      ]]></body>
<body><![CDATA[<center>COMB5</center>  </td>    <td VALIGN=TOP WIDTH="13%">      <center>COMB6</center>  </td>  </tr>    <tr>  <td VALIGN=TOP WIDTH="13%">1970</td>    <td VALIGN=TOP WIDTH="13%">      <center>6,27</center>  </td>    <td VALIGN=TOP WIDTH="13%">      <center>104,54</center>  </td>    <td VALIGN=TOP WIDTH="13%">      <center>117,77</center>  </td>    <td VALIGN=TOP WIDTH="13%">      <center>111,15</center>  </td>    <td VALIGN=TOP WIDTH="13%">      <center>200,26</center>  </td>    <td VALIGN=TOP WIDTH="13%">      <center>67,91</center>  </td>    <td VALIGN=TOP WIDTH="13%">      <center>221,86</center>  </td>  </tr>    <tr>  <td VALIGN=TOP WIDTH="13%">1975</td>    <td VALIGN=TOP WIDTH="13%">      <center>5,48</center>  </td>    <td VALIGN=TOP WIDTH="13%">      ]]></body>
<body><![CDATA[<center>81,87</center>  </td>    <td VALIGN=TOP WIDTH="13%">      <center>96,46</center>  </td>    <td VALIGN=TOP WIDTH="13%">      <center>89,17</center>  </td>    <td VALIGN=TOP WIDTH="13%">      <center>146,93</center>  </td>    <td VALIGN=TOP WIDTH="13%">      <center>55,37</center>  </td>    <td VALIGN=TOP WIDTH="13%">      <center>170,31</center>  </td>  </tr>    <tr>  <td VALIGN=TOP WIDTH="13%">1980</td>    <td VALIGN=TOP WIDTH="13%">      <center>5,70</center>  </td>    <td VALIGN=TOP WIDTH="13%">      <center>77,61</center>  </td>    <td VALIGN=TOP WIDTH="13%">      <center>95,15</center>  </td>    <td VALIGN=TOP WIDTH="13%">      <center>86,38</center>  </td>    <td VALIGN=TOP WIDTH="13%">      ]]></body>
<body><![CDATA[<center>128,88</center>  </td>    <td VALIGN=TOP WIDTH="13%">      <center>54,71</center>  </td>    <td VALIGN=TOP WIDTH="13%">      <center>157,19</center>  </td>  </tr>    <tr>  <td VALIGN=TOP WIDTH="13%">1981</td>    <td VALIGN=TOP WIDTH="13%">      <center>5,94</center>  </td>    <td VALIGN=TOP WIDTH="13%">      <center>79,69</center>  </td>    <td VALIGN=TOP WIDTH="13%">      <center>98,36</center>  </td>    <td VALIGN=TOP WIDTH="13%">      <center>89,03</center>  </td>    <td VALIGN=TOP WIDTH="13%">      <center>131,18</center>  </td>    <td VALIGN=TOP WIDTH="13%">      <center>56,45</center>  </td>    <td VALIGN=TOP WIDTH="13%">      <center>161,14</center>  </td>  </tr>    <tr>  <td VALIGN=TOP WIDTH="13%">1982</td>    <td VALIGN=TOP WIDTH="13%">      ]]></body>
<body><![CDATA[<center>5,73</center>  </td>    <td VALIGN=TOP WIDTH="13%">      <center>77,58</center>  </td>    <td VALIGN=TOP WIDTH="13%">      <center>95,42</center>  </td>    <td VALIGN=TOP WIDTH="13%">      <center>86,50</center>  </td>    <td VALIGN=TOP WIDTH="13%">      <center>128,40</center>  </td>    <td VALIGN=TOP WIDTH="13%">      <center>54,79</center>  </td>    <td VALIGN=TOP WIDTH="13%">      <center>157,10</center>  </td>  </tr>    <tr>  <td VALIGN=TOP WIDTH="13%">1983</td>    <td VALIGN=TOP WIDTH="13%">      <center>5,91</center>  </td>    <td VALIGN=TOP WIDTH="13%">      <center>78,18</center>  </td>    <td VALIGN=TOP WIDTH="13%">      <center>97,21</center>  </td>    <td VALIGN=TOP WIDTH="13%">      ]]></body>
<body><![CDATA[<center>87,70</center>  </td>    <td VALIGN=TOP WIDTH="13%">      <center>128,35</center>  </td>    <td VALIGN=TOP WIDTH="13%">      <center>55,50</center>  </td>    <td VALIGN=TOP WIDTH="13%">      <center>158,51</center>  </td>  </tr>    <tr>  <td VALIGN=TOP WIDTH="13%">1984</td>    <td VALIGN=TOP WIDTH="13%">      <center>6,01</center>  </td>    <td VALIGN=TOP WIDTH="13%">      <center>79,17</center>  </td>    <td VALIGN=TOP WIDTH="13%">      <center>98,72</center>  </td>    <td VALIGN=TOP WIDTH="13%">      <center>88,95</center>  </td>    <td VALIGN=TOP WIDTH="13%">      <center>128,87</center>  </td>    <td VALIGN=TOP WIDTH="13%">      <center>56,41</center>  </td>    <td VALIGN=TOP WIDTH="13%">      ]]></body>
<body><![CDATA[<center>160,01</center>  </td>  </tr>    <tr>  <td VALIGN=TOP WIDTH="13%">1985</td>    <td VALIGN=TOP WIDTH="13%">      <center>6,40</center>  </td>    <td VALIGN=TOP WIDTH="13%">      <center>84,73</center>  </td>    <td VALIGN=TOP WIDTH="13%">      <center>105,28</center>  </td>    <td VALIGN=TOP WIDTH="13%">      <center>95,00</center>  </td>    <td VALIGN=TOP WIDTH="13%">      <center>139,03</center>  </td>    <td VALIGN=TOP WIDTH="13%">      <center>60,15</center>  </td>    <td VALIGN=TOP WIDTH="13%">      <center>171,68</center>  </td>  </tr>    <tr>  <td VALIGN=TOP WIDTH="13%">1986</td>    <td VALIGN=TOP WIDTH="13%">      <center>6,22</center>  </td>    <td VALIGN=TOP WIDTH="13%">      <center>80,97</center>  </td>    <td VALIGN=TOP WIDTH="13%">      ]]></body>
<body><![CDATA[<center>101,42</center>  </td>    <td VALIGN=TOP WIDTH="13%">      <center>91,20</center>  </td>    <td VALIGN=TOP WIDTH="13%">      <center>130,47</center>  </td>    <td VALIGN=TOP WIDTH="13%">      <center>57,99</center>  </td>    <td VALIGN=TOP WIDTH="13%">      <center>163,06</center>  </td>  </tr>    <tr>  <td VALIGN=TOP WIDTH="13%">1987</td>    <td VALIGN=TOP WIDTH="13%">      <center>6,33</center>  </td>    <td VALIGN=TOP WIDTH="13%">      <center>81,84</center>  </td>    <td VALIGN=TOP WIDTH="13%">      <center>102,88</center>  </td>    <td VALIGN=TOP WIDTH="13%">      <center>92,36</center>  </td>    <td VALIGN=TOP WIDTH="13%">      <center>131,69</center>  </td>    <td VALIGN=TOP WIDTH="13%">      ]]></body>
<body><![CDATA[<center>58,68</center>  </td>    <td VALIGN=TOP WIDTH="13%">      <center>165,03</center>  </td>  </tr>    <tr>  <td VALIGN=TOP WIDTH="13%">1988</td>    <td VALIGN=TOP WIDTH="13%">      <center>6,53</center>  </td>    <td VALIGN=TOP WIDTH="13%">      <center>83,63</center>  </td>    <td VALIGN=TOP WIDTH="13%">      <center>105,67</center>  </td>    <td VALIGN=TOP WIDTH="13%">      <center>94,65</center>  </td>    <td VALIGN=TOP WIDTH="13%">      <center>133,53</center>  </td>    <td VALIGN=TOP WIDTH="13%">      <center>60,19</center>  </td>    <td VALIGN=TOP WIDTH="13%">      <center>168,37</center>  </td>  </tr>    <tr>  <td VALIGN=TOP WIDTH="13%">1989</td>    <td VALIGN=TOP WIDTH="13%">      <center>6,41</center>  </td>    <td VALIGN=TOP WIDTH="13%">      ]]></body>
<body><![CDATA[<center>81,44</center>  </td>    <td VALIGN=TOP WIDTH="13%">      <center>103,31</center>  </td>    <td VALIGN=TOP WIDTH="13%">      <center>92,38</center>  </td>    <td VALIGN=TOP WIDTH="13%">      <center>129,20</center>  </td>    <td VALIGN=TOP WIDTH="13%">      <center>58,80</center>  </td>    <td VALIGN=TOP WIDTH="13%">      <center>163,74</center>  </td>  </tr>    <tr>  <td VALIGN=TOP WIDTH="13%">1990</td>    <td VALIGN=TOP WIDTH="13%">      <center>6,80</center>  </td>    <td VALIGN=TOP WIDTH="13%">      <center>84,51</center>  </td>    <td VALIGN=TOP WIDTH="13%">      <center>108,37</center>  </td>    <td VALIGN=TOP WIDTH="13%">      <center>96,44</center>  </td>    <td VALIGN=TOP WIDTH="13%">      ]]></body>
<body><![CDATA[<center>132,73</center>  </td>    <td VALIGN=TOP WIDTH="13%">      <center>61,36</center>  </td>    <td VALIGN=TOP WIDTH="13%">      <center>170,00</center>  </td>  </tr>    <tr>  <td VALIGN=TOP WIDTH="13%">1991</td>    <td VALIGN=TOP WIDTH="13%">      <center>6,71</center>  </td>    <td VALIGN=TOP WIDTH="13%">      <center>83,62</center>  </td>    <td VALIGN=TOP WIDTH="13%">      <center>106,98</center>  </td>    <td VALIGN=TOP WIDTH="13%">      <center>95,30</center>  </td>    <td VALIGN=TOP WIDTH="13%">      <center>131,25</center>  </td>    <td VALIGN=TOP WIDTH="13%">      <center>60,72</center>  </td>    <td VALIGN=TOP WIDTH="13%">      <center>167,90</center>  </td>  </tr>    <tr>  <td VALIGN=TOP WIDTH="13%">1992</td>    <td VALIGN=TOP WIDTH="13%">      ]]></body>
<body><![CDATA[<center>6,97</center>  </td>    <td VALIGN=TOP WIDTH="13%">      <center>84,44</center>  </td>    <td VALIGN=TOP WIDTH="13%">      <center>109,51</center>  </td>    <td VALIGN=TOP WIDTH="13%">      <center>916,97</center>  </td>    <td VALIGN=TOP WIDTH="13%">      <center>130,70</center>  </td>    <td VALIGN=TOP WIDTH="13%">      <center>61,78</center>  </td>    <td VALIGN=TOP WIDTH="13%">      <center>169,51</center>  </td>  </tr>    <tr>  <td VALIGN=TOP WIDTH="13%">1993</td>    <td VALIGN=TOP WIDTH="13%">      <center>7,19</center>  </td>    <td VALIGN=TOP WIDTH="13%">      <center>85,62</center>  </td>    <td VALIGN=TOP WIDTH="13%">      <center>111,95</center>  </td>    <td VALIGN=TOP WIDTH="13%">      ]]></body>
<body><![CDATA[<center>98,78</center>  </td>    <td VALIGN=TOP WIDTH="13%">      <center>131,31</center>  </td>    <td VALIGN=TOP WIDTH="13%">      <center>62,94</center>  </td>    <td VALIGN=TOP WIDTH="13%">      <center>171,80</center>  </td>  </tr>    <tr>  <td VALIGN=TOP WIDTH="13%">1994</td>    <td VALIGN=TOP WIDTH="13%">      <center>7,18</center>  </td>    <td VALIGN=TOP WIDTH="13%">      <center>85,71</center>  </td>    <td VALIGN=TOP WIDTH="13%">      <center>111,91</center>  </td>    <td VALIGN=TOP WIDTH="13%">      <center>98,81</center>  </td>    <td VALIGN=TOP WIDTH="13%">      <center>131,57</center>  </td>    <td VALIGN=TOP WIDTH="13%">      <center>62,97</center>  </td>    <td VALIGN=TOP WIDTH="13%">      ]]></body>
<body><![CDATA[<center>171,94</center>  </td>  </tr>    <tr>  <td VALIGN=TOP WIDTH="13%">1995</td>    <td VALIGN=TOP WIDTH="13%">      <center>7,10</center>  </td>    <td VALIGN=TOP WIDTH="13%">      <center>84,75</center>  </td>    <td VALIGN=TOP WIDTH="13%">      <center>110,77</center>  </td>    <td VALIGN=TOP WIDTH="13%">      <center>97,76</center>  </td>    <td VALIGN=TOP WIDTH="13%">      <center>129,98</center>  </td>    <td VALIGN=TOP WIDTH="13%">      <center>62,29</center>  </td>    <td VALIGN=TOP WIDTH="13%">      <center>170,06</center>  </td>  </tr>    <tr>  <td VALIGN=TOP WIDTH="13%">1996</td>    <td VALIGN=TOP WIDTH="13%">      <center>7,24</center>  </td>    <td VALIGN=TOP WIDTH="13%">      <center>83,86</center>  </td>    <td VALIGN=TOP WIDTH="13%">      ]]></body>
<body><![CDATA[<center>111,26</center>  </td>    <td VALIGN=TOP WIDTH="13%">      <center>97,56</center>  </td>    <td VALIGN=TOP WIDTH="13%">      <center>126,67</center>  </td>    <td VALIGN=TOP WIDTH="13%">      <center>62,14</center>  </td>    <td VALIGN=TOP WIDTH="13%">      <center>168,32</center>  </td>  </tr>    <tr>  <td VALIGN=TOP WIDTH="13%">1997</td>    <td VALIGN=TOP WIDTH="13%">      <center>7,01</center>  </td>    <td VALIGN=TOP WIDTH="13%">      <center>81,66</center>  </td>    <td VALIGN=TOP WIDTH="13%">      <center>108,11</center>  </td>    <td VALIGN=TOP WIDTH="13%">      <center>94,88</center>  </td>    <td VALIGN=TOP WIDTH="13%">      <center>123,41</center>  </td>    <td VALIGN=TOP WIDTH="13%">      ]]></body>
<body><![CDATA[<center>60,47</center>  </td>    <td VALIGN=TOP WIDTH="13%">      <center>163,79</center>  </td>  </tr>    <tr>  <td VALIGN=TOP COLSPAN="8">COMB1: K = 1; r = 0,03. COMB2: K = 0; r = 0,03.  COMB3: K = 0,05; r = 0,03.</td>  </tr>    <tr>  <td VALIGN=TOP COLSPAN="8">COMB4: K = 1; r = 0. COMB5: K = 1; r = 0,06.  COMB6: K = 0; r = 0.</td>  </tr>  </table></center>        <p>      <center>TABLA 1B. <i>Rangos de las tasas (x1 000) de mortalidad y de AVP, presentadas  en la tabla 1A</i></center>        <center><table CELLPADDING=5 >  <tr>  <td VALIGN=TOP WIDTH="13%">&nbsp;</td>    <td VALIGN=TOP WIDTH="13%">      <center>Rango</center>  </td>    <td VALIGN=TOP WIDTH="13%">&nbsp;</td>    <td VALIGN=TOP WIDTH="13%">&nbsp;</td>    <td VALIGN=TOP WIDTH="13%">&nbsp;</td>    <td VALIGN=TOP WIDTH="13%">&nbsp;</td>    <td VALIGN=TOP WIDTH="13%">&nbsp;</td>    <td VALIGN=TOP WIDTH="13%">&nbsp;</td>  </tr>    <tr>  <td VALIGN=TOP WIDTH="13%">&nbsp;</td>    <td VALIGN=TOP WIDTH="13%">      <center>Tasa de Mortalidad</center>  </td>    <td VALIGN=TOP COLSPAN="3" WIDTH="38%">      <center>Rangos de las tasas de AVP (&acute; 1 000)</center>  </td>    <td VALIGN=TOP WIDTH="13%">&nbsp;</td>    <td VALIGN=TOP WIDTH="13%">&nbsp;</td>    <td VALIGN=TOP WIDTH="13%">&nbsp;</td>  </tr>    <tr>  <td VALIGN=TOP WIDTH="13%" HEIGHT="45">A&ntilde;o&nbsp;</td>    <td VALIGN=TOP WIDTH="13%" HEIGHT="45">      <center>(&acute; 1 000)</center>  </td>    <td VALIGN=TOP WIDTH="13%" HEIGHT="45">      <center>COMB1</center>  </td>    <td VALIGN=TOP WIDTH="13%" HEIGHT="45">      ]]></body>
<body><![CDATA[<center>COMB2</center>  </td>    <td VALIGN=TOP WIDTH="13%" HEIGHT="45">      <center>COMB3</center>  </td>    <td VALIGN=TOP WIDTH="13%" HEIGHT="45">      <center>COMB4</center>  </td>    <td VALIGN=TOP WIDTH="13%" HEIGHT="45">      <center>COMB5</center>  </td>    <td VALIGN=TOP WIDTH="13%" HEIGHT="45">      <center>COMB6</center>  </td>  </tr>    <tr>  <td VALIGN=TOP WIDTH="13%">1970</td>    <td VALIGN=TOP WIDTH="13%">      <center>8</center>  </td>    <td VALIGN=TOP WIDTH="13%">      <center>20</center>  </td>    <td VALIGN=TOP WIDTH="13%">      <center>20</center>  </td>    <td VALIGN=TOP WIDTH="13%">      <center>20</center>  </td>    <td VALIGN=TOP WIDTH="13%">      <center>20</center>  </td>    <td VALIGN=TOP WIDTH="13%">      ]]></body>
<body><![CDATA[<center>20</center>  </td>    <td VALIGN=TOP WIDTH="13%">      <center>20</center>  </td>  </tr>    <tr>  <td VALIGN=TOP WIDTH="13%">1975</td>    <td VALIGN=TOP WIDTH="13%">      <center>1</center>  </td>    <td VALIGN=TOP WIDTH="13%">      <center>10</center>  </td>    <td VALIGN=TOP WIDTH="13%">      <center>3</center>  </td>    <td VALIGN=TOP WIDTH="13%">      <center>6</center>  </td>    <td VALIGN=TOP WIDTH="13%">      <center>19</center>  </td>    <td VALIGN=TOP WIDTH="13%">      <center>3</center>  </td>    <td VALIGN=TOP WIDTH="13%">      <center>16</center>  </td>  </tr>    <tr>  <td VALIGN=TOP WIDTH="13%">1980</td>    <td VALIGN=TOP WIDTH="13%">      <center>2</center>  </td>    <td VALIGN=TOP WIDTH="13%">      ]]></body>
<body><![CDATA[<center>2</center>  </td>    <td VALIGN=TOP WIDTH="13%">      <center>1</center>  </td>    <td VALIGN=TOP WIDTH="13%">      <center>1</center>  </td>    <td VALIGN=TOP WIDTH="13%">      <center>6</center>  </td>    <td VALIGN=TOP WIDTH="13%">      <center>1</center>  </td>    <td VALIGN=TOP WIDTH="13%">      <center>2</center>  </td>  </tr>    <tr>  <td VALIGN=TOP WIDTH="13%">1981</td>    <td VALIGN=TOP WIDTH="13%">      <center>5</center>  </td>    <td VALIGN=TOP WIDTH="13%">      <center>5</center>  </td>    <td VALIGN=TOP WIDTH="13%">      <center>5</center>  </td>    <td VALIGN=TOP WIDTH="13%">      <center>5</center>  </td>    <td VALIGN=TOP WIDTH="13%">      ]]></body>
<body><![CDATA[<center>11</center>  </td>    <td VALIGN=TOP WIDTH="13%">      <center>6</center>  </td>    <td VALIGN=TOP WIDTH="13%">      <center>5</center>  </td>  </tr>    <tr>  <td VALIGN=TOP WIDTH="13%">1982</td>    <td VALIGN=TOP WIDTH="13%">      <center>3</center>  </td>    <td VALIGN=TOP WIDTH="13%">      <center>1</center>  </td>    <td VALIGN=TOP WIDTH="13%">      <center>2</center>  </td>    <td VALIGN=TOP WIDTH="13%">      <center>2</center>  </td>    <td VALIGN=TOP WIDTH="13%">      <center>4</center>  </td>    <td VALIGN=TOP WIDTH="13%">      <center>2</center>  </td>    <td VALIGN=TOP WIDTH="13%">      <center>1</center>  </td>  </tr>    <tr>  <td VALIGN=TOP WIDTH="13%">1983</td>    <td VALIGN=TOP WIDTH="13%">      ]]></body>
<body><![CDATA[<center>4</center>  </td>    <td VALIGN=TOP WIDTH="13%">      <center>3</center>  </td>    <td VALIGN=TOP WIDTH="13%">      <center>4</center>  </td>    <td VALIGN=TOP WIDTH="13%">      <center>3</center>  </td>    <td VALIGN=TOP WIDTH="13%">      <center>3</center>  </td>    <td VALIGN=TOP WIDTH="13%">      <center>4</center>  </td>    <td VALIGN=TOP WIDTH="13%">      <center>3</center>  </td>  </tr>    <tr>  <td VALIGN=TOP WIDTH="13%">1984</td>    <td VALIGN=TOP WIDTH="13%">      <center>6</center>  </td>    <td VALIGN=TOP WIDTH="13%">      <center>4</center>  </td>    <td VALIGN=TOP WIDTH="13%">      <center>6</center>  </td>    <td VALIGN=TOP WIDTH="13%">      ]]></body>
<body><![CDATA[<center>4</center>  </td>    <td VALIGN=TOP WIDTH="13%">      <center>5</center>  </td>    <td VALIGN=TOP WIDTH="13%">      <center>5</center>  </td>    <td VALIGN=TOP WIDTH="13%">      <center>4</center>  </td>  </tr>    <tr>  <td VALIGN=TOP WIDTH="13%">1985</td>    <td VALIGN=TOP WIDTH="13%">      <center>10</center>  </td>    <td VALIGN=TOP WIDTH="13%">      <center>16</center>  </td>    <td VALIGN=TOP WIDTH="13%">      <center>10</center>  </td>    <td VALIGN=TOP WIDTH="13%">      <center>12</center>  </td>    <td VALIGN=TOP WIDTH="13%">      <center>18</center>  </td>    <td VALIGN=TOP WIDTH="13%">      <center>10</center>  </td>    <td VALIGN=TOP WIDTH="13%">      ]]></body>
<body><![CDATA[<center>17</center>  </td>  </tr>    <tr>  <td VALIGN=TOP WIDTH="13%">1986</td>    <td VALIGN=TOP WIDTH="13%">      <center>7</center>  </td>    <td VALIGN=TOP WIDTH="13%">      <center>6</center>  </td>    <td VALIGN=TOP WIDTH="13%">      <center>7</center>  </td>    <td VALIGN=TOP WIDTH="13%">      <center>7</center>  </td>    <td VALIGN=TOP WIDTH="13%">      <center>9</center>  </td>    <td VALIGN=TOP WIDTH="13%">      <center>7</center>  </td>    <td VALIGN=TOP WIDTH="13%">      <center>6</center>  </td>  </tr>    <tr>  <td VALIGN=TOP WIDTH="13%">1987</td>    <td VALIGN=TOP WIDTH="13%">      <center>9</center>  </td>    <td VALIGN=TOP WIDTH="13%">      <center>9</center>  </td>    <td VALIGN=TOP WIDTH="13%">      ]]></body>
<body><![CDATA[<center>8</center>  </td>    <td VALIGN=TOP WIDTH="13%">      <center>8</center>  </td>    <td VALIGN=TOP WIDTH="13%">      <center>15</center>  </td>    <td VALIGN=TOP WIDTH="13%">      <center>8</center>  </td>    <td VALIGN=TOP WIDTH="13%">      <center>9</center>  </td>  </tr>    <tr>  <td VALIGN=TOP WIDTH="13%">1988</td>    <td VALIGN=TOP WIDTH="13%">      <center>12</center>  </td>    <td VALIGN=TOP WIDTH="13%">      <center>12</center>  </td>    <td VALIGN=TOP WIDTH="13%">      <center>11</center>  </td>    <td VALIGN=TOP WIDTH="13%">      <center>10</center>  </td>    <td VALIGN=TOP WIDTH="13%">      <center>17</center>  </td>    <td VALIGN=TOP WIDTH="13%">      ]]></body>
<body><![CDATA[<center>11</center>  </td>    <td VALIGN=TOP WIDTH="13%">      <center>12</center>  </td>  </tr>    <tr>  <td VALIGN=TOP WIDTH="13%">1989</td>    <td VALIGN=TOP WIDTH="13%">      <center>11</center>  </td>    <td VALIGN=TOP WIDTH="13%">      <center>7</center>  </td>    <td VALIGN=TOP WIDTH="13%">      <center>9</center>  </td>    <td VALIGN=TOP WIDTH="13%">      <center>9</center>  </td>    <td VALIGN=TOP WIDTH="13%">      <center>7</center>  </td>    <td VALIGN=TOP WIDTH="13%">      <center>9</center>  </td>    <td VALIGN=TOP WIDTH="13%">      <center>7</center>  </td>  </tr>    <tr>  <td VALIGN=TOP WIDTH="13%">1990</td>    <td VALIGN=TOP WIDTH="13%">      <center>14</center>  </td>    <td VALIGN=TOP WIDTH="13%">      ]]></body>
<body><![CDATA[<center>15</center>  </td>    <td VALIGN=TOP WIDTH="13%">      <center>14</center>  </td>    <td VALIGN=TOP WIDTH="13%">      <center>14</center>  </td>    <td VALIGN=TOP WIDTH="13%">      <center>16</center>  </td>    <td VALIGN=TOP WIDTH="13%">      <center>14</center>  </td>    <td VALIGN=TOP WIDTH="13%">      <center>14</center>  </td>  </tr>    <tr>  <td VALIGN=TOP WIDTH="13%">1991</td>    <td VALIGN=TOP WIDTH="13%">      <center>13</center>  </td>    <td VALIGN=TOP WIDTH="13%">      <center>11</center>  </td>    <td VALIGN=TOP WIDTH="13%">      <center>12</center>  </td>    <td VALIGN=TOP WIDTH="13%">      <center>13</center>  </td>    <td VALIGN=TOP WIDTH="13%">      ]]></body>
<body><![CDATA[<center>12</center>  </td>    <td VALIGN=TOP WIDTH="13%">      <center>13</center>  </td>    <td VALIGN=TOP WIDTH="13%">      <center>10</center>  </td>  </tr>    <tr>  <td VALIGN=TOP WIDTH="13%">1992</td>    <td VALIGN=TOP WIDTH="13%">      <center>15</center>  </td>    <td VALIGN=TOP WIDTH="13%">      <center>14</center>  </td>    <td VALIGN=TOP WIDTH="13%">      <center>15</center>  </td>    <td VALIGN=TOP WIDTH="13%">      <center>15</center>  </td>    <td VALIGN=TOP WIDTH="13%">      <center>10</center>  </td>    <td VALIGN=TOP WIDTH="13%">      <center>15</center>  </td>    <td VALIGN=TOP WIDTH="13%">      <center>13</center>  </td>  </tr>    <tr>  <td VALIGN=TOP WIDTH="13%">1993</td>    <td VALIGN=TOP WIDTH="13%">      ]]></body>
<body><![CDATA[<center>19</center>  </td>    <td VALIGN=TOP WIDTH="13%">      <center>18</center>  </td>    <td VALIGN=TOP WIDTH="13%">      <center>19</center>  </td>    <td VALIGN=TOP WIDTH="13%">      <center>18</center>  </td>    <td VALIGN=TOP WIDTH="13%">      <center>13</center>  </td>    <td VALIGN=TOP WIDTH="13%">      <center>18</center>  </td>    <td VALIGN=TOP WIDTH="13%">      <center>18</center>  </td>  </tr>    <tr>  <td VALIGN=TOP WIDTH="13%">1994</td>    <td VALIGN=TOP WIDTH="13%">      <center>18</center>  </td>    <td VALIGN=TOP WIDTH="13%">      <center>19</center>  </td>    <td VALIGN=TOP WIDTH="13%">      <center>18</center>  </td>    <td VALIGN=TOP WIDTH="13%">      ]]></body>
<body><![CDATA[<center>19</center>  </td>    <td VALIGN=TOP WIDTH="13%">      <center>14</center>  </td>    <td VALIGN=TOP WIDTH="13%">      <center>19</center>  </td>    <td VALIGN=TOP WIDTH="13%">      <center>19</center>  </td>  </tr>    <tr>  <td VALIGN=TOP WIDTH="13%">1995</td>    <td VALIGN=TOP WIDTH="13%">      <center>17</center>  </td>    <td VALIGN=TOP WIDTH="13%">      <center>17</center>  </td>    <td VALIGN=TOP WIDTH="13%">      <center>16</center>  </td>    <td VALIGN=TOP WIDTH="13%">      <center>17</center>  </td>    <td VALIGN=TOP WIDTH="13%">      <center>8</center>  </td>    <td VALIGN=TOP WIDTH="13%">      <center>17</center>  </td>    <td VALIGN=TOP WIDTH="13%">      ]]></body>
<body><![CDATA[<center>15</center>  </td>  </tr>    <tr>  <td VALIGN=TOP WIDTH="13%">1996</td>    <td VALIGN=TOP WIDTH="13%">      <center>20</center>  </td>    <td VALIGN=TOP WIDTH="13%">      <center>13</center>  </td>    <td VALIGN=TOP WIDTH="13%">      <center>17</center>  </td>    <td VALIGN=TOP WIDTH="13%">      <center>16</center>  </td>    <td VALIGN=TOP WIDTH="13%">      <center>2</center>  </td>    <td VALIGN=TOP WIDTH="13%">      <center>16</center>  </td>    <td VALIGN=TOP WIDTH="13%">      <center>11</center>  </td>  </tr>    <tr>  <td VALIGN=TOP WIDTH="13%">1997</td>    <td VALIGN=TOP WIDTH="13%">      <center>16</center>  </td>    <td VALIGN=TOP WIDTH="13%">      <center>8</center>  </td>    <td VALIGN=TOP WIDTH="13%">      ]]></body>
<body><![CDATA[<center>13</center>  </td>    <td VALIGN=TOP WIDTH="13%">      <center>11</center>  </td>    <td VALIGN=TOP WIDTH="13%">      <center>1</center>  </td>    <td VALIGN=TOP WIDTH="13%">      <center>12</center>  </td>    <td VALIGN=TOP WIDTH="13%">      <center>8</center>  </td>  </tr>  </table></center>        <p>COMB1: K = 1; r = 0,03. COMB2: K = 0; r = 0,03. COMB3: K = 0,5; r =  0,03.      <p>COMB4: K = 1; r = 0. COMB5: K = 1; r = 0,06. COMB6: K = 0; r = 0.      <br>&nbsp;      <p>Las tablas 1A y 1B muestran que el cuadro reflejado por las tasas de  mortalidad es muy diferente del reflejado por las tasas de AVP para COMB1  (combinaci&oacute;n de par&aacute;metros empleada en GBD). Esto se manifiesta  particularmente en los a&ntilde;os 1970, 1975, 1996 y 1997.      <p>En 1970 se produjo la peor situaci&oacute;n del per&iacute;odo estudiado  con relaci&oacute;n a las tasas de AVP, mientras que seg&uacute;n la tasa  de mortalidad 1970 es el octavo mejor a&ntilde;o de los 20 a&ntilde;os  considerados. La explicaci&oacute;n se debe buscar en que aunque la tasa  de mortalidad en 1970 fue de las mejores en el per&iacute;odo, esta mortalidad  se produjo en edades relativamente tempranas lo que motiva los m&aacute;s  altos valores (para todas las combinaciones de los par&aacute;metros) de  las tasas de AVP. En 1975 se observa una situaci&oacute;n similar a la  de 1970, aunque no tan marcada; seg&uacute;n la tasa de mortalidad 1975  es el mejor a&ntilde;o del per&iacute;odo, pero seg&uacute;n la tasa de  AVP (COMB1) 1975 est&aacute; s&oacute;lo en el d&eacute;cimo lugar.      ]]></body>
<body><![CDATA[<p>En 1996 y 1997 la situaci&oacute;n es a la inversa. En 1997 la tasa  de AVP (COMB1) es de las mejores (la octava mejor), mientras que seg&uacute;n  la tasa de mortalidad 1997 es uno de los peores a&ntilde;os (lugar 16);  ello se explica por un relativo aumento de la mortalidad en 1997 con respecto  a los restantes a&ntilde;os considerados, que sin embargo se concentra  en las edades mayores, raz&oacute;n por la cual la tasa de AVP es relativamente  baja. En 1996 la situaci&oacute;n es similar.      <p>La comparaci&oacute;n de los rangos en las columnas que corresponden  a las combinaciones COMB2-COMB6 con los rangos en la columna de COMB1 permiten  evaluar la sensibilidad de las tasas de AVP a diferentes supuestos con  respecto a la ponderaci&oacute;n por edad (reflejado por los distintos  valores de K) y con respecto al descuento en el tiempo (reflejado por los  distintos valores de r). Para los datos de la Tabla 1A, las tasas de AVP  muestran mayor sensibilidad a variaciones en la tasa de descuento que a  variaciones en la ponderaci&oacute;n por edad; obs&eacute;rvese que de  conjunto los rangos en las columnas (COMB4 y COMB5 difieren m&aacute;s  de los rangos en la COMB1, que lo que difieren los rangos de las COMB2  y COMB3 de los rangos en la COMB1. Se destaca en especial el efecto de  no descontar en el tiempo y s&iacute; mantener la ponderaci&oacute;n por  edad (con b = 0,04 donde las edades entre 20 y 25 a&ntilde;os reciben el  mayor peso) que corresponde a la COMB4; la diferencia entre los rangos  de esta columna y la COMB1 que coincide con la opci&oacute;n elegida por  la OMS es la mayor de entre todas las 6 combinaciones de par&aacute;metros  consideradas.      <p>Resulta interesante observar que para los datos en la tabla 1A, los  efectos de no descontar en el tiempo (r = 0; COMB4) y dar peso uniforme  a las edades (K = 0; COMB2) tienden a anularse mutuamente; el efecto combinado  de estos dos supuestos, representado en la COMB6, difiere menos de la COMB1  que las combinaciones COMB2 y COMB4 por separado.      <p>La tabla 2A muestra los resultados de las tasas (x 1 000) de mortalidad  y AVP por provincias, en 1997; la tabla 2B muestra los correspondientes  rangos. Se observa una similitud muy grande entre los rangos de las tasas  de mortalidad y los rangos seg&uacute;n las tasas de AVP usando los par&aacute;metros  de la OMS (COMB1), lo cual indica que la estructura por edades de la mortalidad  fue muy similar entre las 15 provincias en 1997.      <br>&nbsp;      <br>&nbsp;      <br>      <p>      <center>TABLA 2A. <i>Tasas (X 1 000) de mortalidad y de AVP, para 6 combinaciones  de los par&aacute;metros "K" y "r", para las 15 provincias de Cuba</i></center>        <center><table CELLPADDING=5 >  <tr>  <td VALIGN=TOP WIDTH="13%">&nbsp;</td>    <td VALIGN=TOP WIDTH="13%">      ]]></body>
<body><![CDATA[<center>Tasa</center>  </td>    <td VALIGN=TOP WIDTH="13%">&nbsp;</td>    <td VALIGN=TOP WIDTH="13%">&nbsp;</td>    <td VALIGN=TOP WIDTH="13%">&nbsp;</td>    <td VALIGN=TOP WIDTH="13%">&nbsp;</td>    <td VALIGN=TOP WIDTH="13%">&nbsp;</td>    <td VALIGN=TOP WIDTH="13%">&nbsp;</td>  </tr>    <tr>  <td VALIGN=TOP WIDTH="13%">&nbsp;</td>    <td VALIGN=TOP WIDTH="13%">      <center>de Mortalidad</center>  </td>    <td VALIGN=TOP COLSPAN="3" WIDTH="38%">      <center>Tasas de AVP (X 1 000)</center>  </td>    <td VALIGN=TOP WIDTH="13%">&nbsp;</td>    <td VALIGN=TOP WIDTH="13%">&nbsp;</td>    <td VALIGN=TOP WIDTH="13%">&nbsp;</td>  </tr>    <tr>  <td VALIGN=TOP WIDTH="13%">Provincias&nbsp;</td>    <td VALIGN=TOP WIDTH="13%">      <center>(X 1 000)</center>  </td>    <td VALIGN=TOP WIDTH="13%">      <center>COMB1</center>  </td>    <td VALIGN=TOP WIDTH="13%">      <center>COMB2</center>  </td>    <td VALIGN=TOP WIDTH="13%">      <center>COMB3</center>  </td>    <td VALIGN=TOP WIDTH="13%">      <center>COMB4</center>  </td>    <td VALIGN=TOP WIDTH="13%">      <center>COMB5</center>  </td>    <td VALIGN=TOP WIDTH="13%">      <center>COMB6</center>  </td>  </tr>    <tr>  <td VALIGN=TOP WIDTH="13%">Pinar del R&iacute;o</td>    <td VALIGN=TOP WIDTH="13%">      ]]></body>
<body><![CDATA[<center>6,22</center>  </td>    <td VALIGN=TOP WIDTH="13%">      <center>72,60</center>  </td>    <td VALIGN=TOP WIDTH="13%">      <center>96,19</center>  </td>    <td VALIGN=TOP WIDTH="13%">      <center>84,39</center>  </td>    <td VALIGN=TOP WIDTH="13%">      <center>64,70</center>  </td>    <td VALIGN=TOP WIDTH="13%">      <center>53,76</center>  </td>    <td VALIGN=TOP WIDTH="13%">      <center>145,71</center>  </td>  </tr>    <tr>  <td VALIGN=TOP WIDTH="13%">Prov. Habana</td>    <td VALIGN=TOP WIDTH="13%">      <center>7,95</center>  </td>    <td VALIGN=TOP WIDTH="13%">      <center>88,45</center>  </td>    <td VALIGN=TOP WIDTH="13%">      <center>119,89</center>  </td>    <td VALIGN=TOP WIDTH="13%">      ]]></body>
<body><![CDATA[<center>104,17</center>  </td>    <td VALIGN=TOP WIDTH="13%">      <center>66,27</center>  </td>    <td VALIGN=TOP WIDTH="13%">      <center>66,22</center>  </td>    <td VALIGN=TOP WIDTH="13%">      <center>177,99</center>  </td>  </tr>    <tr>  <td VALIGN=TOP WIDTH="13%">C. Habana</td>    <td VALIGN=TOP WIDTH="13%">      <center>8,88</center>  </td>    <td VALIGN=TOP WIDTH="13%">      <center>98,42</center>  </td>    <td VALIGN=TOP WIDTH="13%">      <center>134,03</center>  </td>    <td VALIGN=TOP WIDTH="13%">      <center>116,22</center>  </td>    <td VALIGN=TOP WIDTH="13%">      <center>66,28</center>  </td>    <td VALIGN=TOP WIDTH="13%">      <center>73,87</center>  </td>    <td VALIGN=TOP WIDTH="13%">      ]]></body>
<body><![CDATA[<center>198,08</center>  </td>  </tr>    <tr>  <td VALIGN=TOP WIDTH="13%">Matanzas</td>    <td VALIGN=TOP WIDTH="13%">      <center>8,11</center>  </td>    <td VALIGN=TOP WIDTH="13%">      <center>90,70</center>  </td>    <td VALIGN=TOP WIDTH="13%">      <center>122,61</center>  </td>    <td VALIGN=TOP WIDTH="13%">      <center>106,66</center>  </td>    <td VALIGN=TOP WIDTH="13%">      <center>66,11</center>  </td>    <td VALIGN=TOP WIDTH="13%">      <center>67,83</center>  </td>    <td VALIGN=TOP WIDTH="13%">      <center>182,40</center>  </td>  </tr>    <tr>  <td VALIGN=TOP WIDTH="13%">Villa Clara</td>    <td VALIGN=TOP WIDTH="13%">      <center>7,69</center>  </td>    <td VALIGN=TOP WIDTH="13%">      <center>83,23</center>  </td>    <td VALIGN=TOP WIDTH="13%">      ]]></body>
<body><![CDATA[<center>113,96</center>  </td>    <td VALIGN=TOP WIDTH="13%">      <center>98,59</center>  </td>    <td VALIGN=TOP WIDTH="13%">      <center>67,47</center>  </td>    <td VALIGN=TOP WIDTH="13%">      <center>62,63</center>  </td>    <td VALIGN=TOP WIDTH="13%">      <center>167,62</center>  </td>  </tr>    <tr>  <td VALIGN=TOP WIDTH="13%">Cienfuegos</td>    <td VALIGN=TOP WIDTH="13%">      <center>7,03</center>  </td>    <td VALIGN=TOP WIDTH="13%">      <center>79,04</center>  </td>    <td VALIGN=TOP WIDTH="13%">      <center>106,54</center>  </td>    <td VALIGN=TOP WIDTH="13%">      <center>92,79</center>  </td>    <td VALIGN=TOP WIDTH="13%">      <center>66,03</center>  </td>    <td VALIGN=TOP WIDTH="13%">      ]]></body>
<body><![CDATA[<center>58,91</center>  </td>    <td VALIGN=TOP WIDTH="13%">      <center>159,37</center>  </td>  </tr>    <tr>  <td VALIGN=TOP WIDTH="13%">S. Sp&iacute;ritus</td>    <td VALIGN=TOP WIDTH="13%">      <center>7,71</center>  </td>    <td VALIGN=TOP WIDTH="13%">      <center>84,55</center>  </td>    <td VALIGN=TOP WIDTH="13%">      <center>115,05</center>  </td>    <td VALIGN=TOP WIDTH="13%">      <center>99,80</center>  </td>    <td VALIGN=TOP WIDTH="13%">      <center>67,01</center>  </td>    <td VALIGN=TOP WIDTH="13%">      <center>63,48</center>  </td>    <td VALIGN=TOP WIDTH="13%">      <center>169,98</center>  </td>  </tr>    <tr>  <td VALIGN=TOP WIDTH="13%">Ciego de &Aacute;vila</td>    <td VALIGN=TOP WIDTH="13%">      <center>6,83</center>  </td>    <td VALIGN=TOP WIDTH="13%">      ]]></body>
<body><![CDATA[<center>78,38</center>  </td>    <td VALIGN=TOP WIDTH="13%">      <center>104,35</center>  </td>    <td VALIGN=TOP WIDTH="13%">      <center>91,36</center>  </td>    <td VALIGN=TOP WIDTH="13%">      <center>65,47</center>  </td>    <td VALIGN=TOP WIDTH="13%">      <center>58,19</center>  </td>    <td VALIGN=TOP WIDTH="13%">      <center>157,34</center>  </td>  </tr>    <tr>  <td VALIGN=TOP WIDTH="13%">Camag&uuml;ey</td>    <td VALIGN=TOP WIDTH="13%">      <center>6,61</center>  </td>    <td VALIGN=TOP WIDTH="13%">      <center>78,37</center>  </td>    <td VALIGN=TOP WIDTH="13%">      <center>102,73</center>  </td>    <td VALIGN=TOP WIDTH="13%">      <center>90,55</center>  </td>    <td VALIGN=TOP WIDTH="13%">      ]]></body>
<body><![CDATA[<center>64,30</center>  </td>    <td VALIGN=TOP WIDTH="13%">      <center>57,92</center>  </td>    <td VALIGN=TOP WIDTH="13%">      <center>157,14</center>  </td>  </tr>    <tr>  <td VALIGN=TOP WIDTH="13%">Las Tunas</td>    <td VALIGN=TOP WIDTH="13%">      <center>5,38</center>  </td>    <td VALIGN=TOP WIDTH="13%">      <center>70,55</center>  </td>    <td VALIGN=TOP WIDTH="13%">      <center>87,97</center>  </td>    <td VALIGN=TOP WIDTH="13%">      <center>79,26</center>  </td>    <td VALIGN=TOP WIDTH="13%">      <center>61,18</center>  </td>    <td VALIGN=TOP WIDTH="13%">      <center>50,69</center>  </td>    <td VALIGN=TOP WIDTH="13%">      <center>140,94</center>  </td>  </tr>    <tr>  <td VALIGN=TOP WIDTH="13%">Holgu&iacute;n</td>    <td VALIGN=TOP WIDTH="13%">      ]]></body>
<body><![CDATA[<center>6,01</center>  </td>    <td VALIGN=TOP WIDTH="13%">      <center>75,02</center>  </td>    <td VALIGN=TOP WIDTH="13%">      <center>96,00</center>  </td>    <td VALIGN=TOP WIDTH="13%">      <center>85,51</center>  </td>    <td VALIGN=TOP WIDTH="13%">      <center>62,65</center>  </td>    <td VALIGN=TOP WIDTH="13%">      <center>54,75</center>  </td>    <td VALIGN=TOP WIDTH="13%">      <center>149,55</center>  </td>  </tr>    <tr>  <td VALIGN=TOP WIDTH="13%">Granma</td>    <td VALIGN=TOP WIDTH="13%">      <center>5,65</center>  </td>    <td VALIGN=TOP WIDTH="13%">      <center>72,52</center>  </td>    <td VALIGN=TOP WIDTH="13%">      <center>91,78</center>  </td>    <td VALIGN=TOP WIDTH="13%">      ]]></body>
<body><![CDATA[<center>82,15</center>  </td>    <td VALIGN=TOP WIDTH="13%">      <center>61,55</center>  </td>    <td VALIGN=TOP WIDTH="13%">      <center>52,57</center>  </td>    <td VALIGN=TOP WIDTH="13%">      <center>144,70</center>  </td>  </tr>    <tr>  <td VALIGN=TOP WIDTH="13%">Stgo. de Cuba</td>    <td VALIGN=TOP WIDTH="13%">      <center>5,71</center>  </td>    <td VALIGN=TOP WIDTH="13%">      <center>71,45</center>  </td>    <td VALIGN=TOP WIDTH="13%">      <center>91,22</center>  </td>    <td VALIGN=TOP WIDTH="13%">      <center>81,33</center>  </td>    <td VALIGN=TOP WIDTH="13%">      <center>62,57</center>  </td>    <td VALIGN=TOP WIDTH="13%">      <center>52,13</center>  </td>    <td VALIGN=TOP WIDTH="13%">      ]]></body>
<body><![CDATA[<center>142,22</center>  </td>  </tr>    <tr>  <td VALIGN=TOP WIDTH="13%">Guant&aacute;namo</td>    <td VALIGN=TOP WIDTH="13%">      <center>5,30</center>  </td>    <td VALIGN=TOP WIDTH="13%">      <center>69,10</center>  </td>    <td VALIGN=TOP WIDTH="13%">      <center>86,71</center>  </td>    <td VALIGN=TOP WIDTH="13%">      <center>77,90</center>  </td>    <td VALIGN=TOP WIDTH="13%">      <center>61,18</center>  </td>    <td VALIGN=TOP WIDTH="13%">      <center>49,78</center>  </td>    <td VALIGN=TOP WIDTH="13%">      <center>138,20</center>  </td>  </tr>    <tr>  <td VALIGN=TOP WIDTH="13%">I. de la Juventud</td>    <td VALIGN=TOP WIDTH="13%">      <center>4,60</center>  </td>    <td VALIGN=TOP WIDTH="13%">      <center>69,30</center>  </td>    <td VALIGN=TOP WIDTH="13%">      ]]></body>
<body><![CDATA[<center>82,45</center>  </td>    <td VALIGN=TOP WIDTH="13%">      <center>75,88</center>  </td>    <td VALIGN=TOP WIDTH="13%">      <center>55,76</center>  </td>    <td VALIGN=TOP WIDTH="13%">      <center>48,75</center>  </td>    <td VALIGN=TOP WIDTH="13%">      <center>137,73</center>  </td>  </tr>  </table></center>        <p>COMB1: K = 1; r = 0,03. COMB2: K = 0; r = 0,03. COMB3: K = 0,5; r =  0,03.      <p>COMB4: K = 1. r = 0; COMB5: K = 1; r = 0,06. COMB6: K = 0; r = 0.      <br>&nbsp;      <br>&nbsp;      <br>      ]]></body>
<body><![CDATA[<p>      <center>TABLA 2B. <i>Rangos de las tasas (X 1 000) de mortalidad y de AVP, presentadas  en la tabla 2A</i></center>        <center><table CELLPADDING=5 >  <tr>  <td VALIGN=TOP WIDTH="13%">&nbsp;</td>    <td VALIGN=TOP WIDTH="13%">      <center>Rango</center>  </td>    <td VALIGN=TOP WIDTH="13%">&nbsp;</td>    <td VALIGN=TOP WIDTH="13%">&nbsp;</td>    <td VALIGN=TOP WIDTH="13%">&nbsp;</td>    <td VALIGN=TOP WIDTH="13%">&nbsp;</td>    <td VALIGN=TOP WIDTH="13%">&nbsp;</td>    <td VALIGN=TOP WIDTH="13%">&nbsp;</td>  </tr>    <tr>  <td VALIGN=TOP WIDTH="13%">&nbsp;</td>    <td VALIGN=TOP WIDTH="13%">      <center>Tasa Mortalidad</center>  </td>    <td VALIGN=TOP COLSPAN="6" WIDTH="75%">      <center>Rangos de las tasas de AVP (&acute; 1 000)</center>  </td>  </tr>    <tr>  <td VALIGN=TOP WIDTH="13%">Provincia&nbsp;</td>    <td VALIGN=TOP WIDTH="13%">      <center>(X 1000)</center>  </td>    <td VALIGN=TOP WIDTH="13%">      <center>COMB1</center>  </td>    <td VALIGN=TOP WIDTH="13%">      <center>COMB2</center>  </td>    <td VALIGN=TOP WIDTH="13%">      <center>COMB3</center>  </td>    <td VALIGN=TOP WIDTH="13%">      ]]></body>
<body><![CDATA[<center>COMB4</center>  </td>    <td VALIGN=TOP WIDTH="13%">      <center>COMB5</center>  </td>    <td VALIGN=TOP WIDTH="13%">      <center>COMB6</center>  </td>  </tr>    <tr>  <td VALIGN=TOP WIDTH="13%">Pinar del R&iacute;o</td>    <td VALIGN=TOP WIDTH="13%">      <center>7</center>  </td>    <td VALIGN=TOP WIDTH="13%">      <center>6</center>  </td>    <td VALIGN=TOP WIDTH="13%">      <center>7</center>  </td>    <td VALIGN=TOP WIDTH="13%">      <center>6</center>  </td>    <td VALIGN=TOP WIDTH="13%">      <center>1</center>  </td>    <td VALIGN=TOP WIDTH="13%">      <center>6</center>  </td>    <td VALIGN=TOP WIDTH="13%">      <center>6</center>  </td>  </tr>    <tr>  <td VALIGN=TOP WIDTH="13%">Prov. Habana</td>    <td VALIGN=TOP WIDTH="13%">      ]]></body>
<body><![CDATA[<center>13</center>  </td>    <td VALIGN=TOP WIDTH="13%">      <center>13</center>  </td>    <td VALIGN=TOP WIDTH="13%">      <center>13</center>  </td>    <td VALIGN=TOP WIDTH="13%">      <center>13</center>  </td>    <td VALIGN=TOP WIDTH="13%">      <center>13</center>  </td>    <td VALIGN=TOP WIDTH="13%">      <center>13</center>  </td>    <td VALIGN=TOP WIDTH="13%">      <center>13</center>  </td>  </tr>    <tr>  <td VALIGN=TOP WIDTH="13%">C. Habana</td>    <td VALIGN=TOP WIDTH="13%">      <center>15</center>  </td>    <td VALIGN=TOP WIDTH="13%">      <center>15</center>  </td>    <td VALIGN=TOP WIDTH="13%">      <center>15</center>  </td>    <td VALIGN=TOP WIDTH="13%">      ]]></body>
<body><![CDATA[<center>15</center>  </td>    <td VALIGN=TOP WIDTH="13%">      <center>15</center>  </td>    <td VALIGN=TOP WIDTH="13%">      <center>15</center>  </td>    <td VALIGN=TOP WIDTH="13%">      <center>15</center>  </td>  </tr>    <tr>  <td VALIGN=TOP WIDTH="13%">Matanzas</td>    <td VALIGN=TOP WIDTH="13%">      <center>14</center>  </td>    <td VALIGN=TOP WIDTH="13%">      <center>14</center>  </td>    <td VALIGN=TOP WIDTH="13%">      <center>14</center>  </td>    <td VALIGN=TOP WIDTH="13%">      <center>14</center>  </td>    <td VALIGN=TOP WIDTH="13%">      <center>14</center>  </td>    <td VALIGN=TOP WIDTH="13%">      <center>14</center>  </td>    <td VALIGN=TOP WIDTH="13%">      ]]></body>
<body><![CDATA[<center>14</center>  </td>  </tr>    <tr>  <td VALIGN=TOP WIDTH="13%">Villa Clara</td>    <td VALIGN=TOP WIDTH="13%">      <center>11</center>  </td>    <td VALIGN=TOP WIDTH="13%">      <center>11</center>  </td>    <td VALIGN=TOP WIDTH="13%">      <center>11</center>  </td>    <td VALIGN=TOP WIDTH="13%">      <center>11</center>  </td>    <td VALIGN=TOP WIDTH="13%">      <center>11</center>  </td>    <td VALIGN=TOP WIDTH="13%">      <center>11</center>  </td>    <td VALIGN=TOP WIDTH="13%">      <center>11</center>  </td>  </tr>    <tr>  <td VALIGN=TOP WIDTH="13%">Cienfuegos</td>    <td VALIGN=TOP WIDTH="13%">      <center>10</center>  </td>    <td VALIGN=TOP WIDTH="13%">      <center>10</center>  </td>    <td VALIGN=TOP WIDTH="13%">      ]]></body>
<body><![CDATA[<center>10</center>  </td>    <td VALIGN=TOP WIDTH="13%">      <center>10</center>  </td>    <td VALIGN=TOP WIDTH="13%">      <center>9</center>  </td>    <td VALIGN=TOP WIDTH="13%">      <center>10</center>  </td>    <td VALIGN=TOP WIDTH="13%">      <center>10</center>  </td>  </tr>    <tr>  <td VALIGN=TOP WIDTH="13%">S. Sp&iacute;ritus</td>    <td VALIGN=TOP WIDTH="13%">      <center>12</center>  </td>    <td VALIGN=TOP WIDTH="13%">      <center>12</center>  </td>    <td VALIGN=TOP WIDTH="13%">      <center>12</center>  </td>    <td VALIGN=TOP WIDTH="13%">      <center>12</center>  </td>    <td VALIGN=TOP WIDTH="13%">      <center>12</center>  </td>    <td VALIGN=TOP WIDTH="13%">      ]]></body>
<body><![CDATA[<center>12</center>  </td>    <td VALIGN=TOP WIDTH="13%">      <center>12</center>  </td>  </tr>    <tr>  <td VALIGN=TOP WIDTH="13%">Ciego de &Aacute;vila</td>    <td VALIGN=TOP WIDTH="13%">      <center>9</center>  </td>    <td VALIGN=TOP WIDTH="13%">      <center>9</center>  </td>    <td VALIGN=TOP WIDTH="13%">      <center>9</center>  </td>    <td VALIGN=TOP WIDTH="13%">      <center>9</center>  </td>    <td VALIGN=TOP WIDTH="13%">      <center>9</center>  </td>    <td VALIGN=TOP WIDTH="13%">      <center>9</center>  </td>    <td VALIGN=TOP WIDTH="13%">      <center>9</center>  </td>  </tr>    <tr>  <td VALIGN=TOP WIDTH="13%">Camag&uuml;ey</td>    <td VALIGN=TOP WIDTH="13%">      <center>8</center>  </td>    <td VALIGN=TOP WIDTH="13%">      ]]></body>
<body><![CDATA[<center>8</center>  </td>    <td VALIGN=TOP WIDTH="13%">      <center>8</center>  </td>    <td VALIGN=TOP WIDTH="13%">      <center>8</center>  </td>    <td VALIGN=TOP WIDTH="13%">      <center>10</center>  </td>    <td VALIGN=TOP WIDTH="13%">      <center>8</center>  </td>    <td VALIGN=TOP WIDTH="13%">      <center>8</center>  </td>  </tr>    <tr>  <td VALIGN=TOP WIDTH="13%">Las Tunas</td>    <td VALIGN=TOP WIDTH="13%">      <center>3</center>  </td>    <td VALIGN=TOP WIDTH="13%">      <center>3</center>  </td>    <td VALIGN=TOP WIDTH="13%">      <center>3</center>  </td>    <td VALIGN=TOP WIDTH="13%">      <center>3</center>  </td>    <td VALIGN=TOP WIDTH="13%">      ]]></body>
<body><![CDATA[<center>4</center>  </td>    <td VALIGN=TOP WIDTH="13%">      <center>3</center>  </td>    <td VALIGN=TOP WIDTH="13%">      <center>3</center>  </td>  </tr>    <tr>  <td VALIGN=TOP WIDTH="13%">Holgu&iacute;n</td>    <td VALIGN=TOP WIDTH="13%">      <center>6</center>  </td>    <td VALIGN=TOP WIDTH="13%">      <center>7</center>  </td>    <td VALIGN=TOP WIDTH="13%">      <center>6</center>  </td>    <td VALIGN=TOP WIDTH="13%">      <center>7</center>  </td>    <td VALIGN=TOP WIDTH="13%">      <center>7</center>  </td>    <td VALIGN=TOP WIDTH="13%">      <center>7</center>  </td>    <td VALIGN=TOP WIDTH="13%">      <center>7</center>  </td>  </tr>    <tr>  <td VALIGN=TOP WIDTH="13%">Granma</td>    <td VALIGN=TOP WIDTH="13%">      ]]></body>
<body><![CDATA[<center>4</center>  </td>    <td VALIGN=TOP WIDTH="13%">      <center>5</center>  </td>    <td VALIGN=TOP WIDTH="13%">      <center>5</center>  </td>    <td VALIGN=TOP WIDTH="13%">      <center>5</center>  </td>    <td VALIGN=TOP WIDTH="13%">      <center>5</center>  </td>    <td VALIGN=TOP WIDTH="13%">      <center>5</center>  </td>    <td VALIGN=TOP WIDTH="13%">      <center>5</center>  </td>  </tr>    <tr>  <td VALIGN=TOP WIDTH="13%">Stgo. de Cuba</td>    <td VALIGN=TOP WIDTH="13%">      <center>5</center>  </td>    <td VALIGN=TOP WIDTH="13%">      <center>4</center>  </td>    <td VALIGN=TOP WIDTH="13%">      <center>4</center>  </td>    <td VALIGN=TOP WIDTH="13%">      ]]></body>
<body><![CDATA[<center>4</center>  </td>    <td VALIGN=TOP WIDTH="13%">      <center>3</center>  </td>    <td VALIGN=TOP WIDTH="13%">      <center>4</center>  </td>    <td VALIGN=TOP WIDTH="13%">      <center>4</center>  </td>  </tr>    <tr>  <td VALIGN=TOP WIDTH="13%">Guant&aacute;namo</td>    <td VALIGN=TOP WIDTH="13%">      <center>2</center>  </td>    <td VALIGN=TOP WIDTH="13%">      <center>1</center>  </td>    <td VALIGN=TOP WIDTH="13%">      <center>2</center>  </td>    <td VALIGN=TOP WIDTH="13%">      <center>2</center>  </td>    <td VALIGN=TOP WIDTH="13%">      <center>2</center>  </td>    <td VALIGN=TOP WIDTH="13%">      <center>2</center>  </td>    <td VALIGN=TOP WIDTH="13%">      ]]></body>
<body><![CDATA[<center>2</center>  </td>  </tr>    <tr>  <td VALIGN=TOP WIDTH="13%">I. de la Juventud</td>    <td VALIGN=TOP WIDTH="13%">      <center>1</center>  </td>    <td VALIGN=TOP WIDTH="13%">      <center>2</center>  </td>    <td VALIGN=TOP WIDTH="13%">      <center>1</center>  </td>    <td VALIGN=TOP WIDTH="13%">      <center>1</center>  </td>    <td VALIGN=TOP WIDTH="13%">      <center>6</center>  </td>    <td VALIGN=TOP WIDTH="13%">      <center>1</center>  </td>    <td VALIGN=TOP WIDTH="13%">      <center>1</center>  </td>  </tr>  </table></center>        <p>COMB1: K = 1; r = 0,03. COMB2: K = 0; r = 0,03. COMB3: K = 0,5; r =  0,03.      <p>COMB4: K = 1; r = 0. COMB5: K = 1; r = 0,06; COMB6: K = 0; r = 0.      ]]></body>
<body><![CDATA[<br>&nbsp;      <p>La comparaci&oacute;n de los rangos en las columnas COMB2-COMB6 con  respecto a los rangos en la columna COMB1 indica que, en general, estos  datos de mortalidad por provincia son poco sensibles a variaciones en los  supuestos representados por los par&aacute;metros K y r. El mayor efecto  parece tenerlo, al igual que en la tabla 1B con los datos por a&ntilde;os,  el no descontar en el tiempo (r = 0) y ponderar por edad (b = 0,04, es  decir, m&aacute;s importancia a edades entre 20 y 25 a&ntilde;os), que  corresponde a la columna COMB4. Para esta combinaci&oacute;n de par&aacute;metros  se producen diferencias importantes con respecto a la combinaci&oacute;n  empleada por la OMS (COMB1) en las provincias Pinar del R&iacute;o y en  la Isla de la Juventud; obs&eacute;rvese que Pinar del R&iacute;o pasa  del lugar 6 (en la COMB1) al primer lugar (en la COMB4), mientras que la  Isla de la Juventud baja del segundo lugar (en la COMB1) al sexto lugar  (en la COMB4).      <p>Los AVAD se obtienen calculando y sumando dos indicadores: los A&ntilde;os  de Vida (Potencial) Perdidos (AVP), y los A&ntilde;os Vividos con Discapacidades  (AVP). Mediante un programa elaborado por los dos primeros autores de este  trabajo, es posible calcular el primer indicador, los AVP. Hemos aplicado  este programa a datos de mortalidad global desde 1970 hasta 1997, y a datos  de mortalidad global por provincia en 1997, lo cual representa una ampliaci&oacute;n  a la ya extensa gama de aplicaciones de los AVP.      <p>El programa que hemos elaborado es factible de ser mejorado, pero en  su versi&oacute;n actual permite la aplicaci&oacute;n de estas tecnolog&iacute;as  a un amplio espectro de situaciones, con un m&iacute;nimo de esfuerzo rutinario  por parte del investigador. Una versi&oacute;n que incluye el c&aacute;lculo  de los AVD est&aacute; en proceso de terminaci&oacute;n; desgraciadamente  no hay muchos datos sobre discapacidades en la poblaci&oacute;n cubana  esperando ser procesados por la versi&oacute;n en la que estamos trabajando.      <p>La aplicaci&oacute;n de estas tecnolog&iacute;as a dos de las tablas  que aparecen en el Anuario estad&iacute;stico del MINSAP, editado por la  Direcci&oacute;n nacional de estad&iacute;sticas del MINSAP,<sup>4 </sup>nos  permite arribar a las conclusiones siguientes: que resulta imprescindible,  para el c&aacute;lculo de los AVP, presentar los resultados de mortalidad  por grupos de edades no demasiado amplios. Adem&aacute;s los resultados  de mortalidad por grupos de edades deben utilizar, en todos los casos,  los mismos grupos; de lo contrario las comparaciones pueden hacerse imposibles.  Y por &uacute;ltimo, el efecto de variar los supuestos involucrados en  el c&aacute;lculo de los AVP (en particular el tipo de ponderaci&oacute;n  por edad y el porcentaje de descuento en el tiempo) depende de los datos  que se est&eacute;n analizando.      <p>El c&aacute;lculo de los AVP puede, en ocasiones, proporcionar resultados  bien distintos a los proporcionados por las cl&aacute;sicas tasas de mortalidad;  dado que los AVP integran aspectos importantes no contemplados en las cl&aacute;sicas  tasas de mortalidad se impone i) el rean&aacute;lisis de algunas estad&iacute;sticas  nacionales y provinciales retrospectivamente, y ii) la aplicaci&oacute;n  sistem&aacute;tica de estas herramientas a las estad&iacute;sticas nacionales  presentes y futuras.  <h4>      <br>  SUMMARY</h4>  The behaviour of the epidemic outbreaks of food-borne diseases, in Pinar  del Rio province in the last 18 years was analyzed and evaluated. The number  of outbreaks and the total of people affected in the different years as  well as the municipalities where they took place were checked. The main  food involved, the causal agents producing these diseases, places of occurrence  and the factors that have contributed to the appearence of these outbreaks  were also identified. All the information was obtained through the epidemiological  surveillance of food-borne diseases, which was established in the decade  of the 70' s. In Cuba the report and study of food-borne diseases outbreaks  is compulsory. Is was determined that the staphylococcus aureus was the  causal agent more frequent in the outbreaks, though in the last years,  other pathogens such as Salmomella, E. Coli and Shigella have increased.  The prolonged time between food preparation and their consumption is the  most important factor as a cause of these diseases in the country.      <p><i>Subject headings:</i> EPIDEMIOLOGIC SURVEILLANCE; FOOD MICROBIOLOGY;  SALMONELLA INFECTIONS.  <h4>      <br>  REFERENCIAS BIBLIOGR&Aacute;FICAS</h4>    <ol>      <!-- ref --><li>  Quevedo F, Gonz&aacute;lez S. Enfermedades transmitidas por alimentos.  Impacto socio econ&oacute;mico. Aliment Latinoam 1994;203:52-65.</li>    <!-- ref --><li>  OPS, INPPAZ Guiaveta. Programa de Salud P&uacute;blica Veterinaria HPV-FOS  1991;103-93.</li>    <!-- ref --><li>  Kasirye-Alemu E. Important foodborne illnesses in Kenda and factors contributing  to the problem. Technol and Nutr 1986;12:128-33.</li>    <!-- ref --><li>  Guellouz H, Ben Aissa R. Salmonella isolated from food products of animal  origin between 1989 and 1993 in the town of Tunis. Bull Soc Pathol Exot  1995;88(5)253-6.</li>    <!-- ref --><li>  Evans Mr, Parry SM, Ribeiro CD. Salmonella outbreak from microwave cooked  food. Epidemiol infect;115 (2):227-30.</li>    <!-- ref --><li>  Richards Ms; Rittman M; Gilbert T; Debuno B; Neill R, et al. Investigation  of a Staphylococcal food poisoning outbreak in a centralized school lunch  program. Public health Ref 1993;108:765-71.</li>    <!-- ref --><li>  Watier L; Rich Ardson S; Hubert B. Salmonella enteritidis infection in  France and the United States. Am J Public health 1993;83;1694-700.</li>    <!-- ref --><li>  Watier L; Richardson S, Hubert B. Salmonella enteritidis infection in France  and the United States. Am J Public health 1993;83.</li>    <!-- ref --><li>  Grillo M, Legomin ME, Caballero A, Castro A, Hern&aacute;ndez A. An&aacute;lisis  de las enfermedades transmitidas por alimentos en Cuba. Rev Cubana Aliment  Nutr 1996;10(2):100-4.</li>    <!-- ref --><li>  Monge R, Arias ML. Calidad microbiol&oacute;gica de alimentos vendidos  en las fiestas populares. Rev Costarric. Cienc Med 1991;12:17-24.</li>    <!-- ref --><li>  Lee WC, Sakai T, Lee MJ, Hamakawa M. An epidemiological study of food poisoning  in Korea and Japon. Int. J F00d Microbiological, 1996 29(2-3):141-8.</li>    <!-- ref --><li>  Duran Moreno A, Toledano Hidalgo P. El control de la higiene alimentaria  durante la exposici&oacute;n universal de Sevilla (EXPO&acute;92) Gac Sanit  1993;7 (38):249-58.</li>    <!-- ref --><li>  Almeida RC, Kuage AY, Serrano AM. Evaluation and control of the microbiological  quality of hands in food handlers. Rev Saude public 1995:29(4):290-4.</li>    </ol>        <p>    <br>Recibido: 26 de abril de 1999. Aprobado: 23 de Marzo del 2000.      <br>Dr. <i>Jos&eacute; Antonio Correa Vara</i>. Ministerio de Salud P&uacute;blica,  Calle 23 y N Edificio Soto, Plaza de la Revoluci&oacute;n, Ciudad de La  Habana, Cuba.      <br>&nbsp;      <br>&nbsp;  <dir><a NAME="*"></a><sup>1</sup> Doctor en Ciencias M&eacute;dicas, profesor    Titular. Especialista en Higiene de los Alimentos, Ministerio de Salud P&uacute;blica.        <br>   &nbsp;M&eacute;dico, Especialista en Higiene de los Alimentos. Centro Provincial    de Higiene y Epidemiolog&iacute;a, Pinar del R&iacute;o.     <br>   <sup>3</sup> M&eacute;dico, Especialista en Higiene de los Alimentos. Ministerio    de Salud P&uacute;blica.     ]]></body>
<body><![CDATA[<br>   <sup>4</sup> Licenciado en Ingl&eacute;s, Profesor de la Facultad de Ciencias    M&eacute;dicas.     <br>   &nbsp;    <h5>&nbsp; </h5>   &nbsp;</dir>         ]]></body><back>
<ref-list>
<ref id="B1">
<nlm-citation citation-type="journal">
<person-group person-group-type="author">
<name>
<surname><![CDATA[Quevedo]]></surname>
<given-names><![CDATA[F]]></given-names>
</name>
<name>
<surname><![CDATA[González]]></surname>
<given-names><![CDATA[S]]></given-names>
</name>
</person-group>
<article-title xml:lang="es"><![CDATA[Enfermedades transmitidas por alimentos.: Impacto socio económico]]></article-title>
<source><![CDATA[Aliment Latinoam]]></source>
<year>1994</year>
<volume>203</volume>
<page-range>52-65.</page-range></nlm-citation>
</ref>
<ref id="B2">
<nlm-citation citation-type="">
<collab>OPS,</collab>
<source><![CDATA[Programa de Salud Pública Veterinaria HPV-FOS 1991]]></source>
<year></year>
<page-range>103-93</page-range></nlm-citation>
</ref>
<ref id="B3">
<nlm-citation citation-type="journal">
<person-group person-group-type="author">
<name>
<surname><![CDATA[Kasirye-Alemu]]></surname>
<given-names><![CDATA[E]]></given-names>
</name>
</person-group>
<article-title xml:lang="en"><![CDATA[Important foodborne illnesses in Kenda and factors contributing to the problem]]></article-title>
<source><![CDATA[Technol and Nutr]]></source>
<year>1986</year>
<volume>12</volume>
<page-range>128-33</page-range></nlm-citation>
</ref>
<ref id="B4">
<nlm-citation citation-type="journal">
<person-group person-group-type="author">
<name>
<surname><![CDATA[G uellouz]]></surname>
<given-names><![CDATA[H]]></given-names>
</name>
<name>
<surname><![CDATA[Ben Aissa]]></surname>
<given-names><![CDATA[R]]></given-names>
</name>
</person-group>
<article-title xml:lang="en"><![CDATA[Salmonella isolated from food products of animal origin between 1989 and 1993 in the town of Tunis]]></article-title>
<source><![CDATA[Bull Soc Pathol Exot]]></source>
<year>1995</year>
<volume>88</volume>
<numero>5</numero>
<issue>5</issue>
<page-range>253-6</page-range></nlm-citation>
</ref>
<ref id="B5">
<nlm-citation citation-type="journal">
<person-group person-group-type="author">
<name>
<surname><![CDATA[Evans]]></surname>
<given-names><![CDATA[Mr]]></given-names>
</name>
<name>
<surname><![CDATA[Parry]]></surname>
<given-names><![CDATA[SM]]></given-names>
</name>
<name>
<surname><![CDATA[Ribeiro]]></surname>
<given-names><![CDATA[CD]]></given-names>
</name>
</person-group>
<article-title xml:lang="en"><![CDATA[Salmonella outbreak from microwave cooked food]]></article-title>
<source><![CDATA[Epidemiol infect]]></source>
<year></year>
<volume>115</volume>
<numero>2</numero>
<issue>2</issue>
<page-range>227-30</page-range></nlm-citation>
</ref>
<ref id="B6">
<nlm-citation citation-type="journal">
<person-group person-group-type="author">
<name>
<surname><![CDATA[Richards]]></surname>
<given-names><![CDATA[Ms]]></given-names>
</name>
<name>
<surname><![CDATA[Rittman]]></surname>
<given-names><![CDATA[M]]></given-names>
</name>
<name>
<surname><![CDATA[Gilbert]]></surname>
<given-names><![CDATA[T]]></given-names>
</name>
<name>
<surname><![CDATA[Debuno]]></surname>
<given-names><![CDATA[B]]></given-names>
</name>
<name>
<surname><![CDATA[Neill]]></surname>
<given-names><![CDATA[R]]></given-names>
</name>
</person-group>
<article-title xml:lang="en"><![CDATA[Investigation of a Staphylococcal food poisoning outbreak in a centralized school lunch program]]></article-title>
<source><![CDATA[Public health Ref]]></source>
<year>1993</year>
<volume>108</volume>
<page-range>765-71</page-range></nlm-citation>
</ref>
<ref id="B7">
<nlm-citation citation-type="journal">
<person-group person-group-type="author">
<name>
<surname><![CDATA[Watier]]></surname>
<given-names><![CDATA[L]]></given-names>
</name>
<name>
<surname><![CDATA[Rich Ardson]]></surname>
<given-names><![CDATA[S]]></given-names>
</name>
<name>
<surname><![CDATA[Hubert]]></surname>
<given-names><![CDATA[B]]></given-names>
</name>
</person-group>
<article-title xml:lang="en"><![CDATA[Salmonella enteritidis infection in France and the United States]]></article-title>
<source><![CDATA[Am J Public health]]></source>
<year>1993</year>
<volume>83</volume>
<page-range>1694-700</page-range></nlm-citation>
</ref>
<ref id="B8">
<nlm-citation citation-type="journal">
<person-group person-group-type="author">
<name>
<surname><![CDATA[Watier]]></surname>
<given-names><![CDATA[L]]></given-names>
</name>
<name>
<surname><![CDATA[Richardson]]></surname>
<given-names><![CDATA[S]]></given-names>
</name>
<name>
<surname><![CDATA[Hubert]]></surname>
<given-names><![CDATA[B]]></given-names>
</name>
</person-group>
<article-title xml:lang="en"><![CDATA[Salmonella enteritidis infection in France and the United States]]></article-title>
<source><![CDATA[Am J Public health]]></source>
<year>1993</year>
<page-range>83</page-range></nlm-citation>
</ref>
<ref id="B9">
<nlm-citation citation-type="journal">
<person-group person-group-type="author">
<name>
<surname><![CDATA[Grillo]]></surname>
<given-names><![CDATA[M]]></given-names>
</name>
<name>
<surname><![CDATA[Legomin]]></surname>
<given-names><![CDATA[ME]]></given-names>
</name>
<name>
<surname><![CDATA[Caballero]]></surname>
<given-names><![CDATA[A]]></given-names>
</name>
<name>
<surname><![CDATA[Castro]]></surname>
<given-names><![CDATA[A]]></given-names>
</name>
<name>
<surname><![CDATA[Hernández]]></surname>
<given-names><![CDATA[A]]></given-names>
</name>
</person-group>
<article-title xml:lang="es"><![CDATA[Análisis de las enfermedades transmitidas por alimentos en Cuba.]]></article-title>
<source><![CDATA[Rev Cubana Aliment Nutr]]></source>
<year>1996</year>
<volume>10</volume>
<numero>2</numero>
<issue>2</issue>
<page-range>100-4.</page-range></nlm-citation>
</ref>
<ref id="B10">
<nlm-citation citation-type="journal">
<person-group person-group-type="author">
<name>
<surname><![CDATA[Monge]]></surname>
<given-names><![CDATA[R]]></given-names>
</name>
<name>
<surname><![CDATA[Arias]]></surname>
<given-names><![CDATA[ML]]></given-names>
</name>
</person-group>
<article-title xml:lang="es"><![CDATA[Calidad microbiológica de alimentos vendidos en las fiestas populares]]></article-title>
<source><![CDATA[Rev Costarric. Cienc Med]]></source>
<year>1991</year>
<volume>12</volume>
<page-range>17-24</page-range></nlm-citation>
</ref>
<ref id="B11">
<nlm-citation citation-type="journal">
<person-group person-group-type="author">
<name>
<surname><![CDATA[Lee]]></surname>
<given-names><![CDATA[WC]]></given-names>
</name>
<name>
<surname><![CDATA[Sakai]]></surname>
<given-names><![CDATA[T]]></given-names>
</name>
<name>
<surname><![CDATA[Lee]]></surname>
<given-names><![CDATA[MJ]]></given-names>
</name>
<name>
<surname><![CDATA[Hamakawa]]></surname>
<given-names><![CDATA[M]]></given-names>
</name>
</person-group>
<article-title xml:lang="en"><![CDATA[An epidemiological study of food poisoning in Korea and Japon.]]></article-title>
<source><![CDATA[Int. J F00d Microbiological]]></source>
<year>1996</year>
<volume>29</volume>
<numero>(2-3)</numero>
<issue>(2-3)</issue>
<page-range>141-8.</page-range></nlm-citation>
</ref>
<ref id="B12">
<nlm-citation citation-type="journal">
<person-group person-group-type="author">
<name>
<surname><![CDATA[Duran Moreno]]></surname>
<given-names><![CDATA[A]]></given-names>
</name>
<name>
<surname><![CDATA[Toledano Hidalgo]]></surname>
<given-names><![CDATA[P]]></given-names>
</name>
</person-group>
<article-title xml:lang="es"><![CDATA[El control de la higiene alimentaria durante la exposición universal de Sevilla (EXPO&acute;92)]]></article-title>
<source><![CDATA[Gac Sanit]]></source>
<year>1993</year>
<volume>7</volume>
<numero>38</numero>
<issue>38</issue>
<page-range>249-58</page-range></nlm-citation>
</ref>
<ref id="B13">
<nlm-citation citation-type="journal">
<person-group person-group-type="author">
<name>
<surname><![CDATA[Almeida]]></surname>
<given-names><![CDATA[RC]]></given-names>
</name>
<name>
<surname><![CDATA[Kuage]]></surname>
<given-names><![CDATA[AY]]></given-names>
</name>
<name>
<surname><![CDATA[Serrano]]></surname>
<given-names><![CDATA[AM]]></given-names>
</name>
</person-group>
<article-title xml:lang="en"><![CDATA[Evaluation and control of the microbiological quality of hands in food handlers]]></article-title>
<source><![CDATA[Rev Saude public]]></source>
<year>1995</year>
<volume>29</volume>
<numero>4</numero>
<issue>4</issue>
<page-range>:290-4.</page-range></nlm-citation>
</ref>
</ref-list>
</back>
</article>
