ARTÍCULO ORIGINAL
Applying the 3-element windkessel model to photoplethysmographic signals. Gender differences and age correlation
Aplicación a señales fotopletismográficas del modelo de "Cámara de aire con tres elementos". Diferencias en cuanto a género y correlación con la edad
Dr. Jorge Luis Hernández Cáceres
Center for Cybernetics Applications to Medicine (CECAM), Havana Medical Sciences University. Cuba. E-mail: cacerjlh@infomed.sld.cu; cacerjlh@yahoo.com
]]>
Automatically averaged photoplethysmographic (PPG) signals were fit to a 3-element windkessel model using a Gauss-Newton optimization algorithm. Data corresponded to 78 healthy subjects (ages from 8 to 87 years). Unlike other reports, two phase velocities are also estimated from the model. Gender differences were found, particularly respect to individual parameters correlation with age. When a nonlinear model was fit to the two first principal components, a high correlation with age was found for both females (r=0.69) and male subjects (r=0.77). Our results further support the idea that the PPG signal is a valuable source of information about the cardiovascular system, comparable to the much more expensive continuous pressure signal.
Key words: photoplethysmographic signal, windkessel model, cardiovascular age, mathematical model.
Señales fotopletismográficas automáticamente promediadas fueron ajustadas a un modelo de "bomba hidráulica" de tres elementos. Para ello se utilizó un algoritmo de optimización del tipio "Gauss-Newton". Los datos fueron obtenidos de 78 individuos sanos con edades entre 8 y 87 años. A diferencia de otros reportes, en el presente trabajo se estimaron dos velocidades de fase a partir del modelo. Al aplicar un modelo no lineal respecto los dos primeros componentes principales, se obtuvo una elevada correlación con la edad tanto para los sujetos femeninos (r=0.69) como para los masculinos (r=0.77). Nuestros resultados ofrecen un apoyo adicional a la idea de que la señal fotopletismográfica es una fuente importante de información acerca del sistema cardiovascular, comparable a la señal de presión continua, aun cuando esta última es mucho más costosa.
Palabras clave: señal fotopletismográfica, modelo de cámara de aire, edad cardiovascular, modelo matemático.
INTRODUCTION
The first cardiovascular model that considered pulsatile flow was suggested by Otto Frank in 1899.1,2 Frank hypothesized that the arterial tree functions as a compression chamber or "windkessel" in a fire pump. The first half of 20th century saw very little application of Frank's model to cardiovascular function, limited mainly by scarce knowledge about vessel's dynamics as well as poor technological resources for continuous pulse pressure recordings.3 Recently this state of affairs has changed for the better, and small modifications introduced to the lumped model are leading to the extraction of clinically sound information. From a practical viewpoint, the most important part of the analysis with a 3-elements' variant of the Frank's model includes the approximation of the systolic component of the waveform to the following nonlinear function with 6 parameters (A1… A6).
Where P(t) denotes the continuous pressure as a function of time.4
If systemic vascular resistance can be estimated, then two compliance components ("resistive compliance" C1and "oscillatory compliance" C2) can be obtained, since4
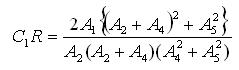 (2)
(2)
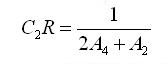 (3)
(3)
 (4) ]]>
Widespread application of these results in primary care settings meets at least two drawbacks. The first limitation is related to the need to record pulse pressure continuously. This is possible only in specialized laboratories, and public health facilities in many countries lack them. On the other hand, obtaining a compliance estimate requires measuring peripheral resistance, but peripheral resistance can be obtained either from cardiac output or from a nonlinear function of age, mean heart rate, mean systolic and mean diastolic blood pressure. Such estimation can add substantial error (due to individual's variability) to the estimated compliance.
The use of the photoplethysmographic signal (PPG) as a proxy for continuous pulse recordings has been proposed.6,7 Theoretical models suggest that pulse pressure and volume changes are linearly proportional.4 Even when the "plethysmographic" signal is not purely about volume changes, an important part of it is associated to volume dynamics. On the other hand, PPG signals can be acquired at a high sampling frequency, 1000 Hz being a typical value. Compared to the 128Hz sampling frequency reported in most studies with continuous pressure recordings, PPG signal can add a larger number of data points thus improving the time resolution. It seems that the low temporal resolution of continuous pressure signals can be the cause of errors in compliance estimation.5,8
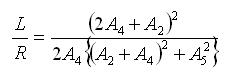
Theoretical elaborations, however, suggest that another important parameter can be estimated from the 6-parameter model without the need of estimating peripheral resistance.
In particular, phase space velocity may be deduced from:9
 (5)
(5)
Hopefully these two velocities can be somehow related to propagation velocity, a measurable entity highly correlated with age.10-15
Here, we approximate the diastolic component of the PPG signal with function (1). Besides parameters A1-A6, we calculate C1R, C2R as well as two phase velocities: "resistive phase velocity" ![]() and "oscillatory phase velocity"
and "oscillatory phase velocity"![]() .
.
All these are submitted to multivariate analysis focused on association with age.
]]>
METHODSSubjects. Seventy eight volunteers (47 males with ages from 12 y to 87 y, and 31 females with ages from 8 y to 89 y) were recruited in the city of Orense (Spain). They were free of clinical cardiovascular disease and medication, and Body Mass Index never surpassed 31 kgxm-2. Approval was obtained from the local research ethics committee, and written informed consent was obtained from all participants. Five-min-duration photoplethysmographic signals were obtained from the pointer finger of the right arm with the subject in supine position, using a validated oximeter (Nellcor 395, USA). Signals were digitized at 1000 Hz and saved as ASCII files.
Wave averaging. For wave averaging, a pattern vector of length L (usually about 90 data points) was picked by visual inspection. Correlations were measured between the pattern vector and each individual vector of length L starting at the point I of the original signal. The obtained vector of correlations (corresponding to about 100 seconds of recording) was then submitted to further analysis. Those vectors signal having a correlation higher than a certain threshold "Th" and corresponding to a local correlation maximum were picked as individual waves and entered as rows of the matrix M of the waveforms. From M the average waveform was obtained via averaging over all rows. The main virtue of the method is that a representative wave is obtained without the need to rely on subjective opinions of experts.
Fitting of data into the model. Averaged waves were fit to equation (1) by using a Gauss-Newton optimization algorithm.16 Only solutions whose correlation coefficients exceeded 0.99 were accepted.
Statistical methods: Correlation matrices and multiple regression analysis (forward stepwise variant) were performed.
Multivariate analysis included principal component determination and nonlinear regression respect to PC1 and PC2. For nonlinear estimation, the following 4th degree function was fitted to age data.
Limitations of present study. Using PPG signal as a proxy for continuous pulse wave recordings seems to be justified for the case when both signals are proportionally dependent. Evidence from the literature supports this assumption.7 At the same time, the surrogate variables obtained ("compliance", "phase velocity", etc.) can be approximated to the real variables with the precision of a linear factor. Since the PPG signal is expressed in units of absorbance, it is very difficult to express these variables in their real units without a shrewd calibration experiment. Thus the words "compliance", velocity, etc. cannot be taken at face value.
The second limitation is related to the sample size. This study uses a smaller sample than other reports. Some of the differences obtained here between male and female subjects may vanish with increased sample size.
]]>
RESULTSEvidences from the literature suggest marked differences between women and men in their compliance values.4 Thus the analysis was conducted separately for each gender.
Male subjects. The correlation matrix for all variables appears represented in Table 1. As can be seen, significant correlations with age were obtained for both phase velocities and "L/R". At the same time,![]() is highly correlated with
is highly correlated with ![]() whereas for
whereas for ![]() a significant correlation was found with "L/R".
a significant correlation was found with "L/R".
Unexpected is the very high correlation between C1R and A3 even when no explicit theoretical association is perceived (see equations 1-4).
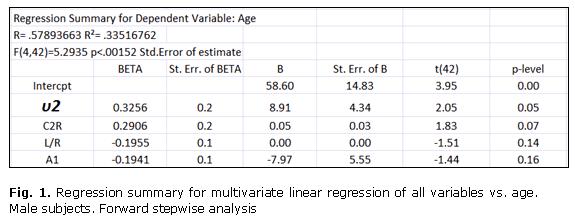
Since there are significant univariate correlations with age, it is to be expected that a multivariate linear regression could yield a correlation with age stronger than any of the individual variables does.
Regression summary (Fig.1) accounts for a strong presence of "oscillatory phase velocity" in the regression model. Overall, the strength of association increased to 0.58. In terms of significance an improvement from p= 0.0080 to p=0.00152 took place when passing from univariate to multivariate regression.
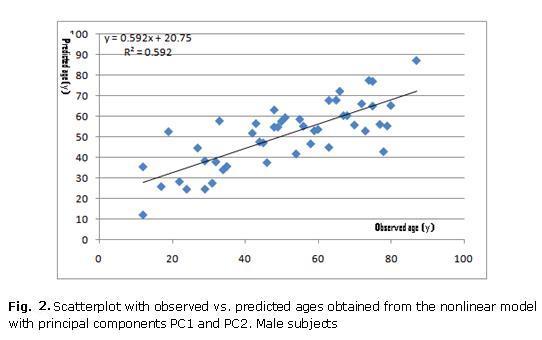
Multivariate analysis including principal component determination and nonlinear regression of age respect to PC1 and PC2 (equation 6). Led to a further improvement in prediction quality (r=0.77; figure 2).
Female subjects. Table 2 represents the correlation matrix for all variables. In this case, several differences with male subjects appeared. As can be noticed, a significant correlation with age was obtained for parameter A2 only. At the same time, similar to male subjects,The high correlation between C1R and A3 observed for male subjects is still present among female subjects.
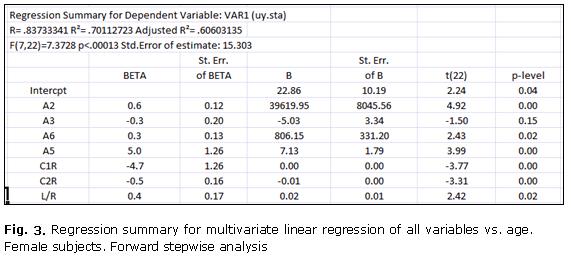
The results of multivariate analysis for female subjects are summarized in figure 3. As observed, both the two compliances and 4 coefficients from model (1) are contributing to the linear multivariate model. Salient here is the sharp improvement obtained with the multivariate regression. In terms of probability it changed from p=0.0441 to p=0.00013when passing from univariate to multivariate regression.
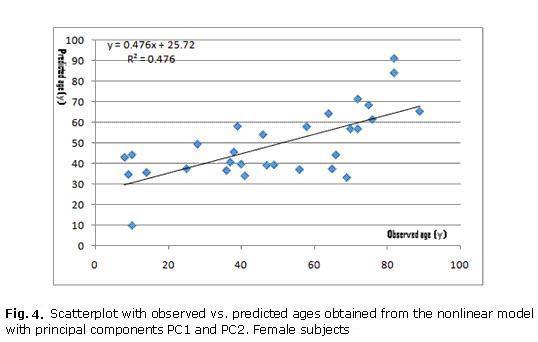
Multivariate analysis including principal component determination and nonlinear regression of age with respect to PC1 and PC2 (equation 6) led to a similarly high prediction quality (r=0.69; figure 4).
DISCUSSION
In this work, we tried to get an answer to the rather naïve question of what information can be obtained if we apply the 3-element windkessel model to a sample of PPG recordings with no possibility of recording other variables such as peripheral resistance. According to our results the answer heavily depends on the gender of recorded subjects: More variables retain a strong univariate association with age among male subjects whereas a surprisingly high correlation can be obtained in a linear multiple regression for female subjects. Nonlinear regression of age against PC1 and PC2 leads to comparable results for both genders.
In this study based on the 3-elements windkessel model, versions of both resistive and oscillatory phase velocities are introduced. Since these do not depend upon peripheral resistance, a certain advantage respect to oscillatory compliance. Our results showed that both velocities (resistive and oscillatory) were highly correlated to each other among both female and male subjects. It reached significant values with age among male subjects. ]]>
That strong associations are found, especially in multivariate analysis with female subjects, as well as in nonlinear analysis, is noteworthy. We do not exclude the possibility that some differences will be erased as the sample size is increased. However, at this stage results remain encouraging, especially because they illustrated other potentialities of the 3-element windkessel model.Even when the structure of the correlation matrices differed among genders, the introduction of two phase velocities into the model, as well as he application of nonlinear multivariate regression respect to principal components clearly suggests that the 3-element windkessel model is a promising platform for further analysis of PPG signals.
REFERENCES BIBLIOGRAPHICS
1. Frank O. Die Grundform des arteriellen Pulses. Z. Biol. 1899;22: 253-277.
2. Frank O. Die Elastizität der Blutgefässe. Z. Biol. 1920; 71:255-272.
3. Imholz BPM, Wieling W, van Montfrans GA, Wesseling KH. Fifteen years of experience with finger arterial pressure monitoring: assessment of the technology. Cardiovasc Res. 1998;38: 605-616. ]]>
4. Crabtree VP. Noninvasive vascular assessment using protoplethysmography [doctoral thesis]. Loughborough University; 2003.
5. Glasser SM, McVeigh GE, Bratteli CW, Morgan DJ, Finkelstein SM, Cohn JN. Age-Related Abnormalities in Arterial Compliance Identified by Pressure Pulse Contour Analysis: Aging and Arterial Compliance. Hypertension. 1999; 33:1392-1398.
6. In CJ, Jae IK, Sung OH, Hyung RY. A new method to estimate arterial blood pressure using photoplethysmographic signal. Conference Proceedings of the 28th International Conference of IEEE Engineering in Medicine and Biology Society, New York, USA. 2006; 1: 4667-4670.
7. Teng XF, Zhang YT. Continuous and noninvasive estimation of arterial blood pressure using a photoplethysmographic approach. In Engineering in Medicine and Biology Society, 2003. Proceedings of the 25th Annual International Conference of the IEEE, Cancun, México, 2003. 4: 3153-3156.
8. McVeigh GE, urns DE, Finkelstein SM, McDonald KM, Mock JE, Feske W, Carlyle PF, Flack J, Grimm R, Cohn JN. Reduced vascular compliance as a marker for essential hypertension. Am J Hypertens. 1991; 4:245-257. ]]>
9. Westterhof N, Elzinga G, Sipkema P, van den Bos GC. Quantitative Analysis of the arterial system and heart by means of pressure-flow relations. In: N. H. Wang and N. A. Norman (eds.). Cardiovascular flow dynamics and measurements. Baltimore: University Park Press; 1977: 403-438.
10. O'Rourke MF, Blazek JV, Morreels CL, Krovetz LJ. Pressure Wave Transmission along the Human Aorta: Changes With Age and in Arterial Degenerative Disease. Circ Res. 1968;23:567-579.
11. Milnor WR, Conti CR, Lewis KB, O'Rourke MF. Pulmonary Arterial Pulse Wave Velocity and Impedance in Man. Circ Res. 1969;25:637-649.
12. Cox RH. Determination of the True Phase Velocity of Arterial Pressure Waves in Vivo. Circ Res. 1971;29:407-418.
13. Farrar DJ, Green HD, Bond MG, Wagner WD, Gobbeé RA. Aortic pulse wave velocity, elasticity, and composition in a nonhuman primate model of atherosclerosis. Circ Res. 1978;43:52-62. ]]>
14. O'Rourke M. Arterial stiffness, systolic blood pressure, and logical treatment of arterial hypertension. Hypertension. 1990;15: 339-347.
15. Qasem A, Avolio A. Determination of Aortic Pulse Wave Velocity From Waveform Decomposition of the Central Aortic Pressure Pulse. Hypertension. 2008;51:188-195.
16. Grave de Peralta R, Hernández Caceres JL, Castellanos M. Garateix A. A computer program for the estimation of membrane currents based on the Gauss-Newton method. Int J Biomed Comput. 1991; 28:47-52.
Recibido: 10 de diciembre de 2013.
Aprobado: 20 de enero de 2014. ]]>
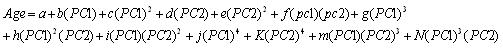 (6)
(6)