<?xml version="1.0" encoding="ISO-8859-1"?><article xmlns:mml="http://www.w3.org/1998/Math/MathML" xmlns:xlink="http://www.w3.org/1999/xlink" xmlns:xsi="http://www.w3.org/2001/XMLSchema-instance">
<front>
<journal-meta>
<journal-id>1684-1859</journal-id>
<journal-title><![CDATA[Revista Cubana de Informática Médica]]></journal-title>
<abbrev-journal-title><![CDATA[RCIM]]></abbrev-journal-title>
<issn>1684-1859</issn>
<publisher>
<publisher-name><![CDATA[Universidad de Ciencias Médicas de La Habana]]></publisher-name>
</publisher>
</journal-meta>
<article-meta>
<article-id>S1684-18592016000100001</article-id>
<title-group>
<article-title xml:lang="en"><![CDATA[Real-time external labeling layout algorithm for Direct Volume Rendering]]></article-title>
<article-title xml:lang="es"><![CDATA[Algoritmo de posicionamiento en tiempo real de etiquetas externas para (DVR)]]></article-title>
</title-group>
<contrib-group>
<contrib contrib-type="author">
<name>
<surname><![CDATA[Silva Rojas]]></surname>
<given-names><![CDATA[Luis Guillermo]]></given-names>
</name>
<xref ref-type="aff" rid="A01"/>
</contrib>
<contrib contrib-type="author">
<name>
<surname><![CDATA[Carrasco Velar]]></surname>
<given-names><![CDATA[Ramón]]></given-names>
</name>
<xref ref-type="aff" rid="A01"/>
</contrib>
</contrib-group>
<aff id="A01">
<institution><![CDATA[,Universidad de las Ciencias Informáticas  ]]></institution>
<addr-line><![CDATA[La Habana ]]></addr-line>
<country>Cuba</country>
</aff>
<pub-date pub-type="pub">
<day>15</day>
<month>06</month>
<year>2016</year>
</pub-date>
<pub-date pub-type="epub">
<day>15</day>
<month>06</month>
<year>2016</year>
</pub-date>
<volume>8</volume>
<numero>1</numero>
<fpage>1</fpage>
<lpage>11</lpage>
<copyright-statement/>
<copyright-year/>
<self-uri xlink:href="http://scielo.sld.cu/scielo.php?script=sci_arttext&amp;pid=S1684-18592016000100001&amp;lng=en&amp;nrm=iso"></self-uri><self-uri xlink:href="http://scielo.sld.cu/scielo.php?script=sci_abstract&amp;pid=S1684-18592016000100001&amp;lng=en&amp;nrm=iso"></self-uri><self-uri xlink:href="http://scielo.sld.cu/scielo.php?script=sci_pdf&amp;pid=S1684-18592016000100001&amp;lng=en&amp;nrm=iso"></self-uri><abstract abstract-type="short" xml:lang="en"><p><![CDATA[Illustrations used in technical and scientific texts often employ labels to correlate the graphic elements and their textual descriptions. Researchers have proposed several algorithms to determine the layout of the annotations on images rendered at interactive frame rates. Generally these layouts can be classified as internal or external. This paper proposes a new algorithm for locating external labels during the real-time direct rendering of volume data. The proposed algorithm uses only the rows of pixels corresponding to the labels anchor points, which optimizes the performance and facilitates its implementation, avoiding the computation of the convex hull for the generated image. Both, the overall visualization performance and the cost of the proposed algorithm are kept in real-time (60 fps) for medium size volumes (about 2563 voxels).]]></p></abstract>
<kwd-group>
<kwd lng="en"><![CDATA[labeling]]></kwd>
<kwd lng="en"><![CDATA[layout]]></kwd>
<kwd lng="en"><![CDATA[real-time]]></kwd>
<kwd lng="en"><![CDATA[volume rendering]]></kwd>
<kwd lng="es"><![CDATA[etiquetado]]></kwd>
<kwd lng="es"><![CDATA[posicionamiento]]></kwd>
<kwd lng="es"><![CDATA[tiempo real]]></kwd>
<kwd lng="es"><![CDATA[obtención de volumen]]></kwd>
</kwd-group>
</article-meta>
</front><body><![CDATA[ <p align="right"><font size="2" face="Verdana"><b>ART&Iacute;CULO ORIGINAL</b></font></p>     <p align="right">&nbsp;</p>     <p align="left"><font size="4" face="Verdana">Real-time external labeling layout    algorithm for Direct Volume Rendering </font></p>     <p align="left">&nbsp;</p>     <p align="left"><font size="3" face="Verdana"><strong>Algoritmo de posicionamiento    en tiempo real de etiquetas externas para (DVR)</strong> </font></p>     <p align="left">&nbsp;</p>     <p align="left">&nbsp;</p>     <p align="left"><font size="2" face="Verdana"><strong>Engr. Luis Guillermo Silva    Rojas,<sup>I</sup> Ph.D. Ram&oacute;n Carrasco Velar<sup>II</sup> </strong> </font></p>     <P><font size="2" face="Verdana">I Universidad de las Ciencias Inform&aacute;ticas,    La Habana, Cuba. E-mail: <a href="mailto:lgsilva@uci.cu">lgsilva@uci.cu</a>        <br>   </font><font size="2" face="Verdana">II Universidad de las Ciencias Inform&aacute;ticas,    La Habana, Cuba. E-mail: <a href="mailto:rcarrasco@uci.cu">rcarrasco@uci.cu</a>    </font>     ]]></body>
<body><![CDATA[<P>&nbsp;     <P>&nbsp; <hr> <font size="2" face="Verdana"><strong>SUMMARY</strong> </font>     <br>     <br> <font size="2" face="Verdana">Illustrations used in technical and scientific texts  often employ labels to correlate the graphic elements and their textual descriptions.  Researchers have proposed several algorithms to determine the layout of the annotations  on images rendered at interactive frame rates. Generally these layouts can be  classified as internal or external. This paper proposes a new algorithm for locating  external labels during the real-time direct rendering of volume data. The proposed  algorithm uses only the rows of pixels corresponding to the labels anchor points,  which optimizes the performance and facilitates its implementation, avoiding the  computation of the convex hull for the generated image. Both, the overall visualization  performance and the cost of the proposed algorithm are kept in real-time (60 fps)  for medium size volumes (about 2563 voxels). </font>      <P><font size="2" face="Verdana"><strong>Key words:</strong> labeling, layout,    real-time, volume rendering. </font>   <hr> <font size="2" face="Verdana"><strong>RESUMEN</strong> </font>      <P><font size="2" face="Verdana">Las ilustraciones utilizadas en documentos cient&iacute;ficos    y t&eacute;cnicos utilizan frecuentemente etiquetas para correlacionar los elementos    gr&aacute;ficos y sus textos descriptivos. Los investigadores han propuesto    diversos algoritmos para determinar el posicionamiento en tiempo real de las    correspondientes anotaciones en las im&aacute;genes obtenidas en un marco interactivo.    Generalmente estos posicionamientos se clasifican como internos o externos.    Este art&iacute;culo propone un nuevo algoritmo para ubicar etiquetas externas    en tiempo real durante la obtenci&oacute;n de datos de volumen. El algoritmo    propuesto usa solo las filas de p&iacute;xels correspondientes a los puntos    de presentaci&oacute;n de las etiquetas lo que optimiza el desempe&ntilde;o    y facilita la implementaci&oacute;n haciendo innecesarios algunos c&aacute;lculos.    Tanto el desempe&ntilde;o general de la vista como el costo del algoritmo propuesto    se obtienen en tiempo real (60 fps) para vol&uacute;menes de mediana talla (alrededor    de 256 voxels). </font>      <P><font size="2" face="Verdana"><strong>Palabras claves:</strong></font><font size="2" face="Verdana">    etiquetado, posicionamiento, tiempo real, obtenci&oacute;n de volumen.</font> <hr>     <p>&nbsp;</p>     <p>&nbsp;</p>     <p><font size="3" face="Verdana"><strong>INTRODUCTION</strong></font> </p>     ]]></body>
<body><![CDATA[<P><font size="2" face="Verdana">Illustrations with a careful positioning of texts    on the images are used to describe the structure or for constructing complex    objects, resulting in an important tool for developing learning materials such    as textbooks, user manuals and technical specifications. </font>      <P><font size="2" face="Verdana">Although the labeling of technical and scientific    illustrations have been used for centuries, its main function remains to facilitate    the transmission of information, establishing correlations between the graphics    elements of the illustration and their textual descriptions<sup>1</sup>. The clarity of    the relationship between these two basic components, determines the amount of    information that a reader can extract from the content shown.<sup>2</sup> </font>      <P><font size="2" face="Verdana">With the development of three-dimensional techniques    for data acquisition, such as Computed Axial Tomography (CT), Magnetic Resonance    (MRI) and the posterior development of Direct Volume Rendering (DVR) algorithms    at the end of the 80s,<sup>3,4</sup> the need arose for labeling the obtained representations,    balancing the quality of the label layout on the image and the computational    cost to calculate these positions. </font>      <P><font size="2" face="Verdana">Medicine is one of the sciences that obtains    more benefits from labeling algorithms, because medical illustrations are constantly    used in anatomy, surgical planning and collaborative diagnosis. Therefore, modern    radiological stations and medical training systems have functionalities for    the manual labeling of anatomical structures.<sup>5</sup> </font>      <P><font size="2" face="Verdana">This paper proposes a new algorithm for the placement    and visualization of external labels in real time, for DVR of medical images    in the industry standard DICOM format. The algorithm uses only the rows of pixels    corresponding to the labels anchor points, to avoid the computation of the convex    hull for the generated image. The algorithm perform well in real-time for medium    size datasets (about 256<sup>3</sup> voxels). </font>      <P><font size="2" face="Verdana"><strong>1.1. Labeling algorithms</strong> </font>      <P><font size="2" face="Verdana">The labeling can be done interactively or automatically.    The interactive labeling is done by specialists, e.g. radiologists, placing    annotations on two-dimensional views of the dataset.<sup>1</sup> To facilitate this manual    process, the images can be previously segmented. Modern software offers lines,    arrows and text labels to support this process. In the case of automatic labeling,    the software automatically rearranges the labels and takes care of eliminating    crossed lines, overlapping of labels and proximity between the labels and their    linked structure.<sup>1</sup> </font>      <P><font size="2" face="Verdana"><strong>1.2. General requirements for labeling    algorithms</strong> </font>      <P><font size="2" face="Verdana">The requirements for the labeling algorithms    used in three-dimensional illustrations have been previously defined in several    approaches.<sup>6,7,1,8,9,10</sup> These techniques can also be used in DVR implementations.    Although the defined requirements vary slightly, they can be summarized as follows:    </font>      <P><font size="2" face="Verdana">- Readability: Labels must not overlap. The font    must remain legible.    ]]></body>
<body><![CDATA[<br>   </font><font size="2" face="Verdana">- Unambiguity: the relationship between    labels and their associated structures must be observed without ambiguity.    <br>   </font><font size="2" face="Verdana">- Prevention of visual clutter: the lines    connecting the labels should not cross.    <br>   </font><font size="2" face="Verdana">- Interactivity: calculating the layout    of the labels should not significantly affect the visualization performance.    <br>   </font><font size="2" face="Verdana">- Compaction: minimize the area occupied    by the labels.    <br>   </font><font size="2" face="Verdana">- Temporal coherence during exploration:    prevent discontinuities and breaks of labels positions. </font>      <P><font size="2" face="Verdana">The management of all the requirements is a complex    task. This situation is aggravated by the interactivity, due to the constant    computation each time a new images is rendered during the user exploration.    Hartmann et al.<sup>7</sup> propose some metrics to evaluate, in a certain degree,    the functional requirements and aesthetic attributes of labeling algorithms.    Finding the optimal solution to the labeling task without labels overlaps, is    considered an NP-Hard problem.<sup>6,11,12,13</sup> There are numerous implementations    trying to balance the aesthetic constraints and the computational complexity.    </font>      <P><font size="2" face="Verdana">There are different criteria for classifying    labeling algorithms considering the label layout on the image. In general, they    can be classified into: </font>      <P><font size="2" face="Verdana">- 
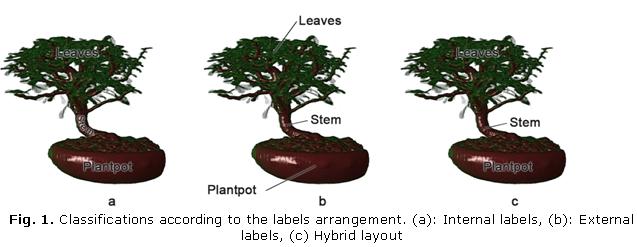
Internal: appropriate when there is enough    space to place the labels.<sup>14</sup> Have the advantage of easy visual association    of the text and its structure, because they are superposed on the said structure.<sup>15</sup>    Its main disadvantages are that occlude part of the labeled structure and require    a prior segmentation of the structures present in the image (<a href="/img/revistas/rcim/v8n1/f0101116.jpg">Fig.    1a</a>).    <br>   </font><font size="2" face="Verdana">- External: used when there is enough white    space outside the image<sup>14</sup> (<a href="/img/revistas/rcim/v8n1/f0101116.jpg">Fig. 1b</a>)    and are located on the outside or background of the image.<sup>15</sup>    <br>   </font><font size="2" face="Verdana">- Hybrid: incorporates internal and external    labels depending on the image magnification level. If an object is close enough    to the camera, an internal label is used, otherwise an external one is used<sup>1,12</sup>    (<a href="/img/revistas/rcim/v8n1/f0101116.jpg">Fig. 1c</a>). </font>      ]]></body>
<body><![CDATA[<P><font size="2" face="Verdana">The proposed algorithm is designed for general    purpose labeling of images obtained by DVR, regardless the content type of the    image or its segmentation level. Having no segmentation information, the boundaries    of the structures are unknown for the image, hence, it is necessary to place    the labels on the outside, as shown in <a href="/img/revistas/rcim/v8n1/f0101116.jpg">figure.    1b</a></font><font size="2" face="Verdana">.</font>      <P><font size="2" face="Verdana"><strong>1.3. External labeling</strong> </font>      <P><font size="2" face="Verdana">External labeling algorithms are usually inspired    by the traditional illustrative techniques used by illustrators. Ali et al.<sup>6</sup>    perform a manual analysis of numerous high-quality illustrations that uses external    labeling and classifies its layouts according to their common properties: </font>      <P> <font size="2" face="Verdana"> - 
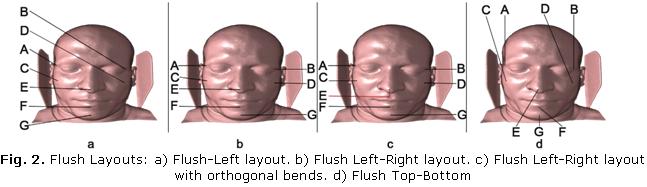
Straight-Line: Labels and anchor points are    connected using straight lines, see (<a href="/img/revistas/rcim/v8n1/f0201116.jpg">Fig.    2a,b,d</a>).    <br>       <br>   - Orthogonal: The connecting lines are parallel to the coordinate axes and the    bends are orthogonal angles, see (<a href="/img/revistas/rcim/v8n1/f0201116.jpg">Fig.    2c</a>).    <br>       <br>   - Flush-Layout: Labels are assigned to different spatial areas:    <br>       <br>   * Flush Left-Right: Labels are placed on the left and/or right of the graphical    object,(<a href="/img/revistas/rcim/v8n1/f0201116.jpg">Fig. 2a,b,c</a>).</font>        ]]></body>
<body><![CDATA[<br>   <font size="2" face="Verdana">* Flush Top-Bottom: Labels are placed on the top    and/or bottom of the graphical object,(<a href="/img/revistas/rcim/v8n1/f0201116.jpg">Fig.    2d</a>). </font>      <P> <font size="2" face="Verdana">- 
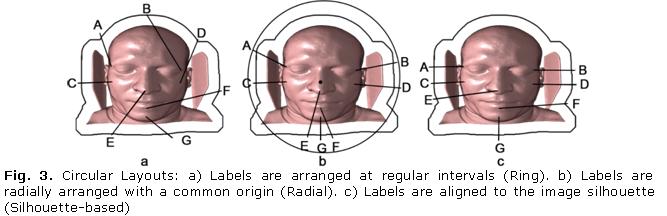
Circular-Layout: Labels are aligned around    the silhouette of the graphical model in a circular fashion: </font>      <P><font size="2" face="Verdana">* Ring: The labels are placed at regular intervals    on a ring circumscribing the graphical model,(<a href="/img/revistas/rcim/v8n1/f0301116.jpg">Fig.    3a</a>).    <br>   * Radial: Labels are located radially relative to a common origin,(<a href="/img/revistas/rcim/v8n1/f0301116.jpg">Fig.    3b</a>).    <br>   * Silhouette-based: Labels are placed near the silhouette of the graphical object,    minimizing the distance with its anchor point,(<a href="/img/revistas/rcim/v8n1/f0301116.jpg">Fig.    3c</a>). </font>      <P>      <P><font size="2" face="Verdana"><strong>2. Related work</strong> </font>      <P><font size="2" face="Verdana">Preim et al.<sup>2</sup> propose an algorithm and its implementation    in the ZOOM ILLUSTRATOR software that lets to put annotations around the image.    The labeling remains consistent after rotate or scale the image. The level of    detail of the labeling fits the available space, employing fisheye techniques.<sup>2</sup>    </font>      <P><font size="2" face="Verdana">Moreover, the own Preim16 proposes an extension    to the previous algorithm that modifies the labels and the structures, influenced    by user interaction. Includes changes in material properties of the relevant    structures to ensure its visibility and recognition. In both cases, the scene    depicted consists of predefined polygonal models. </font>      <P><font size="2" face="Verdana">Hartmann et al.<sup>9</sup> present the Floating Labels    algorithm, a new method for determining an attractive arrangement of labels    over complex objects. The algorithm uses Dynamic Potential Fields for the calculation    of attraction and repulsion forces between the graphic elements and their textual    labels. The algorithm works on 2D projections of 3D geometric objects from manually    selected points of view. Calculating the labeling layout for complicated views,    although it is visually appealing, it is of about 10 seconds, which precludes    its use for applications that require interactivity. </font>      ]]></body>
<body><![CDATA[<P> <font size="2" face="Verdana"> </font><font size="2" face="Verdana">Kamran    and colleagues<sup>6</sup> propose different layouts for placing external labels,    which can be classified into two main groups: Flush Layouts, where labels are    vertically aligned to the left and right or horizontally aligned up and down.    The other classification is Circular Layouts (<a href="/img/revistas/rcim/v8n1/f0301116.jpg">Fig.    3</a>), where the labels positions conform to the shape of the rendered object.    They use a general algorithm for all layouts, which is responsible for determining    the positions of the anchor points and blank space regions. Then, the selected    specific algorithm, determines the starting positions of the labels and calculates    the final positions to meet the aesthetic restrictions. </font>      <P><font size="2" face="Verdana">Bekos et al.<sup>11</sup> introduce the Boundary Labels    model. In this model, the labels are placed around a rectangle aligned with    the coordinate axes that contains the anchor points. Each label connects with    its anchor point by a polygonal line. They pay special attention to avoid lines    crossing. The model is optimized for the labeling of maps. </font>      <P><font size="2" face="Verdana">Moreover, Timo et al.<sup>12,14</sup> present a new architecture    that combines internal and external labels on projections of complex 3D objects,    balancing, in real-time, requirements that may be contradictory, such as unambiguity,    readability, aesthetic considerations and temporal coherence during interaction.    The architecture is divided into three modules: Analysis, Classification and    Layout Manager. During analysis a color-coded projection of the scene is represented.    This representation is segmented, a skeletonization algorithm is applied and    is transformed into a graph (skeleton graph). The best paths in the graph are    then selected to place labels. The classification module takes as input the    best graph path for each structure, which the authors consider is that the best    you can fit the desired text, and classifies the labels as internal or external    (internal labels are prioritized unless the space does not permit). Finally,    the Layout Manager is responsible for determining the final location of the    labels, build the connection lines for the case of external labels and ensure,    as far as possible, the temporal coherence. Although this architecture is one    of the most complete methods reported to date, its main disadvantage is the    computational complexity that represents the real-time calculation of the skeletonization    method. </font>      <P><font size="2" face="Verdana">Timo et al.<sup>17</sup> presented a new layout, based on    the report of Kamran<sup>6</sup>, to organize the labels in contextual groups. The position    of a group of labels is calculated from the centroid of all visible members.    After calculating the initial position, the group moves until fully located    on the background or leave the screen. To maintain the temporal coherence, contextual    groups remain in place until interfere with visualization. When this happens,    the centroid and the new position for the group in conflict is recalculated.    The intersections of the connection lines within groups are solved by exchanging    the positions of their labels. Being based on the method of Kamran6, a skeletonization    is also used to determine the label anchors points, which presupposes that the    displayed image is segmented or color-coded. </font>      <P><font size="2" face="Verdana">Moreover, Cmol&iacute;k and Bittner<sup>10</sup> formulates    labeling as an optimization problem with multiple criteria, which they solve    using fuzzy logic with greedy optimizations. With the implementation of the    method in GPU they achieve interactive time for polygonal models that the authors    consider as medium. </font>      <P><font size="2" face="Verdana">Bruckner and Gr&ouml;ller<sup>18</sup> propose the VolumeShop    software, to generate interactive illustrations using DVR. The VolumeShop labeling    algorithm approximates the object shape by calculating its convex hull, the    obtained polygon is parameterized by its radius, therefore, the position of    the annotations are defined by a number in the range [0,1]. The labels are located    outside the convex hull using its parametric position. All entries are initially    located at the closest point between the anchor point and the shape of the convex    polygon. An iterative algorithm is repeated until all intersections and overlaps    are resolved or the maximum number of iterations is reached. Due to the labels    are initialized close to its anchor point, they move smoothly during the interaction.    Only occurs jumps when the discontinuities and overlaps are resolved. Although    the resulting positions are not optimal, the algorithm keeps interactive times    for a practical number of labels (usually no more than 30 labels are used in    an illustration) and obtains visually appealing layouts. </font>      <P><font size="2" face="Verdana">Generally, the above algorithms have two main    disadvantages. The first one is the need for a prior segmentation of the dataset    or at least a color-coded projection<sup>2,6,12,14,16,17</sup> which is not suitable for    all datasets. The second is the computational complexity of calculating the    convex hull of the generated image<sup>6,18</sup>, the skeletonization algorithm<sup>12,14,17</sup>    or directly the labels positions.<sup>9</sup> </font>      <P><font size="2" face="Verdana"><strong>3. Labeling algorithm</strong> </font>      <P><font size="2" face="Verdana">A group of previously well-defined constraints    were taken into account during the design of the proposed algorithm, especially    those outlined by Brucker and Gr&ouml;ller.<sup>18</sup> </font>      <P><font size="2" face="Verdana">1. Labels must not overlap.    ]]></body>
<body><![CDATA[<br>   2. The connecting lines between the labels and their anchor points should not    cross.    <br>   3. Labels should not occlude the structures of the image.    <br>   4. Labels should be placed as close as possible to their anchor points.    <br>   </font><font size="2" face="Verdana">5. Avoid discontinuities during the interaction.    </font>      <P><font size="2" face="Verdana">In addition to this selection and compilation    of restrictions, it was considered advisable to include the following: </font>      <P><font size="2" face="Verdana">6. The algorithm must do a general purpose labeling,    that is, on any volume, regardless of content, nature or segmentation level.    <br>   </font><font size="2" face="Verdana">7. The labeling must not significantly    affect the visualization performance. </font>      <P><font size="2" face="Verdana">The specific algorithms presented in the previous    section have substantial differences, but they share three basic steps: </font>      <P><font size="2" face="Verdana">1. Placement or calculation of anchor points.    <br>   2. Calculation of the labels initial positions.    ]]></body>
<body><![CDATA[<br>   </font><font size="2" face="Verdana">3. Correction of intersections, overlaps    and discontinuities. </font>      <P><font size="2" face="Verdana"><strong>3.1. Anchor points calculation</strong>    </font>      <P><font size="2" face="Verdana">
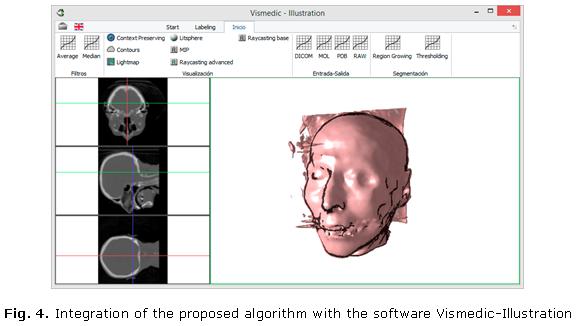
To be general purpose (restriction 6), the algorithm    must be able to label any volume, therefore it is assumed that the obtained    images are not segmented or segmenting makes no sense, meaning that the user    should provide the anchor points and of course, the text of the labels. To facilitate    this process three planes aligned with the coordinate axes (XY, YZ and XZ) were    added, as shown to the left on the view of the developed software that is presented    in <a href="#fig4">figure. 4</a>. The horizontal and vertical lines represent    the projection of each plane on the remaining planes (XY: blue, YZ: red, XZ:    green). </font>      <div align="center"><img src="/img/revistas/rcim/v8n1/f0401116.jpg" width="577" height="326">    <a name="fig4"></a></div>     <P>      <P><font size="2" face="Verdana">The placement of a label can be done by pressing    the right button of the mouse on any plane and write the text in the pop-up    textbox. The label is automatically displayed on the 3D viewer. </font>      <P><font size="2" face="Verdana"><strong>3.2. Calculation of the labels initial    positions</strong> </font>      <P><font size="2" face="Verdana">Direct Volume Rendering, as its name implies,    uses no intermediate geometry (polygonal mesh) to obtain the dataset representation,    therefore, the content of the final image is not known until the image is displayed.    This image can vary widely for the same volume depending on the rendering technique    and its parameters. Given these characteristics, the algorithm must work directly    on the generated image, whose only information known are its pixels. </font>      <P><font size="2" face="Verdana">To determine the labels initial positions the    following steps are taken: </font>      <P><font size="2" face="Verdana">
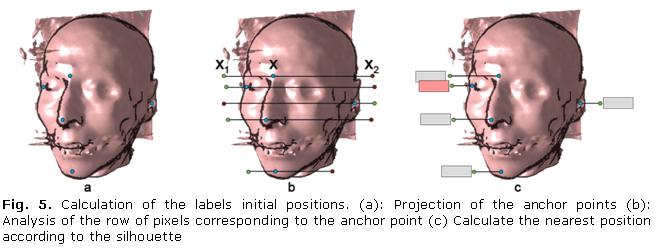
1. Project the 3D positions of the anchor points    on the 2D image, this is done by simply calling the <strong>gluProject</strong>    function from the OpenGL library. The obtained 2D anchor points are ordered    from highest to lowest by its <strong><em>y</em> </strong>coordinate. The results    are shown in Fig. 5a. </font>      ]]></body>
<body><![CDATA[<P><font size="2" face="Verdana">2. For each anchor point, analyze the row of    pixels (coordinate <em><strong>y</strong></em>) to which it belongs to store    the first position of the graphical object (<strong>x</strong><sub>1</sub>) and last (<strong>x</strong><sub>2</sub>).    This is done by comparing the current pixel with the background. See Fig. 5b.    </font>      <P><font size="2" face="Verdana">3. Determining the closest point (<strong>x</strong><sub>1</sub>    or <strong>x</strong><sub>2</sub>), this would be <strong>x</strong><sub>1</sub>    if <strong>|x - x</strong><sub>1</sub><strong>|</strong> <strong>&lt;= |x -    x</strong><sub>2</sub><strong>|</strong>, or <strong>x</strong><sub>2</sub>    otherwise. A small displacement to the left is used if the point is <strong>x</strong><sub>1</sub>    and to the right if it is <strong>x</strong><sub>1</sub>, in order to slightly    separate the labels from the image. If <strong>x</strong><sub>1</sub> is chosen    the label is also shifted left considering the size of text on screen. See <a href="/img/revistas/rcim/v8n1/f0501116.jpg">figure.    5c</a>. </font>      <P><font size="2" face="Verdana"><strong>3.3. Correction of intersections, overlaps    and discontinuities </strong></font>      <P><font size="2" face="Verdana">
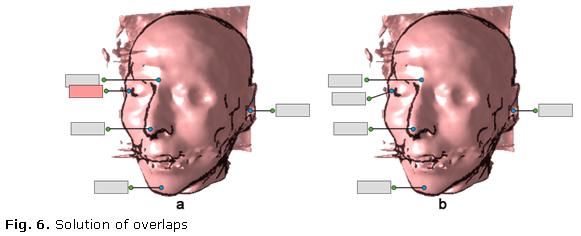
At this point the labels are ordered by its <em><strong>y</strong></em>    coordinate, we also know the height of the text boxes and if they belong to    the left or right of the image. To represent the labels only need to compare    the position of the current label with its predecessor, according to whether    they belong to the left or right. In case of overlap (<a href="/img/revistas/rcim/v8n1/f0601116.jpg">Fig.    6a</a>) the current label is moved to the position determined by the end of    the previous label plus a delta for separation. The end result is shown in <a href="/img/revistas/rcim/v8n1/f0601116.jpg">Fig.    6b</a>. </font>      <P><font size="2" face="Verdana">As the labels are ordered and their final positions    are dynamically updated, no intersections occur during rendering. During the    interaction, the algorithm behaves stably due to the proximity of the labels    with their anchor points and the adaptability to the image silhouette. The discontinuities    only occur when exists overlaps or the end positions change of side (left or    right), in both cases only the involved labels are affected. </font>      <P><font size="2" face="Verdana"><strong>3.4. Implementation details </strong></font>      <P><font size="2" face="Verdana">Although the proposed algorithm can be implemented    using any programming language and graphics library, the authors recommend the    use of C++ as programming language and the industry standard OpenGL as graphics    library, the selection of these technologies favors the need for performance    and portability. </font>      <P> <font size="2" face="Verdana">The algorithm was integrated for this publication    with the software Vismedic-Illustration, which also uses Qt framework for the    graphical user interface and GLSL as shading language for the visualization    algorithm.</font>     <P>&nbsp;     <P><font size="3" face="Verdana"><strong>RERULTS AND DISCUSSION</strong> </font>      ]]></body>
<body><![CDATA[<P><font size="2" face="Verdana">Among the main advantages of the proposed algorithm    are its ability to label volumes of any kind (as shown in <a href="/img/revistas/rcim/v8n1/f0701116.jpg">Fig.    7</a>), not needing to compute the convex hull of the image, its simplicity    of implementation and the performance to calculate the label layout. </font>      <P><font size="2" face="Verdana"><a href="#tab1">Table 1</a> shows the results    obtained by the proposed algorithm on medium size datasets. The tests environment    consisted of a personal computer with an Intel Core i3 2120 processor, NVidia    GeForce GTX 285 as GPU, 4GB of RAM DDR3, at a resolution of 800x600 pixels.    The render algorithm was a GPU based Raycasting implementation for all the images.    The used volumes are employed repeatedly in the literature to check the results    of the volume visualization algorithms, except for the chemical structure of    Menthol, which was obtained for this work using a voxelization from the 3D chemical    structure of its molecule. </font>      <P>      <P align="center"><img src="/img/revistas/rcim/v8n1/t0101116.gif" width="526" height="197"> <a name="tab1"></a>     <P><font size="2" face="Verdana">As shown in <a href="#tab1">Table 1</a>, the    display performance for datasets of about 2563 is not significantly affected    for a practical number of labels, it was kept in real time for all cases (about    60 frames per second) after the activation of the labeling algorithm. </font>      <P><font size="2" face="Verdana">The key to reduce the computational cost was    the use of the pixel lines of the labels. For example, to compute the convex    hull of a RGBA image of 8-bits and 800x600 pixels with 10 labels need to traverse    480000 pixels (1920000 bytes), however, using the proposed algorithm is only    necessary to go through 8000 (32000 bytes), which represent the 1.66% of the    total pixels in the image. </font>     <P>&nbsp;     <P><font size="3" face="Verdana"><strong>CONCLUSIONS</strong></font>     <P><font size="2" face="Verdana">This paper presents a new algorithm for the placement    of external labels for DVR. The proposed algorithm works in image space, using    only the rows of pixels corresponding to the labels anchor points, which optimizes    the performance and facilitates the algorithm implementation, because it does    not need to calculate the convex hull of the generated image. Both, the overall    visualization performance and the cost of the proposed algorithm are kept in    real-time (60 fps) for medium size volumes (about 2563 voxels), which ensures    interaction during visualization. </font>     <P>&nbsp;     ]]></body>
<body><![CDATA[<P><font size="3" face="Verdana"><strong>REFERENCES </strong></font>     <!-- ref --><P><font size="2" face="Verdana">1. Oeltze S. and Preim, B. Survey of Labeling    Techniques in Medical Visualizations. 2014. Eurographics Workshop on Visual    Computing for Biology and Medicine.     </font>      <!-- ref --><P><font size="2" face="Verdana">2. Preim B, Ritter Alf, Strothotte T. Consistency    of Rendered Images and Their Textual Labels. 1995. Proc. of CompuGraphics. Vol.    95, pp. 201-210.     </font>      <!-- ref --><P><font size="2" face="Verdana">3. Levoy M. Display of surfaces from volume data.    IEEE, 1988, Computer Graphics and Applications, IEEE, Vol. 8, pp. 29-37.     </font>      <!-- ref --><P><font size="2" face="Verdana">4. Drebin RA, Carpenter L, Hanrahan P. Volume    rendering. 1988. ACM Siggraph Computer Graphics. Vol. 22, pp. 65-74.     </font>      <!-- ref --><P><font size="2" face="Verdana">5. Preim B, Charl P. Visual Computing for Medicine:    Theory, Algorithms, and Applications. Morgan Kauffman, 2013.     </font>      <!-- ref --><P><font size="2" face="Verdana">6. Ali K, Hartmann K, Strothotte T. Label layout    for interactive 3D illustrations. V&aacute;clav Skala-UNION Agency, 2005.     </font>      <!-- ref --><P> <font size="2" face="Verdana">7. Hartmann K, G&ouml;tzelmann T, Ali K, Strothotte    T. Metrics for functional and aesthetic label layouts. 2005. Smart Graphics.    pp. 115-126.     </font>      <!-- ref --><P><font size="2" face="Verdana">8. Vollick I, Vogel D, Agrawala M, Hertzmann    A. Specifying label layout style by example. 2007. Proceedings of the 20th annual    ACM symposium on User interface software and technology. pp. 221-230.     </font>      <!-- ref --><P><font size="2" face="Verdana">9. Hartmann K, Ali K, and Strothotte T. Floating    labels: Applying dynamic potential fields for label layout. 2004. Smart Graphics.    pp. 101-113.     </font>      <!-- ref --><P><font size="2" face="Verdana">10. Cmol&iacute;k L, Bittner J. Layout-aware    optimization for interactive labeling of 3D models Elsevier, 2010. Computers    &amp; Graphics, Vol. 34, pp. 378-387.     </font>      <!-- ref --><P><font size="2" face="Verdana">11. Bekos MA, Kaufmann M, Symvonis A, Wolff A.    Boundary labeling: Models and efficient algorithms for rectangular maps. 2005.    Graph Drawing. pp. 49-59.     </font>      <!-- ref --><P><font size="2" face="Verdana">12. G&ouml;tzelmann T, Ali K, Hartmann K, Strothotte    T. Form Follows Function: Aesthetic Interactive Labels. Computational aesthetics.    2005. Vol. 5.     </font>      <!-- ref --><P><font size="2" face="Verdana">13. Stein T, D&eacute;coret X. Dynamic label    placement for improved interactive exploration. 2008. Proceedings of the 6th    international symposium on Non-photorealistic animation and rendering. pp. 15-21.        </font>      <!-- ref --><P><font size="2" face="Verdana">14. G&ouml;tzelmann T, Ali K, Hartmann K, Strothotte    T. Adaptive labeling for illustrations. 2005. Proc. of 13th Pacific Conference    on Computer Graphics and Applications, S. pp. 64-66.     </font>      <!-- ref --><P><font size="2" face="Verdana">15. Ropinski T, Pra&szlig;ni JS, Roters J, Hinrichs    K. Internal Labels as Shape Cues for Medical Illustration. VMV. 2007. Vol. 7,    pp. 203-212.     </font>      <!-- ref --><P><font size="2" face="Verdana">16. Preim B, Raab A, Strothotte T. Coherent zooming    of illustrations with 3D-graphics and text. Graphics Interface. 1997. Vol. 97,    pp. 105-113.     </font>      <!-- ref --><P><font size="2" face="Verdana">17. G&ouml;tzelmann T, Hartmann K, Strothotte    T. Contextual Grouping of Labels. 2006. SimVis. pp. 245-258.     </font>      <!-- ref --><P><font size="2" face="Verdana">18. Bruckner S, Gr&ouml;ller ME. VolumeShop:    An Interactive System for Direct Volume Illustration. 2005. Proceedings of IEEE    Visualization. 2005. pp. 671-678. ISBN: 0780394623.     </font>      <P>&nbsp;     <P>&nbsp;     <P><font size="2" face="Verdana">Recibido: 25 de noviembre de 2015.    ]]></body>
<body><![CDATA[<br>   Aprobado: 9 de marzo de 2016.</font>       ]]></body><back>
<ref-list>
<ref id="B1">
<label>1</label><nlm-citation citation-type="">
<person-group person-group-type="author">
<name>
<surname><![CDATA[Oeltze]]></surname>
<given-names><![CDATA[S]]></given-names>
</name>
<name>
<surname><![CDATA[Preim]]></surname>
<given-names><![CDATA[B]]></given-names>
</name>
</person-group>
<source><![CDATA[Survey of Labeling Techniques in Medical Visualizations. 2014. Eurographics Workshop on Visual Computing for Biology and Medicine]]></source>
<year></year>
</nlm-citation>
</ref>
<ref id="B2">
<label>2</label><nlm-citation citation-type="journal">
<person-group person-group-type="author">
<name>
<surname><![CDATA[Preim]]></surname>
<given-names><![CDATA[B]]></given-names>
</name>
<name>
<surname><![CDATA[Ritter]]></surname>
<given-names><![CDATA[Alf]]></given-names>
</name>
<name>
<surname><![CDATA[Strothotte]]></surname>
<given-names><![CDATA[T]]></given-names>
</name>
</person-group>
<article-title xml:lang="en"><![CDATA[Consistency of Rendered Images and Their Textual Labels]]></article-title>
<source><![CDATA[Proc. of CompuGraphics]]></source>
<year></year>
<volume>95</volume>
<page-range>201-210</page-range></nlm-citation>
</ref>
<ref id="B3">
<label>3</label><nlm-citation citation-type="journal">
<person-group person-group-type="author">
<name>
<surname><![CDATA[Levoy]]></surname>
<given-names><![CDATA[M]]></given-names>
</name>
</person-group>
<article-title xml:lang="en"><![CDATA[Display of surfaces from volume data.]]></article-title>
<source><![CDATA[Computer Graphics and Applications]]></source>
<year></year>
<volume>8</volume>
<page-range>29-37</page-range></nlm-citation>
</ref>
<ref id="B4">
<label>4</label><nlm-citation citation-type="journal">
<person-group person-group-type="author">
<name>
<surname><![CDATA[Drebin]]></surname>
<given-names><![CDATA[RA]]></given-names>
</name>
<name>
<surname><![CDATA[Carpenter]]></surname>
<given-names><![CDATA[L]]></given-names>
</name>
<name>
<surname><![CDATA[Hanrahan]]></surname>
<given-names><![CDATA[P]]></given-names>
</name>
</person-group>
<article-title xml:lang="en"><![CDATA[Volume rendering]]></article-title>
<source><![CDATA[ACM Siggraph Computer Graphics]]></source>
<year></year>
<volume>22</volume>
<page-range>65-74</page-range></nlm-citation>
</ref>
<ref id="B5">
<label>5</label><nlm-citation citation-type="book">
<person-group person-group-type="author">
<name>
<surname><![CDATA[Preim]]></surname>
<given-names><![CDATA[B]]></given-names>
</name>
<name>
<surname><![CDATA[Charl]]></surname>
<given-names><![CDATA[P]]></given-names>
</name>
</person-group>
<source><![CDATA[Visual Computing for Medicine: Theory, Algorithms, and Applications]]></source>
<year>2013</year>
<publisher-name><![CDATA[Morgan Kauffman]]></publisher-name>
</nlm-citation>
</ref>
<ref id="B6">
<label>6</label><nlm-citation citation-type="book">
<person-group person-group-type="author">
<name>
<surname><![CDATA[Ali]]></surname>
<given-names><![CDATA[K]]></given-names>
</name>
<name>
<surname><![CDATA[Hartmann]]></surname>
<given-names><![CDATA[K]]></given-names>
</name>
<name>
<surname><![CDATA[Strothotte]]></surname>
<given-names><![CDATA[T]]></given-names>
</name>
</person-group>
<source><![CDATA[Label layout for interactive 3D illustrations]]></source>
<year>2005</year>
<publisher-name><![CDATA[Václav Skala-UNION Agency]]></publisher-name>
</nlm-citation>
</ref>
<ref id="B7">
<label>7</label><nlm-citation citation-type="book">
<person-group person-group-type="author">
<name>
<surname><![CDATA[Hartmann]]></surname>
<given-names><![CDATA[K]]></given-names>
</name>
<name>
<surname><![CDATA[Götzelmann]]></surname>
<given-names><![CDATA[T]]></given-names>
</name>
<name>
<surname><![CDATA[Ali]]></surname>
<given-names><![CDATA[K]]></given-names>
</name>
<name>
<surname><![CDATA[Strothotte]]></surname>
<given-names><![CDATA[T]]></given-names>
</name>
</person-group>
<source><![CDATA[Metrics for functional and aesthetic label layouts]]></source>
<year>2005</year>
<page-range>115-126</page-range><publisher-name><![CDATA[Smart Graphics]]></publisher-name>
</nlm-citation>
</ref>
<ref id="B8">
<label>8</label><nlm-citation citation-type="confpro">
<person-group person-group-type="author">
<name>
<surname><![CDATA[Vollick]]></surname>
<given-names><![CDATA[I]]></given-names>
</name>
<name>
<surname><![CDATA[Vogel]]></surname>
<given-names><![CDATA[D]]></given-names>
</name>
<name>
<surname><![CDATA[Agrawala]]></surname>
<given-names><![CDATA[M]]></given-names>
</name>
<name>
<surname><![CDATA[Hertzmann]]></surname>
<given-names><![CDATA[A]]></given-names>
</name>
</person-group>
<source><![CDATA[Specifying label layout style by example]]></source>
<year>2007</year>
<conf-name><![CDATA[ Proceedings of the 20th annual ACM symposium on User interface software and technology]]></conf-name>
<conf-loc> </conf-loc>
<page-range>221-230</page-range></nlm-citation>
</ref>
<ref id="B9">
<label>9</label><nlm-citation citation-type="book">
<person-group person-group-type="author">
<name>
<surname><![CDATA[Hartmann]]></surname>
<given-names><![CDATA[K]]></given-names>
</name>
<name>
<surname><![CDATA[Ali]]></surname>
<given-names><![CDATA[K]]></given-names>
</name>
<name>
<surname><![CDATA[Strothotte]]></surname>
<given-names><![CDATA[T]]></given-names>
</name>
</person-group>
<source><![CDATA[Floating labels: Applying dynamic potential fields for label layout]]></source>
<year>2004</year>
<page-range>101-113</page-range><publisher-name><![CDATA[Smart Graphics]]></publisher-name>
</nlm-citation>
</ref>
<ref id="B10">
<label>10</label><nlm-citation citation-type="journal">
<person-group person-group-type="author">
<name>
<surname><![CDATA[Cmolík]]></surname>
<given-names><![CDATA[L]]></given-names>
</name>
<name>
<surname><![CDATA[Bittner]]></surname>
<given-names><![CDATA[J]]></given-names>
</name>
</person-group>
<article-title xml:lang="en"><![CDATA[Layout-aware optimization for interactive labeling of 3D models Elsevier, 2010]]></article-title>
<source><![CDATA[Computers & Graphics]]></source>
<year></year>
<volume>34</volume>
<page-range>378-387</page-range></nlm-citation>
</ref>
<ref id="B11">
<label>11</label><nlm-citation citation-type="book">
<person-group person-group-type="author">
<name>
<surname><![CDATA[Bekos]]></surname>
<given-names><![CDATA[MA]]></given-names>
</name>
<name>
<surname><![CDATA[Kaufmann]]></surname>
<given-names><![CDATA[M]]></given-names>
</name>
<name>
<surname><![CDATA[Symvonis]]></surname>
<given-names><![CDATA[A]]></given-names>
</name>
<name>
<surname><![CDATA[Wolff]]></surname>
<given-names><![CDATA[A]]></given-names>
</name>
</person-group>
<source><![CDATA[Boundary labeling: Models and efficient algorithms for rectangular maps]]></source>
<year>2005</year>
<page-range>49-59</page-range><publisher-name><![CDATA[Graph Drawing]]></publisher-name>
</nlm-citation>
</ref>
<ref id="B12">
<label>12</label><nlm-citation citation-type="journal">
<person-group person-group-type="author">
<name>
<surname><![CDATA[Götzelmann]]></surname>
<given-names><![CDATA[T]]></given-names>
</name>
<name>
<surname><![CDATA[Ali]]></surname>
<given-names><![CDATA[K]]></given-names>
</name>
<name>
<surname><![CDATA[Hartmann]]></surname>
<given-names><![CDATA[K]]></given-names>
</name>
<name>
<surname><![CDATA[Strothotte]]></surname>
<given-names><![CDATA[T]]></given-names>
</name>
</person-group>
<article-title xml:lang="en"><![CDATA[Form Follows Function: Aesthetic Interactive Labels]]></article-title>
<source><![CDATA[Computational aesthetics]]></source>
<year>2005</year>
<volume>5</volume>
</nlm-citation>
</ref>
<ref id="B13">
<label>13</label><nlm-citation citation-type="confpro">
<person-group person-group-type="author">
<name>
<surname><![CDATA[Stein]]></surname>
<given-names><![CDATA[T]]></given-names>
</name>
<name>
<surname><![CDATA[Décoret]]></surname>
<given-names><![CDATA[X]]></given-names>
</name>
</person-group>
<source><![CDATA[Dynamic label placement for improved interactive exploration]]></source>
<year>2008</year>
<conf-name><![CDATA[ Proceedings of the 6th international symposium on Non-photorealistic animation and rendering]]></conf-name>
<conf-loc> </conf-loc>
<page-range>15-21</page-range></nlm-citation>
</ref>
<ref id="B14">
<label>14</label><nlm-citation citation-type="confpro">
<person-group person-group-type="author">
<name>
<surname><![CDATA[Götzelmann]]></surname>
<given-names><![CDATA[T]]></given-names>
</name>
<name>
<surname><![CDATA[Ali]]></surname>
<given-names><![CDATA[K]]></given-names>
</name>
<name>
<surname><![CDATA[Hartmann]]></surname>
<given-names><![CDATA[K]]></given-names>
</name>
<name>
<surname><![CDATA[Strothotte]]></surname>
<given-names><![CDATA[T]]></given-names>
</name>
</person-group>
<source><![CDATA[Adaptive labeling for illustrations]]></source>
<year>2005</year>
<conf-name><![CDATA[ Proc. of 13th Pacific Conference on Computer Graphics and Applications, S]]></conf-name>
<conf-loc> </conf-loc>
<page-range>64-66</page-range></nlm-citation>
</ref>
<ref id="B15">
<label>15</label><nlm-citation citation-type="journal">
<person-group person-group-type="author">
<name>
<surname><![CDATA[Ropinski]]></surname>
<given-names><![CDATA[T]]></given-names>
</name>
<name>
<surname><![CDATA[Praßni]]></surname>
<given-names><![CDATA[JS]]></given-names>
</name>
<name>
<surname><![CDATA[Roters]]></surname>
<given-names><![CDATA[J]]></given-names>
</name>
<name>
<surname><![CDATA[Hinrichs]]></surname>
<given-names><![CDATA[K]]></given-names>
</name>
</person-group>
<article-title xml:lang="en"><![CDATA[Internal Labels as Shape Cues for Medical Illustration]]></article-title>
<source><![CDATA[VMV]]></source>
<year>2007</year>
<volume>7</volume>
<page-range>203-212</page-range></nlm-citation>
</ref>
<ref id="B16">
<label>16</label><nlm-citation citation-type="journal">
<person-group person-group-type="author">
<name>
<surname><![CDATA[Preim]]></surname>
<given-names><![CDATA[B]]></given-names>
</name>
<name>
<surname><![CDATA[Raab]]></surname>
<given-names><![CDATA[A]]></given-names>
</name>
<name>
<surname><![CDATA[Strothotte]]></surname>
<given-names><![CDATA[T]]></given-names>
</name>
</person-group>
<article-title xml:lang="en"><![CDATA[Coherent zooming of illustrations with 3D-graphics and text]]></article-title>
<source><![CDATA[Graphics Interface]]></source>
<year>1997</year>
<volume>97</volume>
<page-range>105-113</page-range></nlm-citation>
</ref>
<ref id="B17">
<label>17</label><nlm-citation citation-type="">
<person-group person-group-type="author">
<name>
<surname><![CDATA[Götzelmann]]></surname>
<given-names><![CDATA[T]]></given-names>
</name>
<name>
<surname><![CDATA[Hartmann]]></surname>
<given-names><![CDATA[K]]></given-names>
</name>
<name>
<surname><![CDATA[Strothotte]]></surname>
<given-names><![CDATA[T]]></given-names>
</name>
</person-group>
<source><![CDATA[Contextual Grouping of Labels]]></source>
<year>2006</year>
<page-range>245-258</page-range></nlm-citation>
</ref>
<ref id="B18">
<label>18</label><nlm-citation citation-type="journal">
<person-group person-group-type="author">
<name>
<surname><![CDATA[Bruckner]]></surname>
<given-names><![CDATA[S]]></given-names>
</name>
<name>
<surname><![CDATA[Gröller]]></surname>
<given-names><![CDATA[ME]]></given-names>
</name>
</person-group>
<article-title xml:lang="en"><![CDATA[VolumeShop: An Interactive System for Direct Volume Illustration]]></article-title>
<source><![CDATA[Proceedings of IEEE Visualization]]></source>
<year>2005</year>
<page-range>671-678</page-range></nlm-citation>
</ref>
</ref-list>
</back>
</article>
