Multivariate analysis of performance and emissions for internal combustion engines running with gasoline-ethanol blends
Análisis multivariable del desempeño y las emisiones en motores de combustión interna que utilizan mezclas de gasolina y etanol
Dr. C. Juan Miguel Mantilla González, Dr. C. Diego Alexander Garzón Alvarado y Carlos Humberto Galeano Urueña
Universidad Nacional de Colombia, Bogotá, Colombia.
]]>
ABSTRACT
Recent years have shown an increasing interest in ethanol blending to gasoline fuel, as well as a rapid implementation of this kind of biofuels in countries like Colombia. Taking into account the lack of studies about performance and emissions characteristics for the local engines, and the fact that new biofuels policies are emerging using studies made for non-local conditions, a study is proposed in order to verify the real changes in those characteristics into the Colombian conditions. This article presents a performance and emission analysis when different independent variables act on two engines working with gasoline-ethanol blends up to 30 % of the latter. A set of dependent variables are introduced in order to verify the real statistical influence of independent variables. Results confirm trends reported by other authors; nevertheless, these tendencies are not always statistical representative, like in the case of ethanol concentration influence on combustion duration.
Key words: biofuel, emissions,gasoline-ethanol, internal combustion engine, performance, statistical analysis.
RESUMEN
Los últimos años han mostrado un creciente interés en la mezcla gasolina-alcohol, así como una rápida implementación de este tipo de biocombustible en países como Colombia. Tomando en cuenta la falta de estudios sobre desempeño y emisiones para los motores locales, y el surgimiento de nuevas políticas utilizando como soporte estudios realizados en otros países, se propone verificar los cambios reales sobre esas características para las condiciones Colombianas. Este artículo presenta un análisis de desempeño y emisiones cuando diferentes variables independientes actúan sobre dos motores de combustión interna que trabajan con gasolina-etanol, con hasta 30 % en volumen de este último.Un grupo de variables dependientes es introducido para verificar la verdadera significancia estadística sobre las variables independientes. Los resultados confirman las tendencias reportadas por otros autores; sin embargo, estas tendencias no son siempre estadísticamente representativas, como el caso de la influencia de la concentración de etanol sobre la duración de la combustión.
Palabras clave: análisis estadístico, biocombustible, desempeño, emisiones, gasolina-etanol, motor de combustión interna.
]]> INTRODUCCIÓN
Gasoline-ethanol blends have been of interest since energy crisis in the 70’s, caused by OPEC (Organization of the Petroleum Exporting Countries) oil embargo [1; 2]. In countries like Brazil, mixtures of gasoline and ethanol from sugarcane were implemented since mid 70’s [3], as a way of agricultural industry enforcement and a strategy for pollutant emission reduce. In United States and Canada, use of gasoline-ethanol blends or pure ethanol has had a slow implementation [2].
This is because ethanol production and commercialization requires projects with high investments and, in some cases, negative return rates [4; 5]. That is why the governments, through subsidy or tax reduction, must help in the purpose of biofuel accomplishment, together with a long term policy [5]. In Colombia gasoline-ethanol mixtures have been implemented gradually since 2006. As today, the whole country is using E8 (92 % gasoline and 8 % ethanol in volume).Documented tests in [5] show that power and torque does not decrease when gasoline-ethanol fuels are used, in spite of the smaller Lower Heating Value (LHV) of it, in contrast to pure gasoline. In fact, an increase in fuel consumption is expected [6], as well as a raise in engine’s thermal efficiency [7]. Research Octane Number, heat of vaporization and autoignition temperature also augment with higher ethanol concentration in fuel [5;7]. Reid Vapor Pressure is bigger for ethanol compared to gasoline [7]. But in blends, their value is influenced by gasoline quality, i.e how much butane it has and what are the T50 and T90 distillation temperatures (temperatures in which 50 % and 90% of fuel have been evaporated) [8]. Combustion in general is improved by gasoline-ethanol blend use as a fuel in engines, when is compared to gasoline fuel only. The best way to see this is through carbon monoxide (CO) and total hydrocarbon emissions (THC), which decrease, 10 % to 40 % for CO [7;8] and 5 % to 20 % for THC [7; 9], as ethanol concentration in the fuel increase. Opposed to that behaviorare aldehyde emissions with 5% to 200% [10;11] increase. In relationto emissionssuch asNOx,in the literatureconflicting results are reported. Whilesome suggestits reduction[12; 13] and the others an increment [7;9;14]; a third group[15] mention thedifficulty of predictinga trendfor this issuemainly because theyhave notfound a linkbetween thefuelandthe main parameters ofengine operation.This complicates the processof comparison between different technologies for fuel flow control. These authorsalso indicatethat the comparisonis difficultbecauseNOxproduction canbe linkeddirectly to theengine operatingcondition.
As it can be seen in [14] and from this short literature review, that performance and emissions are affected by many factors. Taking into account that in Bogotá, Colombia´s biggest city, the vehicles with spark ignited internal combustion engines are 92 % of the total vehicle inventory, andfrom that only 34 % are engines made after 2008 [16], an experimental study is necessary including different types of engines. For this research two engines were selected: a single cylinder CFR engine with a special high swirl combustion chamber, and a four-cylinder commercial engine with flat piston and hemispherical head combustion chamber. On the other hand, according to a recent Colombian law [17], since 2013 the use of gasoline-ethanol fuel mixtures in percentages bigger than 10% of the latter is encouraged.To include all of these aspects, in this work a multivariate study was made overthedescribed engines, to analyze real statistical influence on torque, maximum pressure, thermal efficiency, combustion duration, exhaust temperature and regulated emissions when changes in ethanol concentration in the fuel, compression ratio, spark timing, crankshaft velocity and equivalence ratio are entered. The results will be a good experimental resource to policy makers and researchers on what to expect for performance and emissions when changes in the considered variables are applied. This manuscript contains contributions to the body of knowledge not only for a local interest, but holds contributions in terms of new data and a new way of presenting results. The paper starts with the experimental set-up and testing procedure. It continues with the statistical analysis outcome, followed by results exposition. Finally, conclusions are drawn.
EXPERIMENTAL SET-UP
An experiment design was conducted where different levels for fuel, compression ratio (CR), fuel-air equivalence ratio (Φ), spark timing (ST) and crankshaft velocity (speed) were included. The controllable (independent) variables and its levels are presented in table 1., table 2 and table 3 show the final experimental design. The valuesof Φfor lean condition are grouped as 0,9 for engine No. 1 in table 1, in table 2, the real values are shown. Tests for E0 and E10 on CR greater than 8,8 were not feasible due to severe engine knock. Tests for ethanol volume bigger than 10% for engine No. 2, were not possible because of over heating of exhaust manifold and cylinder heads. The output variables were exhaust gas temperature, combustion chamber pressure and brake torque. Three hundred and eight tests were run, with three repetitions per test. For example, in table 2, one test is composed of independent variables: fuel (E10), equivalence ratio (0,96), compression ratio (7,7) and spark timing (10 degrees BTDC).
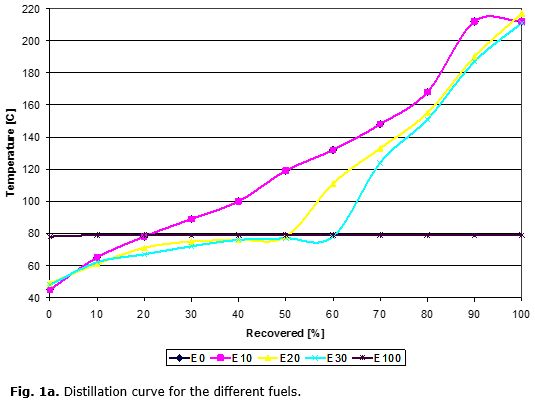
The engines and fuels used are described in table 4 and table 5. Fuel analysis was performed at the fuels laboratory of the National University of Colombia. Figure 1a, shows distillation curves for the fuels.
]]>
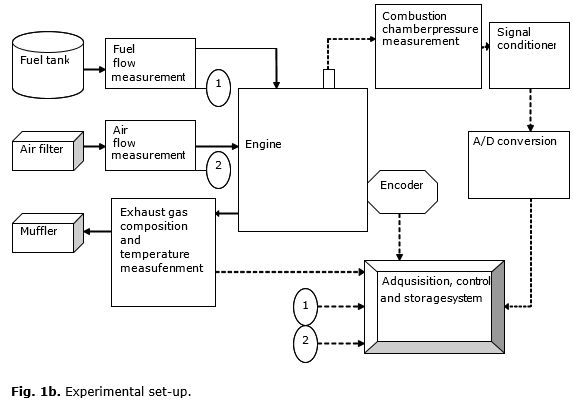
A MoTeC 3.41G2 Engine Control Unit (ECU) was used to manage fuel injection and spark timing. Combustion chamber pressure was measured with a Kistler 6125B pressure transducer, every 1/10 crank angle. Fuel flow was assessed with a scale +/- 0.4% accuracy. A Meriam 50MC2-2 laminar flow elements sensor was used for air flow measurement. Exhaust temperature evaluation was accomplished with an Omega K thermocouple +/-0.01C accuracy. Figure 1 (b), shows experimental set-up.
Exhaust gases were measureddirectly with a stainless steel probe located between exhaust manifold and muffler, and followed by a water trap and a moisture removal membrane.Theflue gas composition was measured with continuous emission gas monitors, listed next:
• Rosemount Analytical Model 755R (± 0,1 %)
• Rosemount Analytical Model 880 (± 0,05 %)
• Rosemount Analytical Model 880 (± 0,01 %)
• Rosemount Analytical Model 955 (±1 % Full Scale)
• Heated FID J.U.M. Engineering (± 10 ppm)
]]> • Beckman Industrial Model 400A Flame Ionization Detector (± 1 PPM)
DISCUSIÓN
STATISTICAL ANALYSIS
After running all the tests in the engines, collected data is analyzed in order to obtain the statistical significance of every dependent variable as a function of independent ones. To accomplish this, first homoscedasticity is checked. To do that, archtest Matlab function is used, which executes Engle’s Autoregresive Conditional Heteroscedasticity. This test use dependent variable residuals from lineal regression, and as a result gives a Boolean variable accepting or denying the null hypothesis of data homoscedasticity. Results show that for all dependent variables homoscedasticity exists [18]. After completing previous step, an analysis of variance (ANOVA) 2 x 2 is made using variable grouping of table 6, and table 7, for every engine. All the possibilities for independent variable grouping are considered.
In table 6, and table 7, dependent variables are also shown, which were obtained from experiments. ANOVA 2 x 2 was conducted on dependent variables to determine if the differences with the changeofevery independent variable were significant at a 95 % confidence level [19].The summarized results are shown in table 8, table 9 and table 10. In these three Tablessymbol I means that changes in independent variables give statistically significant differences for dependent variables; symbol X means the opposite to that. For example, in table 8 Torque is modified, with a confidence of 95 %, when spark timing and compression ratio change, but unmodified for changes in phi and fuel composition. To summarize, for constant speed, as in the case of table 8 on engine No.1, equivalence ratio and fuel do not influence torque, HC and CO2 emissions. Also fuel does not influence combustion duration, exhaust temperature and CO emission. CO2 emission is not statistically different when compression ratio changes. Constant speed for engine No. 2 (table 10) shows that differences in every independent variable do not represent a statistically meaningful change in dependent variables. Table 9 presents a scenario where differences for every dependent variable were statistically significant to changes in independent variables.
Gaseous emissions were measured at Maximum Brake Torque (MBT) only in engine No. 1. That is why in table 8 the values for ST are empty.
]]>
RESULTS
Complementing the results from the statistical analysis (table 8, table 9 and table 10), the effect of every independent variable on the dependent ones is analyzed in this section. Due to the fact that compression ratio, spark timing, equivalence ratio and fuel composition are the independent variables (controllable variables), when we analyze the influence of one independent variable over the dependent ones, all levels of the other independent variables are considered in the figures and tables. Only the results for dependent variables that are statistically meaningful are described in the summary tables (table 11, 12, 13, 14 and 15).
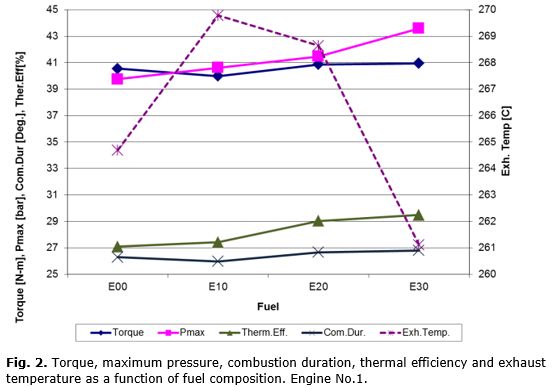
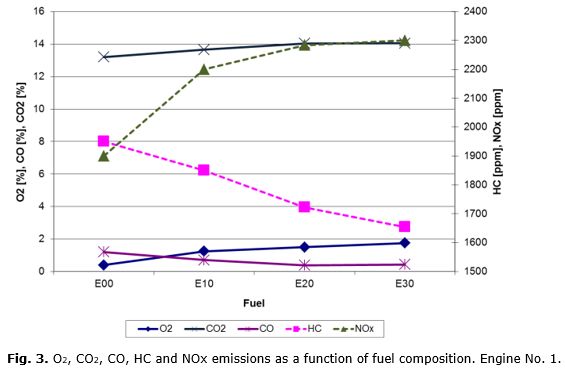
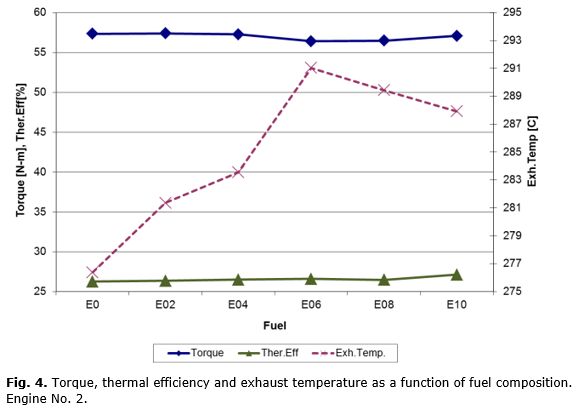
Ethanol concentration in the fuel: For engine No. 1 (figure 2 and figure 3), it can be seen that ethanol concentration increases thermal efficiency, maximum pressure, O2 and NOx emissions; while torque remains almost constant with no statistically significant differences as well as combustion duration and exhaust temperature. In figure 4 and figure 5, for engine No. 2, torque, CO, HC and NOx emissions are decreased whereas thermal efficiency and exhaust temperature increase. Table 11 presents these changes as percentage when results for several fuel compositions are compared to the ones for E0.
]]>
In general combustion is improved when ethanol is use as a blending agent into gasolinedue to a combination of factors like a bigger oxygen concentration in its molecular structure and higher heat of vaporization [7].These factors promote better thermal efficiency through increased combustion efficiency and greater volumetric efficiency. Another factor influencing this enhancing in thermal efficiency is the use of bigger compression ratios as ethanol concentration in the fuel increases (table 2). This fact is inducing the growing in maximum pressure as ethanol concentration becomes larger.
It is clear from table 8 that at constant rpm and torque (engine No.1), exhaust temperature, HC and CO emissions were not influenced by fuel composition, but the trend is also to lower these values as ethanol increases [20] Oxygen (O2) emission increased with greater ethanol concentration.
In engine No. 2 exhaust temperature and thermal efficiency increased. Combustion again is improved, CO and HC emissions are reduced, because of the factors discussed for engine No.1, plus a benefit that comes from the bigger flame speed of the ethanol mixture, which assists to complete combustion process at different crankshaft speeds [21].
There is a big difference between engine No. 1 and engine No.2 concerning NOx emissions trend. In engine No. 1 NOx increased as ethanol concentration is bigger, while exhaust temperature, torque and combustion duration show no statistically meaningful changes. This is caused by the greater compression ratios, as explain previously, and an increase in combustion efficiency associated with more ethanol in the mixture [22]. In engine No. 2 torque decreases as well as NOx emissions with increasing ethanol concentration in the fuel, due to a combined effect of higher latent heat of vaporization and small Low Heating Value of ethanol, just as explained in [23].
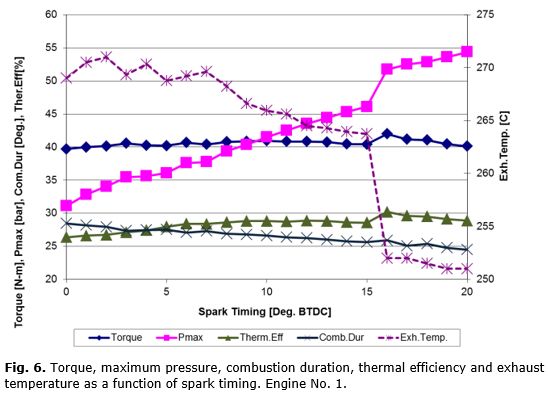
Spark timing: Figure 6, presents a small variation for torque, an increase in maximum pressure, thermal efficiency and a decrease in exhaust temperature and combustion duration. Table 12, presents these changes as percentage when results for two spark timings are compared to the ones for 0 DBTDC.
These behaviors can be described using table 2. It is seen in this Table that as ethanol content increases, the tests were made via bigger advances in spark timing. This must be done because engine could not run smoothly for spark angles near TDC with ethanol. That tendency is caused by the higher autoignition temperature of ethanol, which requires more time to ignite despite of higher laminar speed of ethanol flames (combustion duration is decreased in (table 12). So, at elevated spark timing there’s more ethanol in the fuel and bigger compression ratios (table 2).
Despite the greater compression ratio and smaller combustion duration with advanced spark timing (table 12), exhaust temperature decreases because of a combined effect of the reduction of adiabatic flame temperature as ethanol concentration increases [24] and bigger expansion ratios as more ethanol is used for larger spark advances [25].
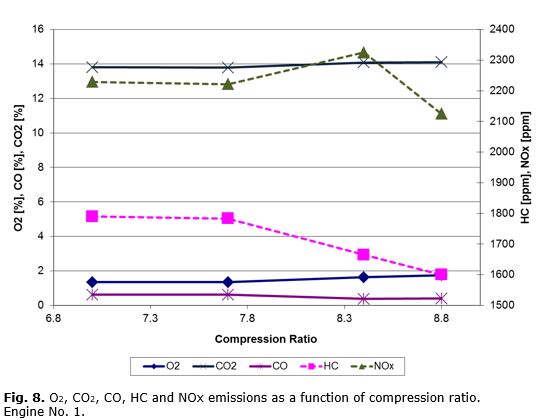
Compression ratio: For engine No.1 (figure 7 and figure 8) it can be seen that torque, maximum pressure, thermal efficiency, O2 and NOx emissions increase; exhaust temperature, combustion duration, HC and CO emissions decrease. Table 13, presents these changes as percentage when results for three compression ratios are compared to the ones for a compression ratio of 7.
]]>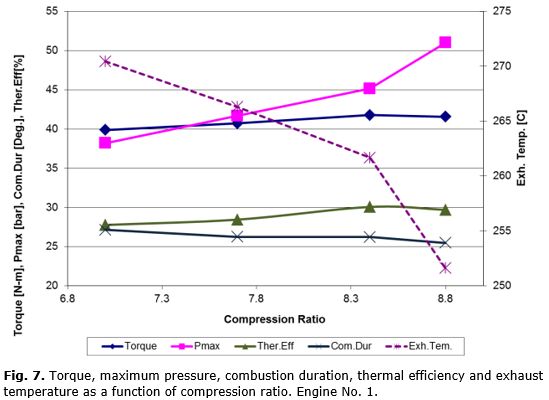
In table 2, it is seen that bigger compression ratios are reached with more ethanol in the mixture. Thus maximum pressure increases with greater compression ratios. Combustion is improved as HC and CO emissions are reduced and thermal efficiency increased due to higher laminar flame speed, explained by the results of the combustion duration variable. As explain before, exhaust temperature decreased due to a combined effect of smaller adiabatic flame temperature and bigger expansion ratios as increasing ethanol concentrations within the mixture.
Nitrogen Oxides (NOx) emission presents again a behavior briefly described previously. It is seen in table 13 that this emission is influenced more by the changes in torque than any other variable [9].
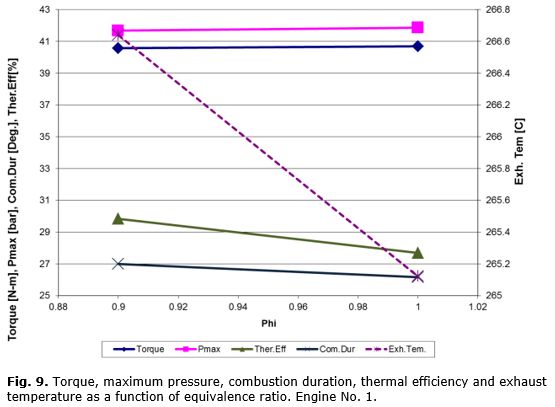
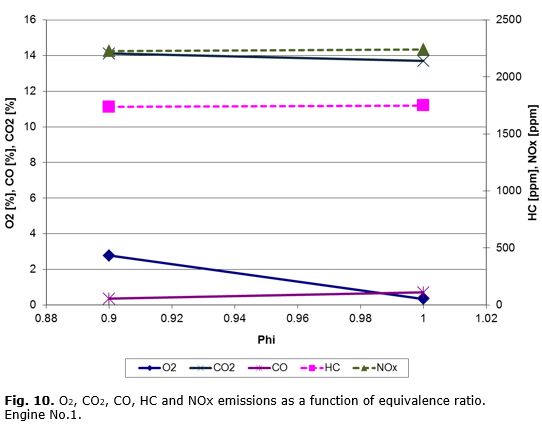
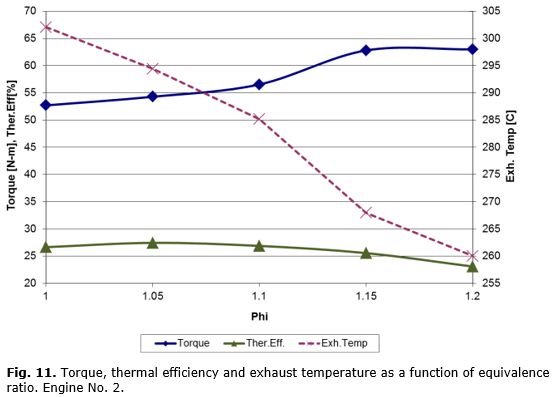
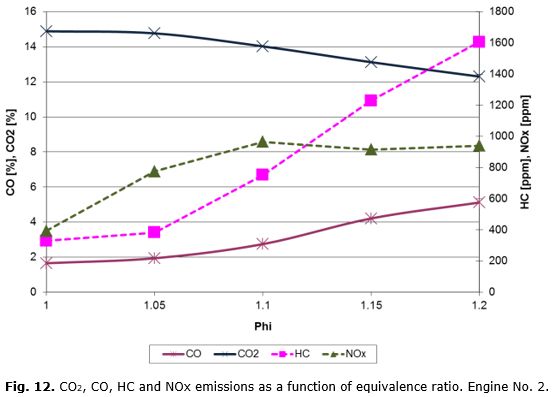
Fuel-air equivalence ratio: Engine No. 1 (figure 9 and figure 10), presents variables like thermal efficiency, combustion duration, exhaust temperature and O2 emission which decrease, while maximum pressure and CO emission increase. For engine No. 2 (figure 11 and figure12), torque and CO, HC, NOx emissions increase whereas exhaust temperature and thermal efficiency decrease. Table 14 shows these changes as percentage when results for Φ = 1 are compared to the ones for Φ= 0,9 for engine # 1, andresults for Φ = 1,1 and Φ = 1,2 are compared to the onesfor Φ= 1 for engine # 2.
For richer mixtures combustion is worse (table 14), as can be expected, because of the behavior of variables like thermal efficiency, combustion duration, HC and CO emissions. But in engine # 2 torque is increased, as well as NOx emissions.This can be explained as a result of a leaner effect of ethanol under fuel-rich conditions [7], and the direct relation of engine load and NOx emission previously explained.
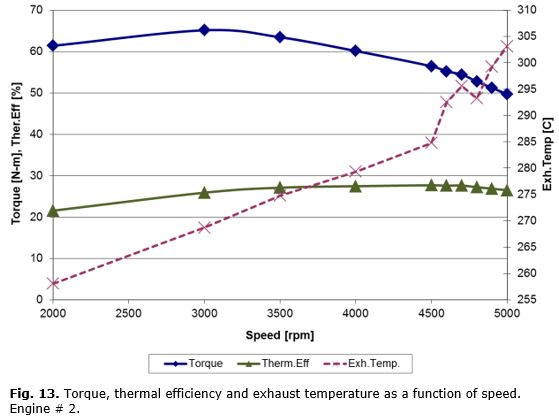
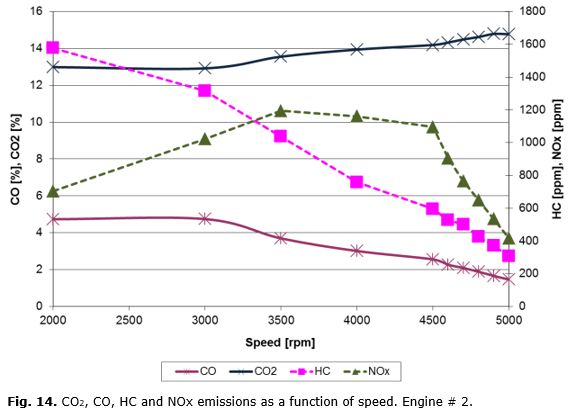
]]> Crankshaft speed:Figure 13 and figure 14 show that thermal efficiency, exhaust temperature and torque (before 3000 rpm) increase, NOx, HC and CO emissions decrease. Table 15 presents these changes as percentage when results for three speeds are compared to the ones for 2000 rpm.With increasing speed combustion is improved as more fuel is burnt resulting in high in-cylinder temperatures [26]. Thermal efficiency and NOx emission reach a peak between 3500 rpm and 4500 rpm, where engine torque and power, respectively, have maximum values. A direct relationship between operating conditions and NOx emission is seen.
CONCLUSIONS
From the results and the discussions above, it can be concluded that:
1. Thermal efficiency increases when gasoline-ethanol blends are used. In this way it is fair to say that combustion is improved and compression ratio can be raised. Best emission and performance are obtained at lean conditions near equivalence ratio of 0,9. Using gasoline-ethanol blends lead to this condition.
2. Exhaust temperature is bigger, up to 4 %, with 10 % ethanol concentration when all range of crankshaft velocitiesis considered. For fixed velocity ethanol concentration does not influence exhaust temperature.
3. Advance of spark timing must be made in order to attain betterperformance conditionswhen increasing ethanol content in the fuel. Spark timing change is 12 % higher for E20 and 50 % higher for E30, when is compared to E0.
]]> 4. Combustion duration is decreased up to 13.85% for increasing advance of spark timing to 20 DBTDC, i.e. more ethanol in the fuel.5. Combustion duration, torque and HC emission are not influenced by ethanol concentration in the fuel for fixed crankshaft velocity.
6. Combustion duration, torque, NOx and HC emissions are not influenced by equivalence ratio in the fuel for fixed crankshaft velocity.
7. NOx emissions highly depend on operating conditions (load and speed).
8. HC and CO emissions decrease up to 80% and 69%, respectively, when all range of velocities are considered.
ACKNOWLEDGEMENTS
ThisstudywassupportedbyDepartamento Administrativo de Ciencia, Tecnología e Innovación de la República de Colombia-COLCIENCIAS (www.colciencias.gov.co)withproject No. 202010013830 contract 472 / 2007.
REFERENCES
]]>1. BASTIANONI, S.; et al. "Indicator and indicandum: "Sustainable way" vs "prevailing conditions" in the Ecological Footprint". Ecological Indicators. 2012, vol 16, p. 47-50.
2. MCPHAIL, Lihong; et al. "Impact of US biofuel policy on US corn and gasoline price variability". Energy, 2012, vol 37, p. 505-513.
3. FURTADO André; et al. "The Brazilian sugarcane innovation system". Energy Policy, 2011, vol. 39, p. 156-166.
4. KOSTIN, A. M.; et al. "Design and planning of infrastructures for bioethanol and sugar production under demand uncertainty". Chemical Engineering Research and Design, 2012, vol. 90, p. 359-376.
5. MUENCH, Stefan; et al. "A systematic review of bioenergy life cycle assessments". Applied Energy, vol. 112, 2013, p. 257-273.
]]> 6. CANAKCI, Mustafa; et al. "Impact of alcohol–gasoline fuel blends on the exhaust emission of an SI engine". Renewable Energy. 2013, vol. 52, p. 111-117.7. SCHIFTER, I.; et al . "Combustion and emission behavior for ethanol-gasoline blends in a single cylinder engine". Fuel. 2011, vol. 90, p. 3586-3592.
8. ORBITAL ENGINE COMPANY. A literature review based assessment on the impacts of a 10 % and 20 % ethanol gasoline fuel blend on non-automotive engines [en línea]. Environment Australia. 2002 [consulta: Abril, 24 de 2015]. Disponible en web: http://www.environment.gov.au/archive/fuelquality/publications/review-non-automotive/pubs/review.pdf
9. MASUMB, M.; et al. "Effect of ethanol–gasoline blend on NOx emission in SI engine". Renewable and Sustainable Energy Review. 2013, vol. 24, p. 209-222.
10. WALLNER, Thomas; et al. "Study of Regulated and Non-Regulated Emissions from Combustion of Gasoline, Alcohol Fuels and their Blends in a DI-SI Engine". En: SAE International Powertrains, Fuels & Lubricants Meeting, 2010, Paper 2010-01-1571.
11. PANG, Xiaobing, et al. "Carbonyls emission from ethanol-blended gasoline and biodiesel-ethanol-diesel used in engines". Atmospheric Environment. 2008, vol 42, p. 1349-1358.
12. VAROLY., et al. "Comparison of Methanol, Ethanol, or n-Butanol Blending with Unleaded Gasoline on Exhaust Emissions of an SI Engine". Energy Sources, Part A: Recovery, Utilization, and Environmental Effects. 2014, vol.9, p. 938-948.
13. ASFAR, K. R.; et al. "Combustion of fuel blends". Energy Conversion and Management. 1998, vol. 39, p. 1081-1093.
14. TAVARES, J. R.; et al. Evaluation of pollutant gases emitted by ethanol and gasoline powered vehicles". Procedia Environmental Sciences. 2011, vol. 4, p. 51-60.
15. KARAVALAKIS, Georgios; et al. "Impacts of ethanol fuel level on emissions of regulated and unregulated pollutants from a fleet of gasoline light-duty vehicles". Fuel. 2012, vol. 93, p. 549-558.
16. ALCALDÍA DE BOGOTÁ. Movilidad en cifras 2011, [en línea]. Informe: Alcaldía Bogotá boletín cifras movilidad 2011. 2011 [consulta: Septiembre 24 de 2014] Disponible en web: http://www.movilidadbogota.gov.co/hiwebx_archivos/audio_y_video/boletin%20cifras.pdf
17. MINISTERIO DE MINAS Y ENERGÍA. Decreto 4892 de Diciembre 23 de 2011 [en línea]. 2011 [consulta: Diciembre 9 de 2014]. Disponible en web: http://www.minminas.gov.co/minminas/downloads/archivosSoporteRevistas/8302.pdf
18. KLEINBAUM, David; et al. Applied regression analysis and other multivariable methods. 5th Edition. Belmont: Duxbury Press, 2013. 928 pages. ISBN 978-1285051086.
]]>19. GRINSTEAD, Charles; SNELL, Laurie. Introduction to Probability [en línea]. Peter G. Doyle. 2006 [Consulta: Abril 24 de 2015]. Disponibleen web: http://www.math.dartmouth.edu/~prob/prob/prob.pdf
20. STEIN, Robert; et al. "Effect of Heat of Vaporization, Chemical Octane, and Sensitivity on Knock Limit for Ethanol - Gasoline Blends". En: SAE 2012 World Congress & Exhibition, 2012, Paper 2012-01-1277.
21. WALLNER, Thomas; et al. "Analytical assessment of C2-C8 alcohols as spark-ignition engine fuels". En: Proceedings of the FISITA 2012 Automotive Congress Volume 3: Future Automotive Powertrains Lecture Notes in Electrical Engineering 191. Berlin, Springer Verlag, 2013. p. 16-26.
22. MANTILLA, Juan; et al. "Combustion model for spark-ignition engines operating on gasoline-ethanol blends". EngenhariaTérmica (Thermal Engineering). 2010, vol. 9, p. 8997.
23. BALKI, Mustafa; et al. "The effect of different alcohol fuels on the performance, emission and combustion characteristics of a gasoline engine". Fuel. 2012, vol. 115, p. 901-906.
24. FOONG, Tien; et al. "The octane numbers of ethanol blended with gasoline and its surrogates". Fuel. 2014, vol. 115, p. 727-739.
25. BALKI, Mustafa; et al. "The effect of compression ratio on the performance, emissions and combustion of an SI (spark ignition) engine fueled with pure ethanol, methanol and unleaded gasoline". Energy. 2014, vol. 71, p. 194-201.
26. TURNER, Dale; et al. "Combustion performance of bio-ethanol at various blend ratios in a gasoline direct injection engine". Fuel. 2011, vol. 90, p. 1999-2006.
Recibido: marzo de 2014
Aprobado: febrero de 2015
]]>
Juan Miguel Mantilla González. Ingeniero Mecánico, MSc, PhD, Profesor Asociado Departamento de Ingeniería Mecánica y Mecatrónica, Universidad Nacional de ColombiaCr30 45-03 edificio 453 of 401, Bogotá, Colombia. email: jmmantillag@unal.edu.co
]]>
