Impact assessment of intermediate processes of steelmaking in electricity cogeneration of steel mill companies
Evaluación del impacto de los procesos intermedios de la producción de acero en la cogeneración de electricidad de la industria siderúrgica
Eder Quental-de-AraújoI, Flávio Neves-TeixeiraII, Guillermo Vilalta-AlonsoII
I Gerdau.Ouro Branco, Minas Gerais, Brazil
II Federal University of São João del Rei. Department of Thermal Science and Fluid. São João del Rei, Brazil
ABSTRACT
The steel industry is one of the most energy-intensive industry sectors, accounting also for the generation of co-products with high added energy, among them stands out the process gases. These fuels supply part of thermal demand from the steel mill companies and are typically utilized for cogeneration of electricity. Thus even with all the amount and complexity of variables involved, a clear and accessible methodology developed by [5] was applied to predict and simulate the cogeneration of electricity. Therefore this study aims to evaluate the sensitivity of the change in production of intermediate processes in cogeneration. It was noted that some processes such as coke oven, blast furnace and steelmaking have a direct relationship between increased production and cogeneration capacity, but in other cases such as sinter plant and rolling mill the increase of production causes a decrease in the availability of fuels for thermoelectric power plant.
Keywords: steel mill, forecast, cogeneration, process gases, intermediate processes.
RESUMEN
La industria siderúrgica es uno de los sectores donde se consume mayor cantidad de energia, siendo responsable por la generación de productos resultantes de procesos con un alto valor energético agregado, entre los que se destacan los gases de proceso. Esos combustibles suministran parte de la demanda térmica de la siderúrgica y, típicamente, son aprovechados para la cogeneración de electricidad. De esta forma, aún con la gran cantidad y la alta complejidad de las variables que intervienen, fue aplicada una metodología clara y accesible desarrollada por [5], para prever y simular la cogeneración de electricidad en un proceso típico de la industria siderúrgica. El objetivo de este trabajo es el de evaluar la sensibilidad de la cogeneración a la alteración de la producción de los procesos intermedios. Fue observado que algunos procesos como coquería, el alto horno y la acería, presentan una relación directa entre el aumento de la producción y la capacidad de cogeneración y, en otros procesos como la sinterización y la laminación, el incremento de la producción provoca una disminución de la disponibilidad de combustibles para la central termoeléctrica.
Palabras claves: siderúrgica, previsión, cogeneración, gases de proceso, los procesos intermedios.
INTRODUCCIÓN
]]> The electricity cogeneration in the steel industry as from process gases (coke oven gas, blast furnace gas and Linz-Donawitz Gas is a traditional industry practice. Currently, the installed capacity of cogeneration in the steel industry in Brazil is approximately 920 MW [1]. In addition to the energy cogeneration some steelmakers have hydroelectric plants, and the sum of the two practices accounted for 42 % of total electricity used by companies associated with [2].It’s important to highlight that currently the Brazilian steel companies operate about 70 % of production capacity [3], which results in lower electricity generation.The main purpose of co-generator arrangement of these plants is to feed critical loads such as air blown into the blast furnace and process heat for several steps, and the attendance of electrical demand is a secondary objective load. In cogeneration systems are carried out simultaneously, and sequential manner, the generation of electrical or mechanical energy and thermal energy from the burning of one or more fuels such as petroleum, natural gas, coal and biomass [4].
The steel industry is characterized by the internal generation of co-products with high added energetic value, which are used as fuel in several furnaces and cogeneration. Among these energetic stand out:
- Coke Oven Gas (COG): generated during the coking stage of mineral coal which is considered a medium calorific gas (PCI 4,200 kcal / Nm³) [5].
- Blast furnace gas (BFG): generated during the reduction of iron ore in blast furnaces is a low-calorific gas (PCI 810 kcal / Nm³) [4].
- Linz-Donawitz Gas (LDG): generated during the refining step in steelmaking is also considered a low-calorific gas (PCI 1,833 kcal / Nm³) [5].
Beyond these process gases it is common the use of coal tar (PCI 9,000 kcal / kg), derived from crude gas generated in the coke oven process [5].
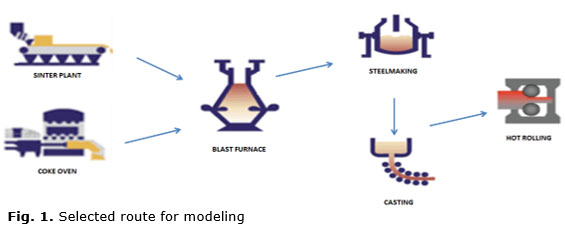
Part of the process gas is burned in combustion towers ('flare'), due to limitations of its own power plants, or the inexistence of them. In this sense cogeneration in the steel industry illustrated by figure 1, it stands out as a good alternative, enabling stimulants attractions, such as:
- Better use of co-products generated in the production process and auxiliary.
- Reduction of external dependence of electricity, which confers greater reliability to the system, allowing local and decentralized generation.
]]> - Reduction the risk of exposition to variations of the electricity market and the possible shortages.- Reduce pollutant emission levels.
Before all the context addressed until then, let's clear that the steel industry is one of the most energy-intensive sectors of the national and global industry, and energy consumables represent a considerable part in the final cost of the finished product. In addition, this sector has, as a characteristic, a considerable autoproduction of electricity with gas and waste recycling process. Thus, it is evident the need of the consumer, energy generation and utilities modeling to support demand forecasting and decision making.
However, in literature is rare to find work with models that presents details and forecasting practices, since it is a very specific activity of the sector, which is very strategic to the business as in the case of plants that generate above own consumption and sell the surplus. In a study presented by [6], it was made a study presenting the demand forecasting and autoproduction for the next ten years in the Brazilian steel industry. In this study, it was used an average specific consumption in kWh / t of crude steel multiplied by an expected production of steel, considering the current capacity and the industry's expansion plans. To predict the autoproduction was used the average percentage currently practiced, multiplied by the obtained consumption.
This methodology meets the aim which is to estimate future demand, though not considering the particularities and capacities of intermediate processes that can lead to an under or over sizing. As will be seen, the change in coke production in an integrated steel mill can increase or decrease the electricity cogeneration by more than 50 %.
Therefore, the aim of this paper is to present a clear and accessible methodology with a forceful technical background, which makes it possible to assess the individual effects of changes in intermediate productions of each stage, to generate electric power.
This work will also serve as a basis since it is not found in the literature research to present a methodology for cogeneration forecasts in the steel industry, covering all stages interfering in the final variable.
METHODOLOGY
Because this is a sector with several routes and sometimes unique particularities, it would be impossible to develop a model of consumption and or energetic generation able to include and generalize all possible profiles of different routes and technologies employed in the steel mill.
]]> Thus, it was firstly necessary to select a route that has a cogeneration profile and at the same time featured national steel mills. The integrated route to coke is responsible for about 77 % of national production and 70 % of world production [2], therefore this was the selected route for the development of the model.Once identified the type of route to study, it was selected a sequence of intermediate steps, whose production parameters impacting directly or indirectly in cogeneration. So, it was used information from four great national steel mills [5]. Among these four steel mill companies analyzed, common processes between them were selected.
However due to the complexity of the processes, and the difference between the final products of each one of them, a single route of rolling mill that best represents this group of companies analyzed was chosen. Thus in figure 1 is showed, the processes of the complete route selected for analysis.
To simulate the consumption of combustible gases in the processes will be used of the model coefficients developed by [5], based on the methodology used by [7], with some adaptations. The model of [7] for steel plants is part of a group of models that are presented in the book Energy Analysis of 108 Industrial Processes developed with American industries data.
Brown model as will be denominated throughout this work links the consumption of several steel manufacturing steps to the rolled final product.
Already the model suggested by the authors utilizes national steel mills data, and unlike Brown, links the production of intermediate steps to rolled steel, to the consumption of each energetic source in its intermediate production. Additionally, this model allows us to consider other variables that are not admitted to the Brown model as stock and / or sale of a determined input.
These differences provide greater flexibility to the model suggested in comparison to the Brown model.
Table 1 shows the specific consumption of fuel gas in energy basis for each process.
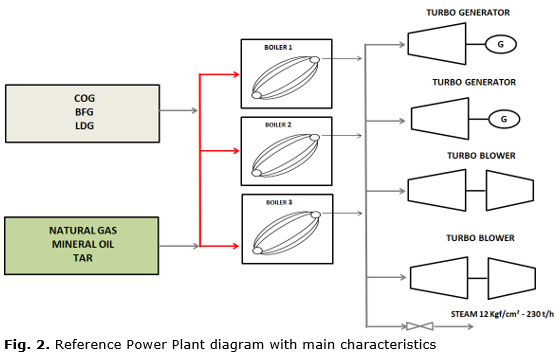
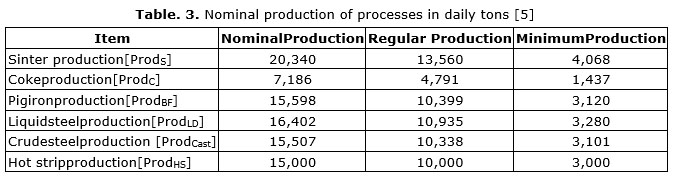
]]> In this work will be adopted a Power Plant, presented by [8] as a reference cogeneration plant for national steel mills, for the robustness of the installed cogeneration arrangement, which enabled the steel mill company in question become self-sufficient in electricity. A schematic figure of this arrangement is illustrated in figure 2 and the main characteristics of the thermoelectric plant are presented below in table 2.Table 3 shows production data for a steel mill company with a capacity of 5,5 million tons of rolled steel per year. Since the productions of other steps were calculated with the suggested model presented earlier.
With the presentation of the assumptionsabove is possible to develop the equation that allows the simulation of electricity cogeneration with surplus process gas.
Equation 1 shows the energy balances for fuel gases. The input data of this equation are shown in table 2 and 3.
Where PTco is the surplus thermal power of the fuel balance , CA is the amount of energy added to other fuels such as natural gas, mineral oil or tar obtained by multiplying the coefficient 1,40 [GJ/tlam] for the production of rolled steels.
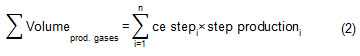
The terms and Volumeprod.gases and Volumecons. gases are the production and consumption of thermal energy generated by process gases respectively as described by equations 2 and 3.
]]>Where ce is the specific coefficient for each step shown in table 3.
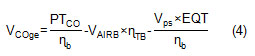
After that it is done the high-pressure steam balance using equation 4 to obtain the excess flow to electricity cogeneration (VCOge) [t/h].
Since ηb [GJ/t] is the specific consumption of boilers, ηTB [t/Ndam³] is the specific steam consumption of the blowers, ηTG [tvap/MW] is the specific consumption of the steam generators, Vps [t/h] is low pressure steam flow and EQT [MJ/t] is the thermal equivalent of the steam process. The respective values of the above terms are presented in table 2.
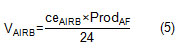
Moreover,Vars [Ndam3/h] is the flow of air blown consumed in the blast furnace defined by equation 5:
Where ceAIRB with a value of 0,79 [Ndam³/tpig iron] is the specific consumption of air blown into the blast furnace defined by the suggested model.
With the calculated high-pressure steam flow it is possible to obtain the electric power generated in the Power Plantusing the equation below.
]]> Then it is calculated the portion that will be generated by top gas recovery turbine blast furnace, using equation 7:Where ceTRT [0,03 MW/tpig iron] is specific coefficient of the top turbine generation taken from the model suggested. The top turbine is a device used in the coke blast furnace to control the top pressure and utilize the kinetic energy of the blast furnace gas to generate electricity [9].
In order to conduct forecasting and simulation of electricity generation, it was developed a worksheet in Microsoft Excel® with all the premises and balances listed above.
RESULTS AND DISCUSSION
It is initially showed one sensitivity analysis of cogeneration with individual variation in production of each step of the production process, keeping the other processes in normal production system, as shown in table 3.
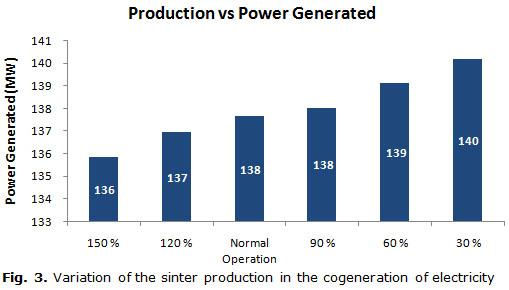
Sinter Plant
Figure 3 shows the results obtained for the sinter process. It is noted that for this process occurs a reduction of electricity cogeneration with increasing sinter production, and the percentage change is 3,22 % to the range of 30 to 150 % of normal production system.
The absolute value represents a reduction in power generated of 4 MW. This decrease is a result of higher consumption of process gas due to increased production in sinter plant, thus the thermal energy surplus to cogeneration is reduced.
]]> Considering a scenario in which increased production of this input is needed, being it for their own consumption or sale, it is recommended to analyze this reduction in cogeneration and consequent increase in purchasing electricity of the power facility or if applicable, the decrease in electrical surplus sale. [10]For example, if the mill in question sells surplus electricity on the open market, where currently the price is an average of 116,35 US$/MWh in the southeast, it ceases to bill a monthly revenue of approximately
US$ 339,869.00.
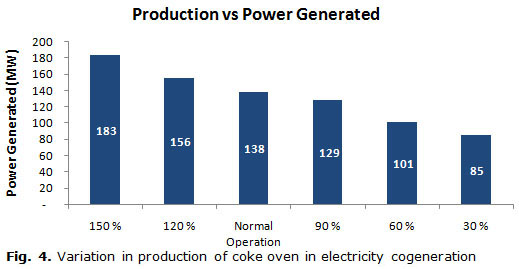
Coke Oven
Figure 4 shows the results obtained for the coking step. For this process, there is an increased electricity generation with the production of coke, once the other productions are fixed. This occurs because coke oven is a fuel gas producer process, wherein during the increased charging of coal more coke oven gas (COG) is generated, and consequently the greater the heat energy excess to the Power Plant.
The percentage variation of this process is 53,8 for the range of 30 to 150 % of normal production system, and an absolute difference of 98 MW of power generated for the same interval.
It is noted that this step has a higher sensitivity to cogeneration than the previous, since the coke oven is a process that generates and consumes large amount of thermal energy. Similar to the previous process is fundamental to scenarios that raise or reduce the production of this raw material, to be analyzed with the impact on the reduction or increase of the generated power.
Blast Furnace
]]> Analyzing the figure 5. It can be noted that the variation of the blast furnace production in the cogeneration of electricity, has a similar behavior to the coking process. It means that there is an increase in cogeneration rising to pig iron production and keeping the other processes in normal production regime.Just as in the coke oven, the step of reducing iron ore in the blast furnace is a gas producer process (BFG), which provides greater thermal energy surplus to thermoelectric plant.
There is a greater percentage change in that process from the previous, reaching the order of 76,6 % for the range 30 -150 % of normal production regime, and an absolute difference of 155 MW and is also here the biggest difference found.
It is worth noting that this condition of pig iron production increased while maintaining fixed steel production in the steelmaking is avoided, since it would be necessary to throw hot metal in yards with converters operating in normal conditions, and this, is not economically viable.
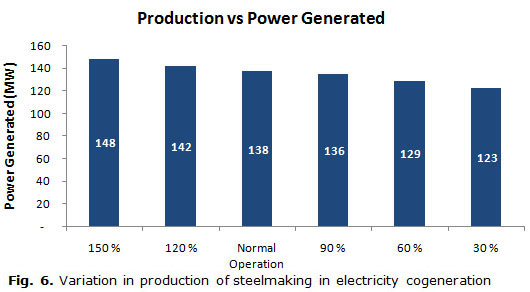
Steelmaking
Figure 6 shows the results obtained for steelmaking. For this process also occurs an increase in the generation of electricity with the production of steel, since other production are fixed. This occurs because the steelmaking is a producer of fuel gas process (LDG), thus an increase in steel production enables greater thermal energy excess for the thermoelectric plant.
The percentage variation of this process is 17,3 % for the range of 30 to 150 % of normal production regime, and an absolute difference of 26 MW for the same interval. It is noted that although this step presents high sensitivity, it is smaller than the other production steps gases, then the amount of generated thermal energy in this process is lower suchin the blast furnace as the coke oven.
The increased production of this step, keeping the other ones fixed, is limited due to consumption restrictions of scrap and solid pig iron in converter.
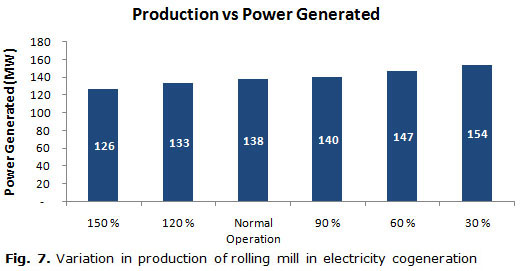
]]> Hot RollingFigure 7 shows the results obtained for the hot rolling process. It is noted that this process occurs a reduction in the cogeneration of electricity with increased production of hot rolled, and the percentage variation is 21,6 % in the range from 30 to 150 % of normal production regime.
The absolute value represents a reduction in power generated of 27,2 MW. This decrease is a result of higher consumption of process gas due to increased production in the rolling mill, thus the thermal energy excess for the cogeneration is significantly reduced. Thus the profit from increased production must always justify the reduction of electricity cogeneration.
The main limitations of the above methodology are the particularities of each steel mill. That is, although many production routes and processes are the same, each plant has a different design with some differences that may influence the final result of cogeneration. However, once the differences are known, you can modify the model, specific consumes, the thermoelectric characteristics and the inclusion of other processes changing the equation.
CONCLUSION
This work presented a clear and didactic methodology for predicting electricity cogeneration in typical Brazilian integrated steel plants. With the assumptions adopted and the equation developed, it was possible to evaluate the sensitivity of increased production in each intermediate process in electricity cogeneration.
It was verified that the producers process of combustible gases has as standard an increase in cogeneration behavior with increasing production, especially in the blast furnace and coke oven process, which showed high percentages and absolute values in the analyzed interval. It is emphasized that some of these scenarios may not be usual and sometimes is a result of operational problems.
For hot rolling and sinter plant processes, it was found the same behavior in order to production variation, that is, a reduction in the cogeneration due to the lower availability of thermal energy of the Power Plant. This behavior is intensified in the hot rolling step because of the higher consumption of process gas.
]]> It also highlights the importance of an impact assessment of the reduction or increase in electricity cogeneration, according to different scenarios of increasing or decreasing in the intermediate productions of the steel manufacturing process.
REFERENCES
1. Tolmasquim T, Guerreiro A. Caracterização do uso da Energia no Setor Siderúrgico brasileiro. Rio de Janeiro, Brazil: Empresa de Pesquisa Energetica, Ministério de Minas e Energia; 2009. [Cited: April 15, 2015] Available from: http://www.epe.gov.br/mercado/Documents/S%C3%A9rie%20Estudos%20de%20Energia/20090430_2.pdf
2. De Andrade R. A indústria do aço no Brasil. Brasília, Brazil: Instituto Aço Brasil; 2012. [Cited: May 23, 2015] Available from: http://www.acobrasil.org.br/site/portugues/sustentabilidade/downloads/livro_cni.pdf
3. Baptista Filho B. Relatório de Sustentabilidade 2014. Rio de Janeiro, Brazil: Instituto do Aço do Brasil; 2014. [Cited: May 2, 2015] Available from: http://www.acobrasil.org.br/site2015/downloads/Relatorio_Sustentabilidade_2014.pdf.
4. Teixeira FN. Seleção de Ciclos e Configurações de Sistemas de Cogeração Mestrado. Itajubá, Brazil: Escola Federal de Engenharia de Itajubá; 1997. [Cited: May 23, 2015] Available from: https://www.dropbox.com/s/blcl6gdljcg3e6i/Sele%C3%A7%C3%A3o%20de%20Ciclos%20e%20Configura%C3%A7%C3%B5es%20de%20Sistemas%20de%20Cogera%C3%A7%C3%A3o.pdf?dl=0.
5. Araújo QE. Modelo de Balanço Energético para Gerenciamento e Previsão de Demandas para uma Planta Siderúrgica Típica Brasileira Mestrado. São João del-Rei, Brazil: Universidade Federal de São João del-Rei, 2015. [Cited: May 25, 2015] Available from: https://www.dropbox.com/s/c7a3n426lcdr3s2/Modelo%20de%20Balan%C3%A7o%20Energ%C3%A9tico%20para%20%20Gerenciamento%20e%20Previs%C3%A3o%20de%20Demandas%20para%20uma%20Planta%20Sider%C3%BArgica%20T%C3%ADpica%20Brasileira.pdf?dl=0
6. Tolmasquim T, Guerreiro A. Projeção da demanda de energia elétrica para os próximos 10 anos (2014-2023). Rio de Janeiro, Brazil: Empresa de Pesquisa Energetica, Ministério de Minas e Energia; 2013. [Cited March 30, 2015] Available from: http://www.epe.gov.br/mercado/Documents/S%C3%A9rie%20Estudos%20de%20Energia/20140203_1.pdf.
7. Brown H, Hamel B, Hedman B. Energy Analisys of 108 Industrial Processes. Atlanta, EUA: The Fairmont Press. Liburn; 1996. ISBN 0135769922.
8. Lima RNO. Avaliação de Arranjos Cogeradores em Siderúrgicas Brasileiras com o Auxilio de Simulação Computacional Doutorado. São Paulo, Brazil: Faculdade de Engenharia Mecânica, Universidade do Campinas; 2001. [Cited: May 30, 2015] Available from: http://www.bibliotecadigital.unicamp.br/document/?code=vtls000235472.
9. Junqueira JC. Utilização do Gás de Alto-forno para Produção de Energia em Indústria Siderúrgica no Estado de Minas Gerais. Belo Horizonte, Brazi.l Gerência de Desenvolvimento e Apoio Técnico às Atividades Industriais, Fundação Estadual do Meio Ambiente; 2010. [Cited: Feb. 24, 2015] Available from: http://www.feam.br/images/stories/arquivos/producaosustentavel/2012/sumario-gas-de-af.pdf.
10. Carvalho PS, Mesquita PP, Araújo ED. Sustentabilidade da siderurgia brasileira: eficiência energética, emissões e competitividade. Rio de Janeiro, Brazil: O banco nacional do desenvolvimiento, Biblioteca digital do BNDES; 2015. [Cited: July 23, 2015] Available from: https://web.bndes.gov.br/bib/jspui/handle/1408/4287.
Received: 2 de Julio de 2015.
Accepted: 20 de agosto de 2015.
Eder Quental-de-Araújo. Gerdau.Ouro Branco, Minas Gerais, Brazil ]]> E-mail: eder.quental@gmail.com
]]>![Table. 1. Specific consumption of fuel gases [5]](/img/revistas/im/v18n3/t0103315.jpg)
![Table. 2. Plant Indicators of reference cogeneration [8]](/img/revistas/im/v18n3/t0203315.jpg)

