<?xml version="1.0" encoding="ISO-8859-1"?><article xmlns:mml="http://www.w3.org/1998/Math/MathML" xmlns:xlink="http://www.w3.org/1999/xlink" xmlns:xsi="http://www.w3.org/2001/XMLSchema-instance">
<front>
<journal-meta>
<journal-id>0864-3466</journal-id>
<journal-title><![CDATA[Revista Cubana de Salud Pública]]></journal-title>
<abbrev-journal-title><![CDATA[Rev Cubana Salud Pública]]></abbrev-journal-title>
<issn>0864-3466</issn>
<publisher>
<publisher-name><![CDATA[Editorial Ciencias Médicas]]></publisher-name>
</publisher>
</journal-meta>
<article-meta>
<article-id>S0864-34662004000200004</article-id>
<title-group>
<article-title xml:lang="es"><![CDATA[Un método para determinar la calidad de la información del registro del cáncer]]></article-title>
<article-title xml:lang="en"><![CDATA[A method for ascertaining the quality of cancer registry data]]></article-title>
</title-group>
<contrib-group>
<contrib contrib-type="author">
<name>
<surname><![CDATA[Verdecchia]]></surname>
<given-names><![CDATA[Arduino]]></given-names>
</name>
<xref ref-type="aff" rid="A01"/>
</contrib>
<contrib contrib-type="author">
<name>
<surname><![CDATA[De Angelis]]></surname>
<given-names><![CDATA[Roberta]]></given-names>
</name>
</contrib>
<contrib contrib-type="author">
<name>
<surname><![CDATA[Franceschi]]></surname>
<given-names><![CDATA[Silvia]]></given-names>
</name>
</contrib>
</contrib-group>
<aff id="A01">
<institution><![CDATA[,Instituto Superiore di Sanitá Lab Epidemiología e Biostatistica ]]></institution>
<addr-line><![CDATA[Roma ]]></addr-line>
</aff>
<pub-date pub-type="pub">
<day>00</day>
<month>06</month>
<year>2004</year>
</pub-date>
<pub-date pub-type="epub">
<day>00</day>
<month>06</month>
<year>2004</year>
</pub-date>
<volume>30</volume>
<numero>2</numero>
<fpage>0</fpage>
<lpage>0</lpage>
<copyright-statement/>
<copyright-year/>
<self-uri xlink:href="http://scielo.sld.cu/scielo.php?script=sci_arttext&amp;pid=S0864-34662004000200004&amp;lng=en&amp;nrm=iso"></self-uri><self-uri xlink:href="http://scielo.sld.cu/scielo.php?script=sci_abstract&amp;pid=S0864-34662004000200004&amp;lng=en&amp;nrm=iso"></self-uri><self-uri xlink:href="http://scielo.sld.cu/scielo.php?script=sci_pdf&amp;pid=S0864-34662004000200004&amp;lng=en&amp;nrm=iso"></self-uri><abstract abstract-type="short" xml:lang="es"><p><![CDATA[Los métodos que habitualmente se utilizan para evaluar el completamiento y la calidad de las informaciones del Registro del Cáncer comprenden indicadores sencillos e indirectos como son la proporción de casos con certificados de defunción (casos DCO), la proporción de casos con confirmación microscópica, la relación incidencia-mortalidad, etc. Se propone en este trabajo la modelación de la incidencia del cáncer, la mortalidad y la supervivencia en un marco unificado como método adecuado para chequear la consistencia de las informaciones del Registro del Cáncer con un proceso que se cierra solo cuando los datos sobre mortalidad, incidencia y supervivencia del paciente son completos y tienen una gran calidad. El método MIAMOD se desarrolló para brindar estimados y proyecciones referidos a la incidencia, prevalencia y mortalidad, utilizando la información sobre mortalidad y supervivencia de los pacientes a nivel nacional o regional. Se ofrecen ejemplos de la aplicación del método MIAMOD en los registros nacionales del cáncer en Europa para mostrar el comportamiento del método en la revisión de las informaciones del Registro del Cáncer en lo que respecta a la consistencia interna y el completamiento de la información. Proponemos el método y el software MIAMOD como una herramienta útil para chequear el completamiento y la calidad de las mencionadas informaciones y para brindar información futura sobre el peso del cáncer en los planes de salud y en la asignación de recursos para esta esfera]]></p></abstract>
<abstract abstract-type="short" xml:lang="en"><p><![CDATA[Methods commonly used to evaluate completeness and quality of CR data involve simple and indirect indicators such as the proportion of DCO cases, the proportion of cases with microscopic confirmation, the incidence to mortality ratio, etc. Modelling cancer incidence, mortality and survival in a unified framework is proposed as an appropriate approach to check for consistency CR data with a process that turns out to be circular if, and only if, mortality, incidence and patients&#8217; survival data are high quality and complete. The MIAMOD method was developed to provide incidence, prevalence and mortality estimates and projections, using mortality and patients&#8217; survival information at national or regional levels. Examples of application of the MIAMOD method to national cancer registries in Europe are given to show the performance of the method in checking the CR data for internal consistency and completeness of registration. We are proposing the MIAMOD method and software as a tool for CR useful to check for completeness and quality of their data and to provide future cancer burden information for health planning and allocation of resources for their area]]></p></abstract>
<kwd-group>
<kwd lng="es"><![CDATA[Metodos epidemiologicos]]></kwd>
<kwd lng="es"><![CDATA[cAncer]]></kwd>
<kwd lng="es"><![CDATA[incidencia]]></kwd>
<kwd lng="es"><![CDATA[mortalidad]]></kwd>
<kwd lng="en"><![CDATA[Epidemiological methods]]></kwd>
<kwd lng="en"><![CDATA[Cancer]]></kwd>
<kwd lng="en"><![CDATA[Incidence]]></kwd>
<kwd lng="en"><![CDATA[Mortality]]></kwd>
</kwd-group>
</article-meta>
</front><body><![CDATA[ <p>Instituto Superiore di Sanit&aacute; Rome, Italy</p><h2>A method for ascertaining  the quality of cancer registry data</h2>    <p><a href="#cargo">Arduino Verdecchia,<span class="superscript">1</span>  Roberta De Angelis,<span class="superscript">1</span> Silvia Franceschi<span class="superscript">1</span></a><span class="superscript"><a name="autor"></a></span></p><h4>Summary</h4>    <p>  Methods commonly used to evaluate completeness and quality of CR data involve  simple and indirect indicators such as the proportion of DCO cases, the proportion  of cases with microscopic confirmation, the incidence to mortality ratio, etc.  Modelling cancer incidence, mortality and survival in a unified framework is proposed  as an appropriate approach to check for consistency CR data with a process that  turns out to be circular if, and only if, mortality, incidence and patients&#146;  survival data are high quality and complete. The MIAMOD method was developed to  provide incidence, prevalence and mortality estimates and projections, using mortality  and patients&#146; survival information at national or regional levels. Examples  of application of the MIAMOD method to national cancer registries in Europe are  given to show the performance of the method in checking the CR data for internal  consistency and completeness of registration. We are proposing the MIAMOD method  and software as a tool for CR useful to check for completeness and quality of  their data and to provide future cancer burden information for health planning  and allocation of resources for their area.</p>    <p><b>Key words:</b> Epidemiological  methods, Cancer, Incidence, Mortality.</p><h4>Introduction </h4>    <p>Cancer registries  (CR) represent epidemiological instruments which are aimed at providing population  based cancer incidence and mortality. Cancer registries need well recognized requisites  to be classified as high quality CR, and to be efficient tools for cancer control.  Quality and completeness of data collected by cancer registries represent key  issues that affect their reliability and potential use of their data. <i>When  cancer patients&#146; survival and prevalence are additional aims for a CR, further  control is needed on completeness and quality of follow-up of patients for life  status</i>.     <br> </p>    <p>Methods commonly used to evaluate the completeness and  quality of CR data involve simple and indirect indicators such as the proportion  of DCO cases, the proportion of cases with microscopic confirmation, the mortality  to incidence ratio, etc. However, none one of these indicators must be taken individually  for ascertaining the completeness and quality of collected data. For example,  the mortality to incidence ratio is not expected to be constant in time as it  strongly depends on the shape of incidence and mortality trend curves, according  to their stable, increasing, decreasing or changing patterns. The proportion of  DCO cases can certainly inform us about the completeness of the collecting system  but it does not give any information on the quality of diagnoses, dates, and the  entity of all information collected.     <br> </p>    <p>Modeling cancer incidence, mortality  and survival in a unified framework is, in principle, an appropriate approach  to check for consistency of CR data. This kind of models establishes the theoretical  relationships between the different quantities involved in the process to which  the same cancer patients contribute. We can check whether incidence is consistent  with mortality and patients&#146; survival in a process that turns out to be circular  if, and only if all the data, are of high quality and highly complete.     <br> </p>    ]]></body>
<body><![CDATA[<p>The  Mortality and Incidence Analysis MODel (MIAMOD) method<span class="superscript">1,2</span>  was developed to provide incidence, prevalence and mortality estimates and projections,  using mortality and patients&#146; survival information at national or regional  levels the MIAMOD method can be applied to data of a CR that has operated for  several calendar year (at least 8-10 years) and provides comparative incidence  estimates that are the ones expected on the basis of cancer mortality and patients&#146;  survival. From the match of the observed and expected incidence rates we derive  quality issues for that the specific CR.    <br> </p>    <p>Aim of this paper is to propose  the MIAMOD method and software as a useful tool for CRs who wish to perform their  own check for completeness and quality of their data. CRs can also use the method  to produce estimates and projections of cancer incidence, mortality and prevalence  for their area. </p><h4>Methods</h4>    <p>The MIAMOD method was extensively presented  in previous papers.<span class="superscript">1,2</span> We will present here its  basic formulation and explain understandably how thise method performs.</p>    <p align="center"><a href="/img/revistas/rcsp/v30n2/f0104204.jpg"><img src="/img/revistas/rcsp/v30n2/f0104204.jpg" width="252" height="240" border="0"></a></p>    
<p align="center">FIG.  1. The MIAMOD method: compartmental representation for a given birth cohort.</p>    <p align="center"><a href="/img/revistas/rcsp/v30n2/formula0103204.gif"><img src="/img/revistas/rcsp/v30n2/formula0103204.gif" width="329" height="185" border="0"></a></p>    
<p>with  cancer at age <font face="Symbol">t</font> , and <font face="Symbol">b</font>  and <font face="Symbol">a</font> are the death hazard for cancer patients and  death hazard for the general population, respectively. Equation (1) gives the  expected cancer mortality at age x as the convolution of the probability of cancer  diagnosis <font face="Symbol">m</font>(<font face="Symbol">t</font>) at age <font face="Symbol">t</font>&lt;x,  for the proportion of healthy people in the population, [1-<font face="Symbol">n</font>(<font face="Symbol">t</font>)],  times the probability of death from cancer at age x, conditional to have survived  the extra death hazard for cancer patients with respect to the general population.    <br>  </p>    <p>The second equation gives similarly the cancer prevalence n(x) at age x  as the convolution the probability of cancer diagnosis <font face="Symbol">m</font>(<font face="Symbol">t</font>)  at age <font face="Symbol">t</font>&lt;x, for the proportion of healthy people  in the population, times the probability of surviving the extra death hazard for  cancer patients with respect to the general population. A set of equation systems  (1 and 2), one for each N=A+Y birth cohorts involved in the data for A single  year of age, and Y single year of diagnosis, allows functionally for a link function  G(<font face="Symbol">m</font>) between cancer incidence and mortality. Figure  2 show the data space for the MIAMOD method, including the back projection, estimation  and projection areas. For each birth cohort the data matrix describes only a variable  part of it and some back projection and forward projection is implied in the age  period and cohort approach. In the projection area no data are available for the  future birth cohort and a limit to 10-20 years of projection period should be  defined in order to moderate the progressive bias of missing future birth cohorts.    ]]></body>
<body><![CDATA[<br>  </p>    <p>Incidence is assumed as a polynomial function of age, period of diagnosis  and birth cohort, throughout a logit link function <font face="Symbol">F</font>:      <br> </p>    <p align="center">    <br> <a href="/img/revistas/rcsp/v30n2/f0204204.jpg"><img src="/img/revistas/rcsp/v30n2/f0204204.jpg" width="219" height="169" border="0"></a>  </p>    
<p align="center">
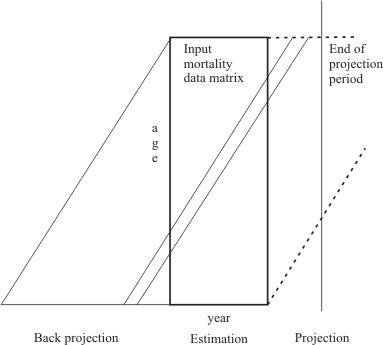
FIG. 2. The MIAMOD method data space. </p>    <p align="center"><img src="/img/revistas/rcsp/v30n2/formula.jpg" width="368" height="47">    
<br>  </p>    <p>where <font face="Symbol">q</font> = (const , a<span class="subscript">1</span>,  &#133;, a<span class="subscript">k1,</span> b<span class="subscript">1</span>,  &#133;, b<span class="subscript">k2,</span> c<span class="subscript">1</span>,  &#133;, c<span class="subscript">k3</span>) is the vector of the parameters to  be estimated by a maximum likelihood fit of cancer mortality data matrix by single  year of age and calendar year of diagnosis. The function <font face="Symbol">F</font>  works as a link function between incidence and mortality. Also the degree of polynomials  have to be estimated. A set of restricted cubic splines<span class="superscript">3</span>  can be used to model either age, period and cohort as an alternative to polynomials.    <br>  </p>    ]]></body>
<body><![CDATA[<p>The MIAMOD method receives as an input age specific mortality data for  a set of calendar years, for a specific cancer site of interest, age specific  all causes mortality and population size for the same calendar years, and an estimate  of patients&#146; survival by age and calendar year. The MIAMOD method furnishes  expected incidence, mortality and prevalence, with projections to a chosen projection  period.     <br> </p>    <p>In a CR data application, whether or not the expected incidence  matches the observed one, we can derive indications on the completeness and quality  of CR data. If observed and expected data match we simply conclude that the CR  data area high quality and complete. If they do not match we have to further study  in detail all the information involved and to discriminate which of the information  is likely to be problematic. Hence we must try to identify the ways to improve  the data. The lack of consistency between incidence, mortality and survival can  derive from problems of (in)completeness of cancer registration, misclassification  of incidence or deaths cases. If a registry misses randomly a proportion of cases,  the estimated patients&#146; survival is not expected to be biased. In this case  the lack of match of the observed and expected incidence expresses the proportion  of missing incidence cases. If misclassification of the cancer site occurs frequently  for collected incidence cases, the estimated patients&#146; survival will reflect  this biased disease definition of incidence cases that is expect to apply differently  to mortality data. The lack of match between the observed and expected incidence  in this case expresses the combined action of incidence misclassification and  the corresponding patients&#146; survival bias. Then, we expect that the observed  and estimated cancer incidence will match perfectly if and only if all the involved  data are complete and high quality.    <br> </p>    <p>The method needs this patients&#146;  survival information over a long span of calendar years in order to cover potentially  the entire data space (Figure 2). Survival data are usually available from CRs  for a limited time period which depend on how long the CR has been operating.  Some modeling of survival is then needed to expand the survival information both  to long term and backward to former calendar years.    <br> </p>Cure models with covariates4-5  are used to model relative survival by age class and period of diagnosis to allow  to expand survival as needed, according to some simple hypotheses i.e. constant,  linearly increasing or deceasing, etc.    <br> <h4 align="left">Example applications</h4>    <p>The  MIAMOD method was extensively applied to national level in Italy.<span class="superscript">6-10</span>  to European countries within a concerted action of the EU commission, the EUROPREVAL  Study, to the major cancer sites (Franceschi S, De Angelis R, Quinn M, Colonna  M, Verdecchia A. Changing trend in lung cancer in Europa [in press] in and to  US (Verdecchia A, Mariotto A, Micheli A, Ries LAG, Lynch CF,Yancik R. Estimating  and projecting the prevalence of cancer: an Application to Iowa Cancer Registry  data [in press]. The method was also applied to rather small areas, e.g. Iceland,  local CR areas,<span class="superscript">11</span> Italian regions,<span class="superscript">12-14</span>  and rare cancer sites.    <br> </p>    <p>We will present in this section some example  application from the EUROPREVAL experience which illustrate how the method performs  and may be used to check CR data for their consistency.</p><h6>Application to  high quality CR</h6>    ]]></body>
<body><![CDATA[<p>Figure 3 shows the estimated mortality and incidence in  comparison to the observed mortality and incidence example applications to high  quality cancer registries. The method fits observed mortality and reconstructs  the expected incidence that is consistent with the levels and trends of mortality  and patients&#146; survival. The comparison of observed and estimated mortality  serves as a goodness of fit evaluation while the comparison of observed and estimated  incidence is simply a match that informs us about the consistency of all the involved  data. Goodness of fit is generally high since the polynomial age, period and cohort  model is rather flexible. The perfect matches that we individuate for prostate  cancer incidence in Sweden, colorectal cancer incidence in Finland and Estonia  assure us of the completeness and high quality of these CR data. For Iceland the  huge variability of observed incidence and mortality data makes it difficult to  ascertain clearly the levels and trends. Notwithstanding, the estimated incidence  helps us to identify an increasing trend for colorectal cancer incidence that  is rather consistent with the variable observed rates. </p>    <p align="center">    <br>  <a href="/img/revistas/rcsp/v30n2/f0304204.jpg"><img src="/img/revistas/rcsp/v30n2/f0304204.jpg" width="275" height="264" border="0"></a>  </p>    
<p align="center">FIG. 3. Example applications to high quality national CR  a) Prostate cancer in Sweden; b) Male colorectal cancer in Iceland; c) Male colorectal  in Estonia; d) Male lung cancer in Finland. </p><h6>Managing inconsistencies</h6>    <p>When  the comparison of observed and estimated incidence results in no satisfactory  match, some further study is required to identify the reasons for these inconsistencies.  We present some example situations with identified problems.     <br> </p>    <p>Figure  4 shows observed and estimated male lung cancer incidence and mortality in Sweden.      <br> </p>    <p align="center"><a href="/img/revistas/rcsp/v30n2/f0404204.jpg"><img src="/img/revistas/rcsp/v30n2/f0404204.jpg" width="182" height="168" border="0"></a></p>    
<p align="center">
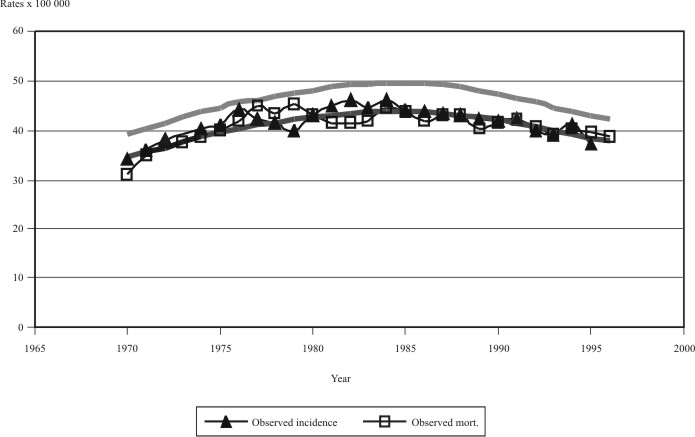
FIG.  4. Male lung cancer in Sweden. Comparison of observed and estimated incidence  and mortality rates.</p>    ]]></body>
<body><![CDATA[<p>Looking at observed rates (black diamond marker for  incidence and empty square marker for mortality) we clearly see that incidence  and mortality overlap each other. This situation is consistent with a null patients&#146;  survival probability. Patients&#146; survival from lung cancer in fact is poor  (about 10 % of survivors at 5 years from the diagnosis) but not null. Estimated  lung cancer incidence trends do not match at all with the observed data. The reason  for this inconsistency can be easily foundin the choice of the Swedish Cancer  Registry, not to include the Death Certificate Only (DCO) cases in their incidence  statistics. Sweden publishes yearly on a separate report a description of its  DCO cases. Once the observed incidence is corrected with the DCO cases (see Table)  in fact, the estimated (MIAMOD) and observed (EUROCIM-corrected) rates become  very close to each other.     <br> </p>    <p>Figure 5 shows observed and estimated incidence  and mortality trends for breast cancer in Scotland. Breast cancer incidence in  Scotland presents a bump just following the year 1990 that is not reflected in  the mortality trend and not reproduced by the estimated incidence. This is a very  clear illustration of the effect, which the introduction of the population based  breast cancer screening had on England and Scotland in 1990.<span class="superscript">15</span>  After the bump, the incidence trend continued exactly as expected by the MIAMOD  method. So in this case, the MIAMOD application served to quantify the artifact  incidence effect of the screening we can evaluate by the area of the bump.</p>    <p align="center"><a href="/img/revistas/rcsp/v30n2/f0504204.jpg"><img src="/img/revistas/rcsp/v30n2/f0504204.jpg" width="235" height="198" border="0"></a></p>    
<p align="center">
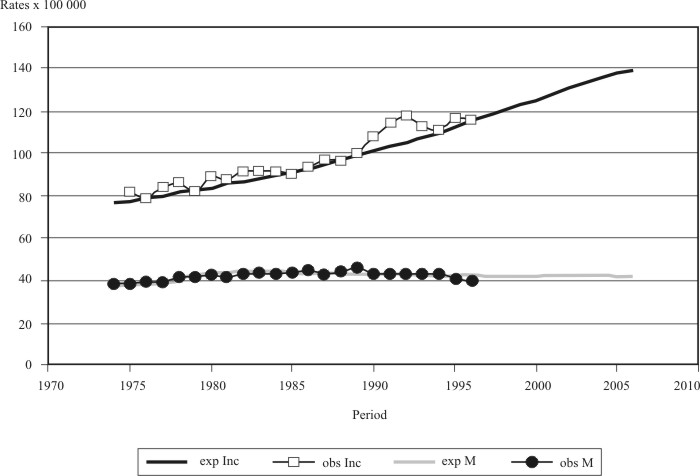
FIG.  5. Female breast cancer in Scotland. Comparison of observed and estimated incidence  and mortality rates.</p>    <p>TABLE. Lung cancer in Sweden. Comparison of corrected  observed incidence (EUROCIM-rates&sect;*) and MIAMOD estimated incidence (MIAMOD-  rates<span class="superscript">&sect;</span>)</p>    <div align="center">a) MEN </div><table width="75%" border="1" align="center">  <tr> <td>&nbsp;</td><td colspan="3">     <div align="center">DCO cases</div></td><td colspan="3">      <div align="center">EUROCIM</div></td><td colspan="3">     <div align="center">MIAMOD  </div></td></tr> <tr> <td>&nbsp;</td><td>     ]]></body>
<body><![CDATA[<div align="center">0-49</div></td><td>     <div align="center">50-74  </div></td><td>     <div align="center">75+</div></td><td>     <div align="center">ALL  </div></td><td>     <div align="center">cases</div></td><td>     <div align="center">Rate<span class="superscript">&sect;</span></div></td><td>      <div align="center">cases*</div></td><td>     <div align="center">Rates&sect;*</div></td><td>      <div align="center">Rates&sect; </div></td></tr> <tr> <td>1996</td><td>     <div align="center">5  </div></td><td>     ]]></body>
<body><![CDATA[<div align="center">47 </div></td><td>     <div align="center">119</div></td><td>      <div align="center">171 </div></td><td>     <div align="center">1569</div></td><td>      <div align="center">36</div></td><td>     <div align="center">1740</div></td><td>      <div align="center">40 </div></td><td>     <div align="center">42 </div></td></tr>  <tr> <td>1997</td><td>     <div align="center">2</div></td><td>     <div align="center">61  </div></td><td>     ]]></body>
<body><![CDATA[<div align="center">108</div></td><td>     <div align="center">171  </div></td><td>     <div align="center">1605</div></td><td>     <div align="center">&nbsp;  37 </div></td><td>     <div align="center">1776</div></td><td>     <div align="center">41  </div></td><td>     <div align="center">42 </div></td></tr> <tr> <td>1998 </td><td>      <div align="center">1 </div></td><td>     <div align="center">67 </div></td><td>     <div align="center">137</div></td><td>      ]]></body>
<body><![CDATA[<div align="center">205</div></td><td>     <div align="center">1614 </div></td><td>      <div align="center">37</div></td><td>     <div align="center">1819</div></td><td>      <div align="center">42</div></td><td>     <div align="center">41 </div></td></tr>  <tr> <td colspan="10">a) WOMEN     <div align="center"></div>    <div align="center"></div>    <div align="center"></div>    <div align="center"></div>    ]]></body>
<body><![CDATA[<div align="center"></div>    <div align="center"></div>    <div align="center"></div>    <div align="center"></div>    <div align="center"></div></td></tr>  <tr> <td>&nbsp;</td><td colspan="3">     <div align="center">DCO cases</div></td><td colspan="3">      <div align="center">EUROCIM</div></td><td colspan="3">     <div align="center">MIAMOD</div></td></tr>  <tr> <td>&nbsp;</td><td>     <div align="center">0-49 </div></td><td>     <div align="center">50-74  </div></td><td>     ]]></body>
<body><![CDATA[<div align="center">75+ </div></td><td>     <div align="center">ALL</div></td><td>      <div align="center">cases</div></td><td>     <div align="center">rates&sect; </div></td><td>      <div align="center">cases* </div></td><td>     <div align="center">rates&sect;* </div></td><td>      <div align="center">rates&sect; </div></td></tr> <tr> <td>1996</td><td>     <div align="center">1  </div></td><td>     <div align="center">40 </div></td><td>     <div align="center">76  </div></td><td>     ]]></body>
<body><![CDATA[<div align="center">117 </div></td><td>     <div align="center">1026</div></td><td>      <div align="center">24 </div></td><td>     <div align="center">1143</div></td><td>      <div align="center">26</div></td><td>     <div align="center">28 </div></td></tr>  <tr> <td>1997</td><td>     <div align="center">2 </div></td><td>     <div align="center">39  </div></td><td>     <div align="center">88 </div></td><td>     <div align="center">129  </div></td><td>     ]]></body>
<body><![CDATA[<div align="center">983 </div></td><td>     <div align="center">23  </div></td><td>     <div align="center">1112 </div></td><td>     <div align="center">26  </div></td><td>     <div align="center">29 </div></td></tr> <tr> <td>1998</td><td>      <div align="center">0 </div></td><td>     <div align="center">36 </div></td><td>     <div align="center">66  </div></td><td>     <div align="center">102</div></td><td>     <div align="center">1006</div></td><td>      ]]></body>
<body><![CDATA[<div align="center">13 </div></td><td>     <div align="center">1108</div></td><td>      <div align="center">26 </div></td><td>     <div align="center">30 </div></td></tr>  </table>    <p align="center">&sect; Rates per 100,000 population.    <br> * Corrected  with the number of DCO cases.</p><h4>Discussion</h4>    <p>We proved that the MIAMOD  method is a flexible and valid procedure to produce estimates and projections  of incidence and prevalence, provided that valid mortality and survival information  is available. The method can be also applied to rather small CR areas.    <br> </p>    <p>When  used to check and validate CR data the method allows for a comprehensive evaluation  of the consistency of incidence, mortality and patients&#146; survival information  that is integrative to other conventional methods currently used for data quality  check. The MIAMOD application is not simply a check of the data as it heavily  involves the analysis and use of the data. The application may result in a perfect  match between the observed and estimated cancer incidence on the basis that all  data are high quality and complete. For problems arising from an unsatisfactory  match between observed and estimated cancer incidence we need to study in detail  all possible reasons, i.e. patients selections, inconsistencies in the disease  definition between incidence and mortality orother misclassifications, biases  in the survival analysis and modeling, screenings, etc. Managing inconsistencies  involves further studies on the quality and completeness of the CR data that certainly  have the effect of improving the quality of the data.     <br> </p>    ]]></body>
<body><![CDATA[<p>Application  of the MIAMOD method to CR areas can provide cancer prevalence estimates. Prevalence  is an important indicator of the cancer burden in a population as it describes  the size of the population with a previous diagnosis of cancer. This population  constitutes a large part of the health demand in terms of costs for main treatment,  palliative care, follow-up for recurrences, etc. Total prevalence includes all  the patients who had a previous diagnosis of cancer, irrespectively to time since  diagnosis, whether treated, cured or not. Partial prevalence estimates by time  since diagnosis can be obtained from the MIAMOD application to identify strata  of the prevalence that are more homogeneous in terms of same or similar care needs,  i.e. for colorectal cancer, 1 year prevalence is to include patients under major  treatment, whereas 5 year prevalence includes patients requiring major care needs  and 5+ prevalence includes patients potentially cured from the disease and therefore  with a care demand is expected to be far smalle than average. When wederive prevalence  numerically from CR data,<span class="superscript">16</span> invariably we refer  always to the past. With the aim to provide useful information for public health,  health planning, the allocation of financial and health care resources, we need  to provide prevalence figures for coming years, and not the past. The MIAMOD method  can allow a CR to provide administrators, practitioners, heath structures and  general public with information on the future cancer burden in their area.    <br>  </p>    <p>The MIAMOD software, equipped with a very user friendly interface is available,  free of charge, on request to Dr. Roberta De Angelis (e-mail: rodeange@iss.it).  Using the method correctly, however requires some statistical and modelling knowledge,  in addition to these basic features explained.    <br> </p>    <p>A first introductory  course on modeling cancer incidence and mortality with MIAMOD will be organized  in Italy, early December 2003. Other courses will follow on the basis of interest.  Readers interested in further information on the MIAMOD software and courses may  feel free to contact Dr. Roberta De Angelis, email: rodeange@iss.it. </p><h4>RESUMEN</h4>    <p>  Los m&eacute;todos que habitualmente se utilizan para evaluar el completamiento  y la calidad de las informaciones del Registro del C&aacute;ncer comprenden indicadores  sencillos e indirectos como son la proporci&oacute;n de casos con certificados  de defunci&oacute;n (casos DCO), la proporci&oacute;n de casos con confirmaci&oacute;n  microsc&oacute;pica, la relaci&oacute;n incidencia-mortalidad, etc. Se propone  en este trabajo la modelaci&oacute;n de la incidencia del c&aacute;ncer, la mortalidad  y la supervivencia en un marco unificado como m&eacute;todo adecuado para chequear  la consistencia de las informaciones del Registro del C&aacute;ncer con un proceso  que se cierra solo cuando los datos sobre mortalidad, incidencia y supervivencia  del paciente son completos y tienen una gran calidad. El m&eacute;todo MIAMOD  se desarroll&oacute; para brindar estimados y proyecciones referidos a la incidencia,  prevalencia y mortalidad, utilizando la informaci&oacute;n sobre mortalidad y  supervivencia de los pacientes a nivel nacional o regional. Se ofrecen ejemplos  de la aplicaci&oacute;n del m&eacute;todo MIAMOD en los registros nacionales del  c&aacute;ncer en Europa para mostrar el comportamiento del m&eacute;todo en la  revisi&oacute;n de las informaciones del Registro del C&aacute;ncer en lo que  respecta a la consistencia interna y el completamiento de la informaci&oacute;n.  Proponemos el m&eacute;todo y el software MIAMOD como una herramienta &uacute;til  para chequear el completamiento y la calidad de las mencionadas informaciones  y para brindar informaci&oacute;n futura sobre el peso del c&aacute;ncer en los  planes de salud y en la asignaci&oacute;n de recursos para esta esfera. </p>    <p><b>Palabras  clave:</b> Metodos epidemiologicos, cAncer, incidencia, mortalidad.    <br> </p><h4>Referencias  bibliogr&aacute;ficas </h4><ol>     <li> Verdecchia A, Capocaccia R, Egidi V, Golini  A. A method for the estimation of chronic disease morbidity and trend from mortality  data. Stat Med 1989;8: 201-16.    <br> </li>    ]]></body>
<body><![CDATA[<li> De Angelis G, De Angelis R, Frova  L, Verdecchia A. MIAMOD: a computer program to estimate chronic disease morbidity  using mortality and survival data. Comput Methods Programs Biomed 1994;44: 99-107.    <br>  </li>    <li> Durrleman S, Simon R. &#145;Flexible Regression Models with Cubic Splines&#146;.  Stat Medicine 1989; 8:551-61.     <br> </li>    <li> Verdecchia A, De Angelis R, Capocaccia  R, Sant M, Micheli A, Gatta G, et al. The cure of colon cancer: results from the  Eurocare Study. Int J Cancer 1998;77: 322-29.    <br> </li>    <li> De Angelis R, Capocaccia  R, Hakulinen T, Soderman B, Verdecchia A. Mixture models for cancer survival analysis:  application to population-based data with covariates. Stat Med 1999; 18: 441-54.    <br>  </li>    <li> Capocaccia R, Verdecchia A, Micheli A, Sant M, Gatta G, Berrino F. Breast  cancer incidence and prevalence estimated from survival and mortality. Cancer  Causes Control 1990;1:23-30.    <br> </li>    ]]></body>
<body><![CDATA[<li> Capocaccia R, Micheli A, Berrino F,  Gatta G, Sant M, Ruzza MR, et al. Time trends of lung and larynx cancers in Italy.  Int J Cancer 1994;57:1-8.    <br> </li>    <li> Capocaccia R, De Angelis R, Frova L, Sant  M, Buratti E, Gatta G, et al. Estimation and projections of stomach cancer trends  in Italy. Cancer Causes Control 1995;6: 339-46.    <br> </li>    <li> Capocaccia R, De  Angelis R, Frova L, Gatta G, Sant M, Micheli A, et al. Estimation and projections  of colorectal cancer trends in Italy. Int J Epidem 1997;26: 924-32.    <br> </li>    <li>  Verdecchia A, Mariotto A, Capocaccia R, Gatta G, Micheli A, Sant M, et al. Incidence  and prevalence of all cancerous diseases in Italy: trends and implications. Eur  J Cancer 2001;37: 1149-57.    <br> </li>    <li> Micheli A. Cancer prevalence in Italy:  the ITAPREVAL Study. Tumori 1999; 85:400-7.    <br> </li>    ]]></body>
<body><![CDATA[<li> Micheli A, Verdecchia  A, Capocaccia R, De Angelis G, Gatta G, Sant M, et al. Estimated incidence and  prevalence of female breast cancer in Italian Regions. Tumori 1992;78:13-21.    <br>  </li>    <li> De Angelis R, Valente F, Frova L, Verdecchia A, Gatta G, Chessa E, et  al. Trends of colorectal cancer incidence and prevalence in Italian Regions. Tumori  1998;84:1-8.    <br> </li>    <li> De Angelis R, Valente F, Frova L, Capocaccia R, Micheli  A, Chessa E, et al. Incidence, mortality and prevalence of stomach cancer in Italian  Regions. Tumori 1996; 82:314-20.    <br> </li>    <li> Effect of NHS Breast Cancer Screening  Programme on Mortality from Breast Cancer in England and Wales, 1990-8: Comparison  of Observed with Predicted Mortality. BMJ 2000;320(35): 665-69.     <br> </li>    <li>  Krogh V, Micheli A. A measure of cancer prevalence with a computerized program:  an example of larynx cancer. Tumori 1996;82:1-4.</li>    </ol>    ]]></body>
<body><![CDATA[<p>Recibido: 10 de septiembre  de 2003. Aprobado: 11 de diciembre de 2003.    <br> Arduino Verdecchia. Instituto  Superiore di Sanit&aacute; Lab. Epidemiolog&iacute;a e Biostatistica. Reparto  Indicatori sorveglianza sanitaria. Viale Regina Elena 299, 00161 Roma e-mail:<a href="mailto:verdeck@iss.it">verdeck@iss.it</a></p>    <p><a href="#autor"><b class="superscript">1</b>  Medical Doctor. Epidemiology y Bioestatistic. </a><a name="cargo"></a></p>      ]]></body><back>
<ref-list>
<ref id="B1">
<label>1</label><nlm-citation citation-type="journal">
<person-group person-group-type="author">
<name>
<surname><![CDATA[Verdecchia]]></surname>
<given-names><![CDATA[A]]></given-names>
</name>
<name>
<surname><![CDATA[Capocaccia]]></surname>
<given-names><![CDATA[R]]></given-names>
</name>
<name>
<surname><![CDATA[Egidi]]></surname>
<given-names><![CDATA[V]]></given-names>
</name>
<name>
<surname><![CDATA[Golini]]></surname>
<given-names><![CDATA[A]]></given-names>
</name>
</person-group>
<article-title xml:lang="en"><![CDATA[A method for the estimation of chronic disease morbidity and trend from mortality data]]></article-title>
<source><![CDATA[Stat Med]]></source>
<year>1989</year>
<volume>8</volume>
<page-range>201-16</page-range></nlm-citation>
</ref>
<ref id="B2">
<label>2</label><nlm-citation citation-type="journal">
<person-group person-group-type="author">
<name>
<surname><![CDATA[De Angelis]]></surname>
<given-names><![CDATA[G]]></given-names>
</name>
<name>
<surname><![CDATA[De Angelis]]></surname>
<given-names><![CDATA[R]]></given-names>
</name>
<name>
<surname><![CDATA[Frova]]></surname>
<given-names><![CDATA[L]]></given-names>
</name>
<name>
<surname><![CDATA[Verdecchia]]></surname>
<given-names><![CDATA[A]]></given-names>
</name>
</person-group>
<article-title xml:lang="en"><![CDATA[MIAMOD: a computer program to estimate chronic disease morbidity using mortality and survival data]]></article-title>
<source><![CDATA[Comput Methods Programs Biomed]]></source>
<year>1994</year>
<volume>44</volume>
<page-range>99-107</page-range></nlm-citation>
</ref>
<ref id="B3">
<nlm-citation citation-type="journal">
<person-group person-group-type="author">
<name>
<surname><![CDATA[Durrleman]]></surname>
<given-names><![CDATA[S]]></given-names>
</name>
<name>
<surname><![CDATA[Simon]]></surname>
<given-names><![CDATA[R]]></given-names>
</name>
</person-group>
<article-title xml:lang="en"><![CDATA[Flexible Regression Models with Cubic Splines]]></article-title>
<source><![CDATA[Stat Medicine]]></source>
<year>1989</year>
<volume>8</volume>
<page-range>551-61</page-range></nlm-citation>
</ref>
<ref id="B4">
<label>4</label><nlm-citation citation-type="journal">
<person-group person-group-type="author">
<name>
<surname><![CDATA[Verdecchia]]></surname>
<given-names><![CDATA[A]]></given-names>
</name>
<name>
<surname><![CDATA[De Angelis]]></surname>
<given-names><![CDATA[R]]></given-names>
</name>
<name>
<surname><![CDATA[Capocaccia]]></surname>
<given-names><![CDATA[R]]></given-names>
</name>
<name>
<surname><![CDATA[Sant]]></surname>
<given-names><![CDATA[M]]></given-names>
</name>
<name>
<surname><![CDATA[Micheli]]></surname>
<given-names><![CDATA[A]]></given-names>
</name>
<name>
<surname><![CDATA[Gatta]]></surname>
<given-names><![CDATA[G]]></given-names>
</name>
</person-group>
<article-title xml:lang="en"><![CDATA[The cure of colon cancer: results from the Eurocare Study]]></article-title>
<source><![CDATA[Int J Cancer]]></source>
<year>1998</year>
<volume>77</volume>
<page-range>322-29</page-range></nlm-citation>
</ref>
<ref id="B5">
<label>5</label><nlm-citation citation-type="journal">
<person-group person-group-type="author">
<name>
<surname><![CDATA[De Angelis]]></surname>
<given-names><![CDATA[R]]></given-names>
</name>
<name>
<surname><![CDATA[Capocaccia]]></surname>
<given-names><![CDATA[R]]></given-names>
</name>
<name>
<surname><![CDATA[Hakulinen]]></surname>
<given-names><![CDATA[T]]></given-names>
</name>
<name>
<surname><![CDATA[Soderman]]></surname>
<given-names><![CDATA[B]]></given-names>
</name>
<name>
<surname><![CDATA[Verdecchia]]></surname>
<given-names><![CDATA[A]]></given-names>
</name>
</person-group>
<article-title xml:lang="en"><![CDATA[Mixture models for cancer survival analysis: application to population-based data with covariates]]></article-title>
<source><![CDATA[Stat Med]]></source>
<year>1999</year>
<volume>18</volume>
<page-range>441-54</page-range></nlm-citation>
</ref>
<ref id="B6">
<label>6</label><nlm-citation citation-type="journal">
<person-group person-group-type="author">
<name>
<surname><![CDATA[Capocaccia]]></surname>
<given-names><![CDATA[R]]></given-names>
</name>
<name>
<surname><![CDATA[Verdecchia]]></surname>
<given-names><![CDATA[A]]></given-names>
</name>
<name>
<surname><![CDATA[Micheli]]></surname>
<given-names><![CDATA[A]]></given-names>
</name>
<name>
<surname><![CDATA[Sant]]></surname>
<given-names><![CDATA[M]]></given-names>
</name>
<name>
<surname><![CDATA[Gatta]]></surname>
<given-names><![CDATA[G]]></given-names>
</name>
<name>
<surname><![CDATA[Berrino]]></surname>
<given-names><![CDATA[F]]></given-names>
</name>
</person-group>
<article-title xml:lang="en"><![CDATA[Breast cancer incidence and prevalence estimated from survival and mortality]]></article-title>
<source><![CDATA[Cancer Causes Control]]></source>
<year>1990</year>
<volume>1</volume>
<page-range>23-30</page-range></nlm-citation>
</ref>
<ref id="B7">
<label>7</label><nlm-citation citation-type="journal">
<person-group person-group-type="author">
<name>
<surname><![CDATA[Capocaccia]]></surname>
<given-names><![CDATA[R]]></given-names>
</name>
<name>
<surname><![CDATA[Micheli]]></surname>
<given-names><![CDATA[A]]></given-names>
</name>
<name>
<surname><![CDATA[Berrino]]></surname>
<given-names><![CDATA[F]]></given-names>
</name>
<name>
<surname><![CDATA[Gatta]]></surname>
<given-names><![CDATA[G]]></given-names>
</name>
<name>
<surname><![CDATA[Sant]]></surname>
<given-names><![CDATA[M]]></given-names>
</name>
<name>
<surname><![CDATA[Ruzza]]></surname>
<given-names><![CDATA[MR]]></given-names>
</name>
</person-group>
<article-title xml:lang="en"><![CDATA[Time trends of lung and larynx cancers in Italy]]></article-title>
<source><![CDATA[Int J Cancer]]></source>
<year>1994</year>
<volume>57</volume>
<page-range>1-8</page-range></nlm-citation>
</ref>
<ref id="B8">
<label>8</label><nlm-citation citation-type="journal">
<person-group person-group-type="author">
<name>
<surname><![CDATA[Capocaccia]]></surname>
<given-names><![CDATA[R]]></given-names>
</name>
<name>
<surname><![CDATA[De Angelis]]></surname>
<given-names><![CDATA[R]]></given-names>
</name>
<name>
<surname><![CDATA[Frova]]></surname>
<given-names><![CDATA[L]]></given-names>
</name>
<name>
<surname><![CDATA[Sant]]></surname>
<given-names><![CDATA[M]]></given-names>
</name>
<name>
<surname><![CDATA[Buratti]]></surname>
<given-names><![CDATA[E]]></given-names>
</name>
<name>
<surname><![CDATA[Gatta]]></surname>
<given-names><![CDATA[G]]></given-names>
</name>
</person-group>
<article-title xml:lang="en"><![CDATA[Estimation and projections of stomach cancer trends in Italy]]></article-title>
<source><![CDATA[Cancer Causes Control]]></source>
<year>1995</year>
<volume>6</volume>
<page-range>339-46</page-range></nlm-citation>
</ref>
<ref id="B9">
<label>9</label><nlm-citation citation-type="journal">
<person-group person-group-type="author">
<name>
<surname><![CDATA[Capocaccia]]></surname>
<given-names><![CDATA[R]]></given-names>
</name>
<name>
<surname><![CDATA[De Angelis]]></surname>
<given-names><![CDATA[R]]></given-names>
</name>
<name>
<surname><![CDATA[Frova]]></surname>
<given-names><![CDATA[L]]></given-names>
</name>
<name>
<surname><![CDATA[Gatta]]></surname>
<given-names><![CDATA[G]]></given-names>
</name>
<name>
<surname><![CDATA[Sant]]></surname>
<given-names><![CDATA[M]]></given-names>
</name>
<name>
<surname><![CDATA[Micheli]]></surname>
<given-names><![CDATA[A]]></given-names>
</name>
</person-group>
<article-title xml:lang="en"><![CDATA[Estimation and projections of colorectal cancer trends in Italy]]></article-title>
<source><![CDATA[Int J Epidem]]></source>
<year>1997</year>
<volume>26</volume>
<page-range>924-32</page-range></nlm-citation>
</ref>
<ref id="B10">
<label>10</label><nlm-citation citation-type="journal">
<person-group person-group-type="author">
<name>
<surname><![CDATA[Verdecchia]]></surname>
<given-names><![CDATA[A]]></given-names>
</name>
<name>
<surname><![CDATA[Mariotto]]></surname>
<given-names><![CDATA[A]]></given-names>
</name>
<name>
<surname><![CDATA[Capocaccia]]></surname>
<given-names><![CDATA[R]]></given-names>
</name>
<name>
<surname><![CDATA[Gatta]]></surname>
<given-names><![CDATA[G]]></given-names>
</name>
<name>
<surname><![CDATA[Micheli]]></surname>
<given-names><![CDATA[A]]></given-names>
</name>
<name>
<surname><![CDATA[Sant]]></surname>
<given-names><![CDATA[M]]></given-names>
</name>
</person-group>
<article-title xml:lang="en"><![CDATA[Incidence and prevalence of all cancerous diseases in Italy: trends and implications]]></article-title>
<source><![CDATA[Eur J Cancer]]></source>
<year>2001</year>
<volume>37</volume>
<page-range>1149-57</page-range></nlm-citation>
</ref>
<ref id="B11">
<label>11</label><nlm-citation citation-type="journal">
<person-group person-group-type="author">
<name>
<surname><![CDATA[Micheli]]></surname>
<given-names><![CDATA[A]]></given-names>
</name>
</person-group>
<article-title xml:lang="en"><![CDATA[Cancer prevalence in Italy: the ITAPREVAL Study]]></article-title>
<source><![CDATA[Tumori]]></source>
<year>1999</year>
<volume>85</volume>
<page-range>400-7</page-range></nlm-citation>
</ref>
<ref id="B12">
<label>12</label><nlm-citation citation-type="journal">
<person-group person-group-type="author">
<name>
<surname><![CDATA[Micheli]]></surname>
<given-names><![CDATA[A]]></given-names>
</name>
<name>
<surname><![CDATA[Verdecchia]]></surname>
<given-names><![CDATA[A]]></given-names>
</name>
<name>
<surname><![CDATA[Capocaccia]]></surname>
<given-names><![CDATA[R]]></given-names>
</name>
<name>
<surname><![CDATA[De Angelis]]></surname>
<given-names><![CDATA[G]]></given-names>
</name>
<name>
<surname><![CDATA[Gatta]]></surname>
<given-names><![CDATA[G]]></given-names>
</name>
<name>
<surname><![CDATA[Sant]]></surname>
<given-names><![CDATA[M]]></given-names>
</name>
</person-group>
<article-title xml:lang="en"><![CDATA[Estimated incidence and prevalence of female breast cancer in Italian Regions]]></article-title>
<source><![CDATA[Tumori]]></source>
<year>1992</year>
<volume>78</volume>
<page-range>13-21</page-range></nlm-citation>
</ref>
<ref id="B13">
<label>13</label><nlm-citation citation-type="journal">
<person-group person-group-type="author">
<name>
<surname><![CDATA[Angelis]]></surname>
<given-names><![CDATA[R]]></given-names>
</name>
<name>
<surname><![CDATA[Valente]]></surname>
<given-names><![CDATA[F]]></given-names>
</name>
<name>
<surname><![CDATA[Frova]]></surname>
<given-names><![CDATA[L]]></given-names>
</name>
<name>
<surname><![CDATA[Verdecchia]]></surname>
<given-names><![CDATA[A]]></given-names>
</name>
<name>
<surname><![CDATA[Gatta]]></surname>
<given-names><![CDATA[G]]></given-names>
</name>
<name>
<surname><![CDATA[Chessa]]></surname>
<given-names><![CDATA[E]]></given-names>
</name>
</person-group>
<article-title xml:lang="en"><![CDATA[Trends of colorectal cancer incidence and prevalence in Italian Regions]]></article-title>
<source><![CDATA[Tumori]]></source>
<year>1998</year>
<volume>84</volume>
<page-range>1-8</page-range></nlm-citation>
</ref>
<ref id="B14">
<label>14</label><nlm-citation citation-type="journal">
<person-group person-group-type="author">
<name>
<surname><![CDATA[De Angelis]]></surname>
<given-names><![CDATA[R]]></given-names>
</name>
<name>
<surname><![CDATA[Valente]]></surname>
<given-names><![CDATA[F]]></given-names>
</name>
<name>
<surname><![CDATA[Frova]]></surname>
<given-names><![CDATA[L]]></given-names>
</name>
<name>
<surname><![CDATA[Capocaccia]]></surname>
<given-names><![CDATA[R]]></given-names>
</name>
<name>
<surname><![CDATA[Micheli]]></surname>
<given-names><![CDATA[A]]></given-names>
</name>
<name>
<surname><![CDATA[Chessa]]></surname>
<given-names><![CDATA[E]]></given-names>
</name>
</person-group>
<article-title xml:lang="en"><![CDATA[Incidence, mortality and prevalence of stomach cancer in Italian Regions]]></article-title>
<source><![CDATA[Tumori]]></source>
<year>1996</year>
<volume>82</volume>
<page-range>314-20</page-range></nlm-citation>
</ref>
<ref id="B15">
<label>15</label><nlm-citation citation-type="journal">
<article-title xml:lang="en"><![CDATA[Effect of NHS Breast Cancer Screening Programme on Mortality from Breast Cancer in England and Wales, 1990-8: Comparison of Observed with Predicted Mortality]]></article-title>
<source><![CDATA[BMJ]]></source>
<year>2000</year>
<volume>320</volume>
<numero>35</numero>
<issue>35</issue>
<page-range>665-69</page-range></nlm-citation>
</ref>
<ref id="B16">
<label>16</label><nlm-citation citation-type="journal">
<person-group person-group-type="author">
<name>
<surname><![CDATA[Krogh]]></surname>
<given-names><![CDATA[V]]></given-names>
</name>
<name>
<surname><![CDATA[Micheli]]></surname>
<given-names><![CDATA[A]]></given-names>
</name>
</person-group>
<article-title xml:lang="en"><![CDATA[A measure of cancer prevalence with a computerized program: an example of larynx cancer]]></article-title>
<source><![CDATA[Tumori]]></source>
<year>1996</year>
<volume>82</volume>
<page-range>1-4</page-range></nlm-citation>
</ref>
</ref-list>
</back>
</article>
