


 Custom services
 Spanish (pdf)
 Article in xml format
 Article references
 Send this article by e-mail
 Cited by SciELO
  Similars in
SciELO
Similars in
SciELO 
 Permalink
Introduction
Airfoils are elements used in aeronautics to interact with the aerodynamic forces, drag and lift. In the case of drag forces, it is sought that these be minimal, while in the case of lift forces, it is sought that they be maximized. To promote the high lift conditions, additional elements are added to the aerodynamic airfoil, these elements are placed in the leading edge and on the trailing edge, known as slat and flap, respectively. In the specific case of the flap, its function is to extend the length of the airfoil causing the delay in the detachment of the boundary layer. By delaying the detachment of boundary layer, the drag force decreases, and the lift force increases. Modifying these forces improves the flight conditions of any aircraft. Different experimental and numerical investigations have been carried out to evaluate the use of flaps in airfoils. Bissonette and Bramesfeld [1] studied the effects of wake shapes on flap airfoil performance. They analyzed the variations of lift and drag by varying the shapes of the flow wake. They found that inducing the shape of the wake improves the aerodynamic performance of the airfoil at different flap angles. Hosseini and van Dam [2] studied the feasibility of using flow dumps, as an active control method, near the flap trailing edge of an NLR-7301 airfoil. They characterized the flow using computational fluid dynamics. They found that with a coefficient of momentum Cμ = 0.01 improvements were observed in the drag and lift coefficients. James et al. used airfoils 0012 and LA203A [3] to analyze the effects of flow injection, at different chord percentages and velocities, on the control of boundary layer separation. They found a 9.45 increase in lift using a ratio of 0.2 between main flow velocity and injection velocity. Keller [4] optimized a high-lift model using Krueger-type flaps on the leading edge and fixed flaps on the trailing edge of the airfoil in a three-dimensional model under laminar flow conditions. He obtained an increase in the lift coefficient of 2.85. Haucke and Nitsche [5] studied a high lift DLR-F15 airfoil with flap including an active boundary layer control system. They carried out experimental measurements in a wind tunnel using the particle image velocimetry technique. They observed increases in the coefficient of lift, with the greatest magnitude being obtained at 8 degrees of angle of attack. Gopalakrishnan and Taira [6] studied the modifications of airflow wake employing a Gurney flap. They found four wake modes which affects the aerodynamic performance.
According to Koch [7, 8] it is possible to analyze the energy losses of the flow due to instabilities by means of the local production of entropy method. They studied a Francis-type hydraulic turbine and using the mentioned method they conclude that its application to the study of fluids is feasible since, unlike the pressure loss method, it is possible to identify the areas where these occur. Reza et al. [9] studied the relationship between flow separation and entropy production in various profiles used in wind turbines. It was observed that there is a relationship between the production of entropy and the drag coefficient. Reza et al. [10] published an investigation in which, by means of computational fluid dynamics, the entropy production was studied in a NACA 0012 airfoil at different angles of attack. It was found that the higher production of entropy occurs in the pressure side and is mainly caused by the viscosity of the fluid and the production of turbulent fluctuations.
In this work, the local production of entropy method will be applied to visualize the energy losses in a high-lift airfoil with a DLR-F15 type flap using three different Reynolds numbers,. Re. Numerical simulations by means of computational fluid dynamics will be employed to calculate the variables required to compute the local entropy generation generated due to velocity fluctuations. The behavior of the flow will be analyzed and a relationship between entropy and 𝑅𝑒 will be discussed.
Methods
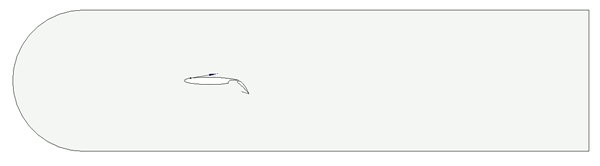
In this research, the generation of local entropy was analyzed in a 2D model of a DLR-F15 airfoil with two elements, airfoil, and flap, under maximum opening conditions as shown in figure 1. The model has a chord of 0.6 m and a wingspan of 1.55 m. The dimensions of the flow channel were taken from the work presented in [5] where a modular type test area with 4 blocks of 2.5 m length and a cross section of 2 x 1.4 m was considered.
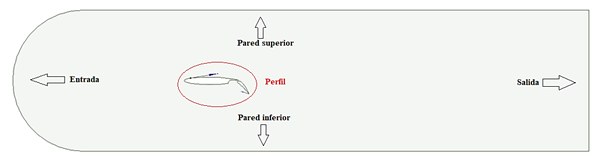
For numerical calculations, computational fluid dynamics was used by means of Ansys software academic version. The flow domain for the characterization of the model was type C. The boundary conditions used in the simulation are presented in figure 2. Velocity was set as boundary condition at inlet domain. The outlet was assigned as pressure condition, while the upper and lower edges of the domain were defined as wall. Both the suction and pressure side of the airfoil were defined as a wall. An area of 0.93 m2 resulting from multiplying chord and span of the airfoil was considered.
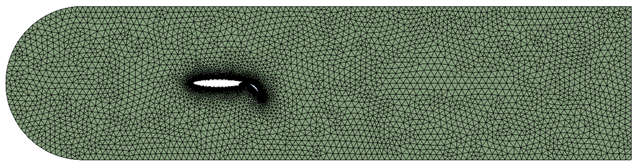
The model was discretized using triangular elements with refinement in the section of the airfoils as shown in figure 3. The mesh size was 83,500 tetrahedral elements. The turbulence model used was k - ωSST due to the equations for the calculation of entropy.
The generation of entropy,  , by a turbulent flow occurs mainly due to velocity fluctuations. To calculate this expression, the velocity fluctuations, and its components,
  are required. These variables cannot be calculated directly. In this research, as proposed in [8, 11], entropy is obtained through numerical calculations using the turbulence model k - ωSST [12], the entropy production in entire domain was approximated by the following equation (1):
 (1)
(1)
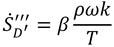
Here β = 0.09 is a constant from k - ωSST turbulence model, ρ is the fluid density, k is the turbulent kinetic energy, ω is the turbulent dissipation rate and T = 300 K is the fluid temperature.
The total local entropy in the flow domain was calculated by equation (2):
 (2)
(2)
Where A is the area domain. Calculations were performed using three values of Re, 0.5e6, 1e6 and 5e6.
Results and Discussion
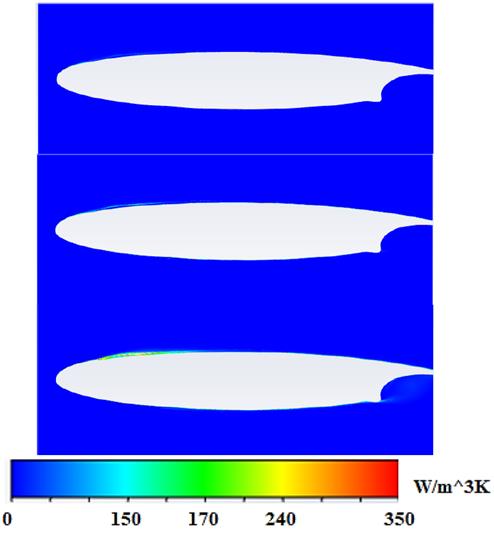
Figure 4 shows the results of the local entropy production in the airfoil for the proposed 𝑅𝑒 values. It is observed that the zone where the greatest generation of entropy occurs is downstream of the leading edge, approximately at 10 % of chord, being of greater magnitude at Re =5e6. At same Re it is observed that entropy is produced in the area where the pressure side changes its shape. This is due to the increase in the kinetic energy of the fluid, which cannot follow the shape of the airfoil, accumulating energy losses in that section.
In the flap there is more evidence of the impact of Re in entropy generation. That increase occurs in two zones that are downstream of the leading edge and in the trailing edge. Additionally, it is observed that at higher Re, the generation of entropy occurs also at the trailing edge of the airfoil. At Re = 5e6 a slight increase in entropy is observed on the suction side of the flap. Considering that in the flow wake the turbulence increases, it is concluded that there is a relationship with the increase of entropy in flow when observing that at Re = 1e6 and Re = 5e6, where the wakes develop, the entropy is of greater intensity. At maximum opening of the flap, the detachment of the boundary layer is affected approximately 20 % of the chord of the suction side, this location coinciding with the increase in entropy in the flap, figure 5.
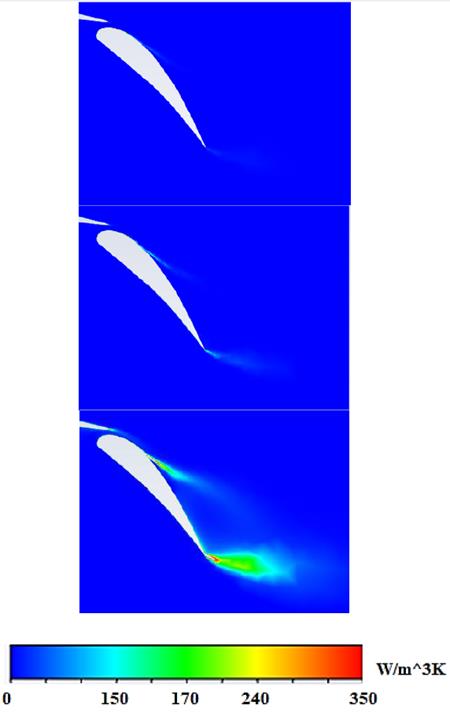
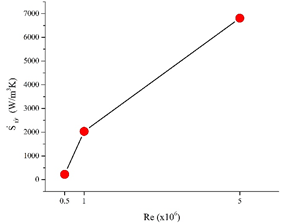
Figure 6 shows a comparison of the total entropy in the full domain calculated using equation (2). Increasing by doubling Re from 0.5e6 to 1e6 the entropy of the system increases about 8x while increasing 5 times from 1e6 to 5e6 the entropy decreases its rate of increase about 2x. The rate of entropy growth decreases as Re increases.
In other investigations related to flow control over flaps, drag and lift have been investigated, as well as pressure losses. In this work, the existing information is complemented since the zones where these losses occur are located through the entropy production method, however, it is necessary to establish the relationship between the behavior of the aerodynamic coefficients, drag and lift, with the entropy change due to flow fluctuations. Likewise, the use of the mentioned method demonstrates that it is possible to use it in phenomena related to the behavior of the flow that occur in aeronautics.
Conclusions
In the present study, the variation of entropy generation as a function of 𝑅𝑒 was analyzed using computational fluid dynamics in a high-lift airfoil DLR-F15 with flaps at maximum opening conditions. The zones where the boundary layer separation occurs were identified thanks to the generation of entropy, being, both in the airfoil and in the flap, around 20 and 10 % of the length of the chord, respectively. It is concluded that in these areas the detachment of the boundary layer will begin. Likewise, in the flap there is an increase in entropy downstream of the trailing edge. Increasing 𝑅𝑒 the growth rate entropy it decreases.

