


 Custom services
 English (pdf)
 Article in xml format
 Article references
 Send this article by e-mail
 Cited by SciELO
  Similars in
SciELO
Similars in
SciELO 
 Permalink
Introduction
Rice is produced in more than 100 countries, and it is a staple food for more than half of the world's population (Chandra, et al., 2012). Moreover, rice is considered the third most important agricultural crop globally in terms of total cultivated area and production, and it is estimated that by 2025, rice production will reach 760 million tons, which would generate approximately 1.140 billion tons of harvest residues (rice straw). This residue can be biodegraded via anaerobic digestion, a process that generates biogas (renewable fuel) and a digestate that can be used as a biofertilizer (Wang, et al., 2009). The reuse of this straw reduces the use of fossil fuels for energy production and thus reduces the emission of greenhouse gases (He, et al., 2008; Gurung & Oh, 2015). Composting, solid-state fermentation and anaerobic digestion stand out among the strategies for rice straw treatment (Sebola, et al., 2014; Liu, et al., 2016). In recent decades, considering the biodegradation power of rice straw, anaerobic digestion has been very attractive (Wang, et al., 2009).
Annually, Cuba produces approximately 418,000 t of rice in an area of 112,166 ha in two harvests, which generates 585,506 tons of crop residues. Studies carried out in the country by López, et al. (2012), demonstrate the possibility of treating harvest residues (straw) of cane, rice, corn, plantain, beans, coffee and bagasse via anaerobic digestion using a sludge adapted to porcine manure as an inoculum; they reported biogas potential values above 150 L/kgSTV (liters per total volatile solids). Additionally, 95% of the power production matrix is based on thermal plants that use fossil fuels. Therefore, the use of rice straw for energy purposes can increase energy production based on renewable sources while contributing to the mitigation of the environmental impact.
However, studies that demonstrate the advantages of using these technologies to transform agricultural residue into energy are still limited. Thus, it is necessary to apply innovative tools that modify the current approaches used to assess the environmental impact. In this regard, studies conducted worldwide show that emergy analysis is a useful tool for environmental accounting and the evaluation of ecosystems (Aguilar, et al., 2015; Liu, et al., 2016; Zhai, et al., 2017).
Emergy is defined as the amount of solar energy directly or indirectly needed to support a given system and its level of organization. Odum (1996), states that all processes of self-organization of systems (ecosystems) are governed by the laws of ecology and thermodynamics such that the energy that passes from a lower level of self-organization to a higher level of self-organization decreases at each step, as it is not possible to achieve perfect (100%) efficiency during the transformation process; additionally, the energy needed to achieve higher levels of self-organization grows as the system becomes more complex (Odum, et al., 2000). This process, in which energy flows are greatest at the lowest levels of system organization and lowest at the highest levels of system organization, is known as the evolution of the energy hierarchy. As this occurs, the amount of energy decreases, and the quality of the energy increases.
The evaluation of system sustainability via emergetic analysis allows not only the quantification of parameters but also the analysis of the consequences and interrelationships of the economic and environmental aspects of said processes in the long term. That is, the methodology of emergetic analysis accounts for the use of all the resources required for the creation of a product or service (energy production) and assesses the environmental degradation caused by waste (carbon sinks) and the management that can be applied to them so that they are economically and socially viable (Brown, et al., 2012).
Thus, the objective of this work is to evaluate the management of rice straw as agricultural waste, considering its incorporation into the soil (a method currently used in Cuba) and the recovery of energy via anaerobic digestion. Three new energy management schemes are proposed. To achieve this goal, emergy analysis is used, including the calculation of emergy indices (i.e., environmental loading ratio (ELR), emergy yield ratio (EYR), emergy investment ratio (EIR), emergy exchange ratio (EER) and emergy sustainability index (ESI)), to evaluate the dependence of a productive system on the renewable, non-renewable resources and imported resources.
Materials and methods
An emergy analysis method based on the study of Odum (1996), in which emergy flows and emergetic ratios were calculated, is applied to each of the alternatives studied. The values of the transformation indices used were reported by other authors in similar studies (Guillén, 2002; Cano 2010; Wang, et al., 2015; Wang, et al., 2018).
The data are obtained from the Grain Company ("Sur del Jíbaro"), which has an area of 15,282.7 ha dedicated to the cultivation of rice. It produces 40,000 t of rice annually, and is located in the province of Sancti Spíritus, Cuba (Located in the central region, between 21 ° 32 ', 22 ° 27' north latitude and 78 ° 56 ', 80 ° 07' west longitude). This company was selected for the case study, because it is representative of the technological, productive and environmental conditions of the country, and 80% of the rice crops are gown under these same conditions (Table 1).
In this investigation, according to what was reported by Contreras, et al. (2014); and Bravo, et al. (2018), four alternatives are proposed for analysis, three of which consider the energy valorisation of rice straw via anaerobic digestion. Their energy valorisation are in the Table 1.
Table 1 - Flows of the inputs and outputs of the alternatives for energy valorisation of rice straw.
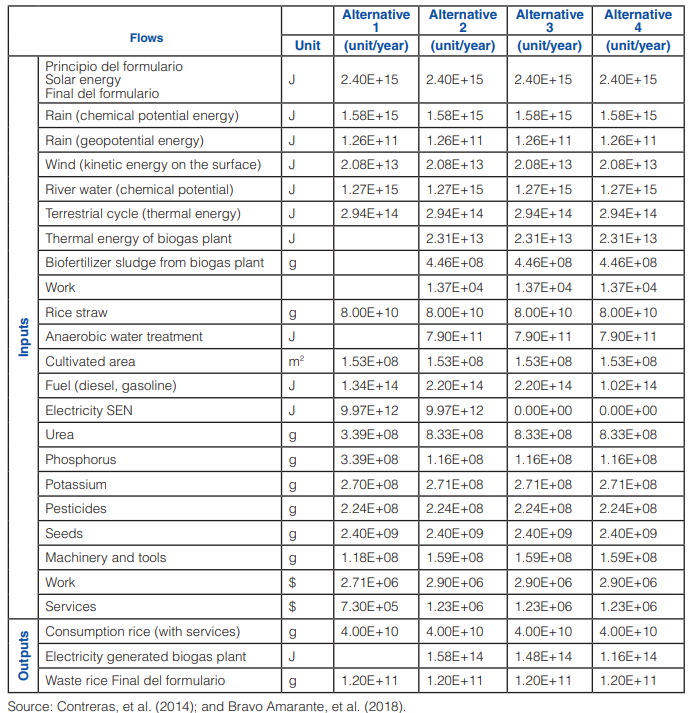
The alternatives studies in this report are:
Alternative 1: This is the most basic scenario and describes the rice (main product) production system that is currently used, wherein all the straw (by-product) generated during harvest is incorporated into the soil to prepare the land for future rice cultivation. This process allows the nutrients contained in the rice straw to be incorporated into the soil on the basis of its natural decomposition, thus improving the productive characteristics of the soil.
Alternative 2: Rice as the main product, this alternative considers the production of electricity from the biogas produced by anaerobic digestion of all rice straw. All electrical power generated is delivered to the national electric power system (SEN). According to the availability of rice straw and based on what was reported by Contreras, et al., 2011); and Contreras (2013), an installed capacity of 5 MWh of electricity production is proposed, which will demand 19.46E+6 m3/year of biogas. For this purpose, it was necessary to determine new mass and energy balances for the soil fertilization process, as these are modified by limiting the contribution of the components (i.e., nitrogen (N), phosphorus (P) and potassium (K)) in the soil by the natural decomposition of the rice straw and by the contribution made by the digestate in relation to these components as it is incorporated into the soil as a biofertilizer.
Alternative 3: Rice is the main product, similar to alternative 2; however, this alternative evaluates the production of electricity (5 MWh of installed capacity) on the basis of biogas production (19.46E+6 m3/year) through the anaerobic digestion of the total rice straw produced (by-product); however, only 93% of the power generated is delivered to the SEN, and the rest is used by the company to promote its self-sufficiency by substituting for its consumption of electricity from thermal plants.
Alternative 4: With rice as the main product, this alternative considers that part (17%) of the biogas produced by anaerobic digestion of the total rice straw (by-product), 19.46E+6 m3/year, is used to replace 60% of the diesel fuel that the machinery demands in the harvesting processes (land preparation and compaction of rice straw) and transportation of products (rice, rice straw and digestate) (Cauca, et al., 2011). For this, it is necessary to subject the biogas to a process of purification and compression that generates biomethane. By reducing the availability of biogas and by considering the report by Contreras, et al. (2014), an installed power generation capacity of 4 MWh is proposed.
In three of the four alternatives evaluated, the use of the total straw generated in the fields during harvest for anaerobic digestion is considered according to the biogas plant projected by Contreras, et al. (2014). In that study, a technology was proposed that consisted of a completely stirred tank reactor (CSTR) with a continuous feeding system. The following operational parameters were considered: particle size, 1-3 cm; temperature, 55 ± 2 °C; reactor configuration, CSTR; maximum organic volumetric loading, 4 kgSVm−3d−1(kilogram of volatile solids per cubic meters per day); and a hydraulic residence time of approximately 21 days. The expected yield of biogas under these conditions is 0.271 m3 kgMF−1.
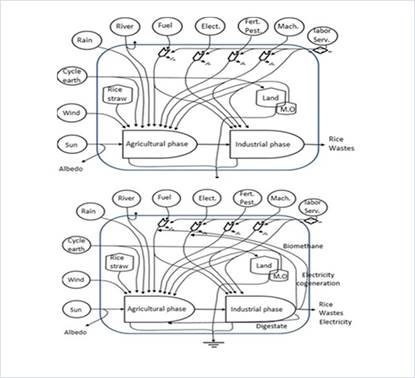
The calculation of the matter and energy flows is carried out and the emergy diagram is constructed for the production alternative currently used and for the three proposed alternatives (Fig. 1). This figure represents all interactions between the totality of both external and internal sources that intervene in the productive ecosystem, as well as their final products. In addition, the emergy corresponding to each flow is calculated, based on transformation factors and specific emergy, according to (Brown & Ulgiati, 2004). The calculations of the emergy flows are based on a reference value of 12.0E24 sej y-1(Brown, et al., 2016). To avoid double counting the co-products of the sun, the renewable source with the highest influx of emergy flows is selected. (Zhou, et al., 2010; Brown, et al., 2017; Fan, et al., 2018) (Appendix 1).
Based on Brown & Ulgiati (2004), and the calculations (Appendix 1), emergy matrices are obtained for each alternative.
Emergy indices.
According to the methodology, the emergy flows of a socio economic-productive system are determined according to their characteristics, renewable sources (R), non-renewable sources (N) and imported inputs (F). On the basis of these classified flows, the following indicators used for decision-making when comparing alternatives are determined; these indicators serve as support for the management and evaluation of the sustainability of the system within the criteria of the methodology used (Cao & Feng, 2007; Brown, et al., 2012; Brown, et al., 2017).
Data source used
The object of the evaluation is the rice production system; the functional unit considered for the study was the production capacity of 40,000 tons of rice per year. To define the limits, the system expansion method was used to obtain adequate information regarding the effect on sustainability of manipulating production systems that are interconnected due to the interrelation between rice production and energy production when rice straw is evaluated energetically. The geographical boundaries considered include all areas the company uses for rice production, and the time limits considered include all the material and energy flows necessary to produce two rice crops annually. Fig. 2 shows the processes incorporated into the agricultural and industrial phases for the evaluation of rice straw for energy purposes.
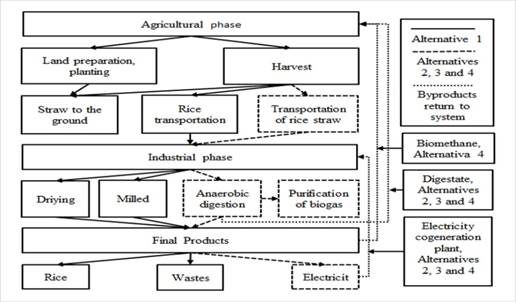
Fig. 2 - Schematic of the processes incorporated into the agricultural and industrial phases of the rice production process for the valorisation of rice straw for energy purposes.
The data used for the biogas plant are those reported by Contreras, et al. (2014), in the study ¨Energetic, environmental and economic potential of the anaerobic treatment of rice straw for the case of the Cuban company ‘Sur del Jíbaro’¨ and modified by Bravo, et al. (2018).
In alternative 1, solar energy, rain (chemical and geopotential potential), wind (kinetic energy on the surface), river water (chemical potential), the thermal energy of the earth and renewable fraction of the rice straw left in the field are considered the renewable inputs (R). Regarding non-renewable local resources (N), only net losses of land (erosion) are considered. Finally, the imported resources (F) are the fuels necessary for land preparation, sowing, harvesting, transportation of wet and dried paddy rice, rice milling electricity, fertilizers, pesticides, seeds, machinery, labour and services.
In alternatives 2, 3 and 4, solar energy, rain (chemical and geopotential potential), wind (kinetic energy on the surface), river water (chemical potential), the thermal energy of the earth and the inputs associated with the production of biogas, such as thermal because it replaces a thermal energy consumption from use of diesel fuel, and labour because increase of jobs, bio-fertilizing sludge and renewable fraction of the rice straw, are considered renewable inputs (R). Regarding non-renewable local resources (N), only the net losses of soil and water used for anaerobic treatment are considered, because it loses quality in its properties. The imported resources (F) are associated with the fuels necessary for land preparation, sowing, harvesting, transportation of wet paddy rice, compaction and transportation of straw, rice milling electricity, fertilizers, pesticides, seeds, machinery, labour and services.
The main biogeophysical inputs to the productive ecosystem under study are identical for the four alternatives, with the highest values being for solar energy and rain (chemical potential) at 2.40E+15 Jy−1 and 1.58E+15 Jy−1, respectively. For alternative 1, renewable fraction of rice straw serves as a source of nutrients to the soil and is considered a renewable resource that contributes to the productive ecosystem; in alternatives 2, 3 and 4, it is used to produce biogas and generate electricity, and the biofertilizer resulting from the anaerobic digestion process acts as a renewable flow that contributes to the productive ecosystem, because it provides the necessary nutrients to restore the productive conditions to the soil.
Results and discussion
The results show that the loss of soil quality was similar for all four alternatives studied, 3.83E+18 sej y−1. However, in the alternatives where energy recovery by anaerobic digestion of rice straw is utilized, these values increase by 6.40E+16 sej y−1, since another non-renewable local source is used, in this case water, for anaerobic treatment and digester feeding. Once this resource is used, it is returned to the ecosystem as part of the digestate that is produced in the biogas plant, but it never returns with its original characteristics, which is why it is considered a non-renewable resource in this research.
Regarding the analysis of renewable resources, emergy from river water (1.03E+20 sej y−1) used for irrigation is the largest renewable input to the process in alternative 1; this result is consistent with that reported by Zhai, et al. (2017). For the other evaluated alternatives, the emergy of this flow is maintained at the same value. However, the emergy contributed by the rice straw when it is evaluated for energy purposes constitutes the largest input, with a value of 7.44E+19 sej y−1, which is different from the values reached when this is available on the ground (1.70E+18 sej y−1) (alternative 1). The remaining biogeophysical inputs are not counted to avoid double counting inputs from the same source (e.g., the sun). In alternatives 2, 3 and 4, other inputs from renewable sources, such as the thermal energy of the biogas (2.63E+18 sej y−1) and the biofertilizer sludge (2.88E+18 sej y−1), are incorporated, as is the necessary increase in labour (3.69E+16 sej y−1) to achieve the modifications in the production system.
The total emergy of renewable inputs have values of 7.95E+19 sej y−1 in alternative 1 and 1.58E+20 sej y−1 in alternatives 2, 3 and 4.
Comparing the four alternatives in terms of the total renewable emergy used, there is a growth in alternatives 2, 3 and 4 of 1.99 times with respect to alternative 1, which is mainly due to the contribution made by the valorisation of the rice straw as an energy source through anaerobic digestion. Thus, rice straw can more efficiently perform its potential work, i.e., its exergy, compared to when it is incorporated into the soil.
New renewable emergy flows associated with the anaerobic digestion of rice straw are incorporated into the system in the new energy schemes proposed in alternatives 2, 3 and 4. These flows are the emergetic flows associated with reincorporating the sludge as a biofertilizer and with the labour required to assume the new tasks incorporated into the production of rice (the latter constituting a flow with a positive social impact).
Imported resources (F)
All inputs in this category are, fundamentally, the materials required to obtain the final products for each alternative that the ecosystem cannot provide as environmental services. For both alternative 1 and the alternatives in which energy recovery through the anaerobic digestion of straw is considered, the resource that presents the greater incidence is the use of fuels, with an emergy value of 1.13E 19 sej y−1 for alternative 1 and 1.84E 19 sej y−1 for alternatives 2 and 3. It represent 1.64 times higher in the latter two, which can be attributed to the need to transfer the rice straw to the biogas plant and the digestate to the field as biofertilizer. Alternative 4 has an emergy value of 8.53E+18 sej y−1, which is 0.7 times that of alternative 1 and 2.1 times less than that of alternatives 2 and 3. This result which can be attributed to the use of biomethane (biogas after being purified) in the internal combustion equipments used to transfer the various materials of the process.
In alternative 1, inorganic fertilizers amount to a combined total annual emergy of 4.87E+18 sej y−1, whereas the value for alternatives 2, 3 and 4 is 5.39E+18 sej y−1, as the fertilizer of these alternatives consists of nitrogen, which is the imported resource with the highest input in this category and has a value of 4.14E+18 sej y−1. In alternatives 2, 3 and 4, where the waste (straw) stops fulfilling its function as a provider of nutrients to the soil, imported inorganic fertilizers must be supplied, which increases the consumption of urea by 1.9 times. In alternative 1, phosphorus fertilizer (P2O5) has a value of 2.22E+18 sej y−1 and is the largest input of the fertilizers consumed.
There is also an increase in the emergy of 1.35 and 1.1 times for machinery/tools and labour, respectively, between alternative 1 and the three alternatives in which rice straw is valorised for energy purposes. This is due to the increase in the use of machinery and the labour required to compact and transport the rice straw and anaerobically treat the straw.
The alternatives 2 and 3 require more imported resources from outside the production system due to the increased use of diesel fuel in the transport of rice straw to the biogas plant and the return of the digestate as bio fertilizer when rice straw is evaluated energetically via anaerobic digestion.
The total emergy input in alternatives 2 and 3 is 1.74 times that in alternative 1. For alternative 4, the total emergy input is 1.63 times that for alternative 1. This is mainly due to the increase in renewable and imported inputs when energetically valorising rice straw.
Regarding the total annual output that enters the socioeconomic system, for alternative 1, renewable inputs represent 66.33%, imported resources 30.48% and non-renewable local sources 3.19%. For alternatives 2 and 3, renewable inputs represent 75.82% and 76.89%, imported resources 22.32% and 21.22% and non-renewable local sources 1.86% and 1.89%, respectively. For alternative 4, renewable inputs represent 80.78%, imported resources 17.24% and non-renewable local sources 1.99%.
For alternatives 2, 3 and 4, renewable inputs have greater growth than imported resources due to the use of anaerobic treatment to energetically evaluated rice straw. Similar results were obtained by (Zhao et al., 2010), who determined the emergy of an agricultural production system including the production of biogas from agricultural waste. The results of this author showed that a biogas project with agricultural waste has a greater dependence on the local input of renewable resources, less environmental pressure and greater sustainability than other typical agricultural systems.
Emergetic ratios: A comparison of the alternatives
As discussed in previous sections, the emergetic analysis separates inputs into renewable sources (R), non-renewable sources (N) and imported resources (F). These distinctions make it possible to define emergetic indicators that provide the tools for decision-making involving sustainability, especially when dealing with several alternatives (Castellini, et al., 2006; Cohen, et al., 2006; Brown, et al., 2012) (Table 2).
Table 2 - Emergetic ratios calculated for each alternative.
| Indicator | Alternative 1 | Alternative 2 | Alternative 3 | Alternative 4 |
|---|---|---|---|---|
| Renewable inputs (R) | 1.05E+20 | 2.08E+20 | 2.08E+20 | 2.08E+20 |
| Non-renewable local inputs (N) | 3.83E+18 | 3.89E+18 | 3.89E+18 | 3.89E+18 |
| Imported resources (F) | 4.05E+19 | 5.43E+19 | 5.14E+19 | 3.80E+19 |
| Total emergy (Y) | 1.50E+20 | 2.67E+20 | 2.64E+20 | 2.50E+20 |
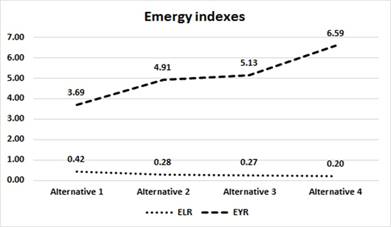
| Environmental load index (ELR) | 0.42 | 0.28 | 0.27 | 0.20 |
| Emergy yield index (EYR) | 3.69 | 4.91 | 5.13 | 6.59 |
| Emergy investment index (EIR) | 0.37 | 0.26 | 0.24 | 0.18 |
| Emergy Exchange Ratio (EER) | 1.93 | 2.32 | 2.34 | 2.38 |
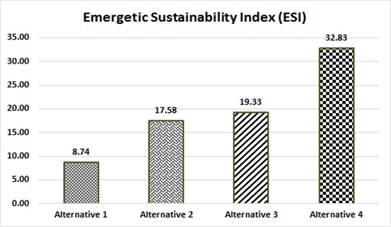
| Sustainability Index (ESI) | 8.74 | 17.58 | 19.33 | 32.83 |
It is the sum of the inputs of non-renewable resources to the system and the imported resources over renewable resources.
An ELR of 1 is considered to be an acceptable threshold for the ELR of the alternatives studied; this threshold indicates that the environmental impact of these processes is very low. An ELR of 0.51, 0.32, 0.30 and 0.24 is reached for alternatives 1, 2, 3 and 4, respectively (Lomas 2009). Proposals in which rice straw is energetically evaluated have a lower environmental loading ratio than the one currently used (alternative 1). This could indicate that rice production has a low environmental impact, but it can also indicate that there is a large area over which the generated environmental impact is dissipated (Cao & Feng, 2007; Cano, 2012). This result can be obtained for harvests with very low yields (t of rice per m2 of soil used), which indicates an underutilization of the natural resources available to satisfy the demands of society in terms of development and a process that can accept a greater amount of emergy from non-renewable and imported resources according to Cao & Feng (2007). The most favourable ELR is achieved by alternative 4 (Fig. 3).
The calculation of the EYR allows the dependence of the process on imported or purchased resources to be estimated to show the contribution of the local natural capital in the economy of a region or the socio-productive process analysed (Castellini, et al., 2006; Zhang & Long, 2010; Zhang, et al., 2011).
Alternative 1 has an EYR of 3.69, indicating that it depends more on the resources that come from the economy than imported and purchased resources (Agostinho, et al., 2011; Brown, et al., 2012), which results in a moderate economic benefit (Zhou, et al., 2010) and a moderate contribution of local resources (renewable and non-renewable) to the final product (Castellini, et al., 2006); therefore, the system in alternative 1 has the capacity to exploit local resources (from renewable and non-renewable sources) by increasing the resources that come from the economy (Zang & Long, 2010). This shows that production alternatives can be considered that more intensively use the renewable resources of the productive ecosystem and that imply greater flows of imported resources (technology, labour, services). Although this alternative has values higher than 2, which indicates that the productive process is practically manufactured (Cano, 2010; Brown, et al., 2012). If it is compared with the values obtained for the other alternatives, it shows that it is possible to variation of the current productive schemes from the incorporation of more resources from the economy and that may be greater if in the productive schemes of considering the energy valorization of rice straw.
For alternatives 2 and 3, in which rice straw is evaluated for energy purposes, the EYR is higher (4.48 and 4.71, respectively) than it is for alternative 1, which indicates that a high economic benefit and strong product competition can be attained by delivering more emergy in the final product than what is necessary to import into the productive ecosystem (Odum, 2003). For these two alternatives, despite the increase of the diesel imported for the transportation of rice straw and digestate, the EYR does not decrease. This is because of the increase in the use of the renewable resources of the productive ecosystem when increasing the contribution of rice straw valorisation for energy purposes (Zhou, et al., 2010; Cano, 2010). In these alternatives, there is a high capacity to exploit local resources (from renewable and non-renewable sources) through the economic investment in resources from abroad (Zhang, et al., 2011). Alternative 4 has the best EYR (5.80), as it considers the emergetic contributions made by the product to the economy with respect to the resources it imports. This result is achieved by decreasing the import of diesel by using biomethane in the equipment used to transport the materials of the production process and increasing the use of renewable resources when valorising rice straw for energy purposes; i.e., there is a better use of the capacity of the primary energy resources. This result can have a negative effect in the medium and long terms when an excessive increase in the ELR is applied over time due to an intensification of the use of local non-renewable emergy sources instead of a better use of renewable emergy sources.
The EIR allows determining the relationship between the entry of resources imported into the system and the sum of renewable and non-renewable resources. The lower this ratio is, the lower the economic cost of the process. Thus, alternatives with a lower ratio tend to be more competitive and thrive in the market. Generally, the higher the ratio is, the higher the economic development of the system (Zhag, et al., 2007). The results of the calculation of the EIR show that the three alternatives in which rice straw is evaluated for energy purposes (2, 3 and 4) result in a more developed socio-productive system; the values range from 0.21 for alternative 4 to 0.44 for alternative 1. This is associated with the reduction of the import of electricity due to the cogeneration of electricity with biogas and, for alternative 4, the reduction of the import of diesel for the transfer of the various materials of the process when biogas produced in the form of biomethane is used.
The EER is the ratio of the energy exchange rate calculated by dividing the total emergy produced by the emergy received from the sale. To determine this ratio, considering the non-availability of information for Cuba, the EMR was used to determine the amount of emergy that can be purchased with a dollar (4.30E+12 seJ/$) in Cuba after the economic crisis of the 1990s using the method of McLachlan & Odum (2001).
The results of the calculation of the EER, which is also known as the emergy benefit index and indicates the difference between what is being paid and what should be paid if the value of the environmental emergy involved in the creation of the product is considered (Lomas, et al., 2007). As seen, alternatives 2, 3 and 4 obtain values 20% higher than alternative 1, and alternative 4 obtains the highest value (1.86). This shows that more emergy is contributed to the economy than is extracted from it to achieve the product. Additionally, there is a greater contribution of the renewable flows of the productive ecosystem. When the amount paid is less than the real emergy value, this can be interpreted, as stated by Ulgiati, et al. (1995), as an undervaluation of the value of the contribution of renewable resources; this is a trend in developing countries.
The ESI indicates the relationship between the emergetic performance index and the environmental loading ratio, and it reflects the ability of a system to provide products or services with minimal environmental stress and maximum economic benefit (Zhang, et al., 2011) (Fig. 4).
In the case study analysed, an ESI of 6.46 is obtained for alternative 1, and ESIs of 14.05, 15.67 and 24.38 are obtained for alternatives 2, 3 and 4 respectively. The greatest value of the ESI is obtained in alternative 4 due to the reuse of the rice production energy in the electrical energy generated via biogas and the use of the purified biogas in the form of biomethane in the transportation of the various process materials; this agrees with the report of (Wang et al., 2015).
These results show that the evaluation of rice straw via anaerobic digestion for energy purposes is viable for considerably reducing the environmental stress of the socio-productive system and increasing the economic benefit to the economy. As reported by (Zhang, et al., 2011), which agrees with the results reported by Zhai, et al. (2017), natural crops in the province of Hebei, China have a low environmental burden and high sustainability. Thus, these processes can be considered sustainable in the long term. This coincides with the study by (Wang et al., 2015), which comparatively studies the efficiency and sustainability of the production of biogas and biogas with electric coproduction in large-scale projects in China and showed a sustainability index increase of 2.54; this also agrees with the report by Cao & Feng (2007).
Because such favourable results were obtained for each of the evaluated emergetic indicators, a comparative study between the results published in the references for other countries was made (Table 3).
Table 3 - Comparison of alternative 1 (most unfavourable) and alternative 4 (more favourable) with the studies developed in Italy, Spain, China and Greece.
| Country | ELR | EYR | ESI | T (seJ/J) | Source |
| Italy | 2.86 | 1.38 | 0.48 | 1.30E+05 | (Lomas Huertas, 2009) |
| Spain | 1.34 | 1.75 | 1.31 | 2.60E+05 | (Lomas Huertas, 2009) |
| China | 3.2 | 1.37 | 0.43 | 4.15E+04 | (Wang, et al., 2018) |
| Greece | 1.16 | 3.08 | 2.66 | 1.63E+04 | (Lomas Huertas, 2009) |
| Cuba Alt. 1 | 0.5 | 3.28 | 6.46 | 1.90E+05 | Authors |
| Cuba Alt. 4 | 0.24 | 5.80 | 24.38 | 3.10E+05 | Authors |
As seen, the transformation units (sej/J) obtained in Cuba has higher values to those obtained in Greece and China and similar to those obtained in Italy and Spain.
For alternative 1, the ELR reaches values 5.72, 2.68, 6.4 and 2.32 times lower than those in Italy, Spain, China and Greece, respectively. For the alternatives that consider the energy evaluation of rice straw, the values are doubled in all cases. This may indicate that in Cuba, rice production has a lower environmental impact than in the other countries or that more area is used to achieve its production, which dilutes the impact.
The EYR has the highest values for two alternatives evaluated in Cuba; for alternative 1, the values are higher than those reported for Italy, Spain, China and Greece by 2.37, 1.87, 2.39, and 1.06 times, respectively. For alternative 4, the values are higher by 4.20, 3.31, 4.23, and 1.88 times. These results show that rice production in Cuba still allows for a greater incorporation of economic resources, which can increase if waste is energetically valorised.
The ESI shows that the rice production systems in Italy and China are sustainable only in the short term, those in Spain and Greece are sustainable in the medium term, and those in Cuba are sustainable in the long term (and they are even more sustainable when waste is valorised for energy purposes).
If we consider the principle of maximum emergetic power as proposed in Odum (1996), for a socio-productive system to be sustainable, a maximum economic benefit with minimal environmental stress must be obtained. Some inconsistencies can be found in the comparison of these results, and it is necessary to discuss these inconsistencies with regard to Cuba.
As seen in the results of the indices calculated in the previous appendices for rice production in Cuba, the process has a greater input of resources from the economy than the reference countries. Because of these results, we perform a comparative analysis of the productivity achieved in rice production in Cuba with those obtained by the reference countries. This comparison includes the results obtained in Costa Rica, which is a country with climatic conditions similar to those of Cuba and is an underdeveloped country.
As seen in Fig. 5, in all the reference countries, yield values above 6 ton/ha and higher than 7.5 ton/ha are obtained in countries such as Greece and Spain. In the three years analysed, Cuba only achieves yield values of little more than 3 ton/ha. In the case study analysed, which involves one of the main centres producing rice in Cuba, in the year taken as reference (2015), the value of the yield was 2.7 ton/ha. This is one of the aspects that affects the results obtained in the calculation of the emergy ratios, also demonstrating that it is possible to incorporate abundant resources from the economy that allow productive yields to increase without constituting an increase in the environmental stress of the partner productive system.
Another aspect that should be considered in this comparison is the error associated with valorising the labour force inputs from the expenditure of money, as there are much higher values in the studies selected for comparison compared to those of Cuba due to the specific characteristics of monetary duality that exists in Cuba.
The emergy/money ratio (EMR) can provide another perspective from which to discuss the contradiction. Cuba, according to McLachlan & Brown (2001), reports an EMR of 4.30E+12 seJ/$, which is similar to or below those of the reference countries (Italy: 3.9; Spain: 8.1; Greece: 5.1; China: 11.9; Costa Rica: 7.9) (Bardi & Brown, 2000) but superior to those of many developing countries, which does not justify such low yields. One explanation for these results may be that the emergy purchasing power of the country is not intended to purchase inputs necessary for agricultural production but is intended for other production systems, such as industry or tourism.
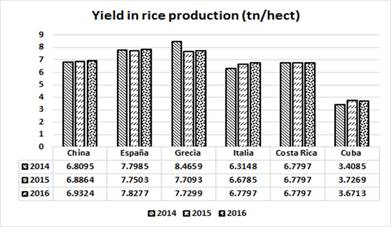
Fig. 5 - Performance of rice production in China, Spain, Greece, Italy, Costa Rica and Cuba in 2104, 2015 and 2016.
Beyond the results of this work, in the opinion of the author, future research should be aimed at determining emergetic ratios in different agricultural productions and/or the use of other wastes for energy purposes. In addition, the extensive practice of the methodology will allow a national database of products, services and ecosystems to be obtained.
Conclusions
The analysis of the emergy flows that intervene in the socio-productive system of rice shows that if the energy value of rice straw is considered, in the case study evaluated, it displaces water as the main renewable source that enters the system. Moreover, fuel and fertilizer resources are resources that are most imported from the economy.
The calculation of emergy indicators shows that in the alternatives where the contribution of the renewable flows of the socio-productive system is higher, the influx of flows from the economy increases, which achieves greater economic benefits with low environmental stress.
The alternative that offers the greatest sustainability in the long term is alternative 4, where the anaerobic digestion of rice straw is combined with the self-supply of the electric and thermal energy produced by coproduction via biogas and the self-supply of part of the fuel used for the transportation of the various materials in the process using the biomethane obtained from biogas purification.

