


 Custom services
 English (pdf)
 Article in xml format
 Article references
 Send this article by e-mail
 Cited by SciELO
  Similars in
SciELO
Similars in
SciELO 
 Permalink
Introduction
The development of the agricultural sector is considered a priority in all countries not because the agricultural sector brings great benefits to the country's economy but because this sector is important for ensuring food security and employment. According to estimates by the Food and Agriculture Organization (FAO), a subsidiary of the UN, by 2050, 70% more food will have to be produced than in 2007 to feed the world's 9.3 billion people (FAO, 2009). In recent years, rapidly changing prices in global agricultural markets have forced many countries to aim for a strategy of food self-sufficiency. In global food security (United Nations, 1996), as well as in the concept of sustainable development (United Nations, 2020), countries are recommended to pay more attention to the issue of more efficient use of natural resources and land resources, environmental cleanliness and providing the population with ecologically clean food products. In this regard, the states are particularly sensitive to the development of the agricultural sector, raising the level of self-sufficiency with necessary food products, and implement a policy of flexible regulation and risk mitigation. The main reason for this is that agricultural production and labor productivity depend on geographical area, climatic conditions, ecological environment, quality of land resources, natural phenomena, etc. and their effect is mostly beyond people's will. Thus, on the one hand, the need to provide the population with necessary food products, and on the other hand, the risk (natural and unnatural) of investments in the production of agricultural products require direct and indirect state intervention in this sector.
In order to minimize risks in agricultural production, states use tax benefits (liberal approach), as well as incentives and subsidies, logistics services, purchasing products at the farmer's door, etc. methods. It should also be noted that in many cases, the concession and promotion mechanism applied in agriculture differs from other areas of the economy. The benefits applied (tax breaks, subsidy deductions and incentives) mainly serve to support this sector. Sometimes, states develop support mechanisms for product types, taking into account the demand of the country's population and the strategic importance of the product.
In some studies (Meijerink & Roza, 2007; Mellor, 2017) agriculture is viewed as a component of economic growth. This happens if agricultural production has high productivity based on modern technologies. In general, agriculture can rarely become the main source of economic development, which depends on the level of economic development of countries. However, as we mentioned, the specific feature, the high level of risk and social importance of agriculture requires keeping this area in the focus of economic and social policy.
Studies show that the mechanism of regulation (stimulation) of production in agriculture is applied in different forms depending on the policy implemented by the countries. Mainly applied methods include: various tax benefits (income, profit, capital growth, social insurance fees, property, rent, fees, labor payments, VAT), subsidies for various types of agricultural products, etc. (OECD, 2005, pp. 23-28).
The effectiveness of state regulation of agriculture has a positive impact on productivity, food security and sustainable development. However, the effectiveness of the regulation depends on many factors and changes depending on the dynamics of development or recession of the country's economy. The important issue here is to achieve productivity in agricultural production and food security of the population. In this sense, the regulation and support of agriculture is of strategic importance in all states. In numerous studies conducted in this direction, concessions applied by states are evaluated from economic, social and political aspects. In most of the conducted studies, it is noted that the high level of agricultural support or state intervention has a serious impact on the development of farms and the areas that serve them, and ultimately on ensuring food security. Divanbeigi and Saliola (2016, p. 3) based on the results of their research, noted that agricultural productivity is higher on average in places where operational costs are lower and regulatory practice is more followed. However, in the studies conducted so far, the level of government intervention in agriculture, whether it is more or less, has not been quantified. In this regard, measuring the level of state intervention in the agricultural sector is considered relevant which will be the main goal of this paper.
Development
Literature review
Numerous studies have been conducted on the state regulation of agriculture (Aliyev, 2005), ensuring food security (Atashov, 2005; Muradov, 2011), the role of the agricultural sector in economic development (van den Ban, 1999), and poverty reduction (Cervantes-Godoy & Dewbre, 2010). Growth in agriculture is two to four times more effective in raising the incomes of the poor than in other sectors. A 2016 World Bank analysis shows that 65% of adults who work but are poor derive their income from agriculture (World Bank, 2020). The impact of taxes and subsidies is evaluated in studies related to state intervention in agriculture (Akkaya et al., 2019). Jelıć et al. (2014, p. 174) include the following reasons for regulation of agriculture from state: 1) increasing the efficiency of agricultural production; 2) protection of farmers' income; 3) ensuring national security and food safety; 4) reducing public welfare and dependence on exports in rural areas. Thus, governments intervene agricultural production taking into account economic development, economic interests, requirements of international organizations (such as the World Bank and the International Monetary Fund), local environmental conditions, traditions of national and subnational institutions, etc. (Lencucha et al., 2020).
Many studies can be found on the strategic importance of agriculture, tax incentives (Durst & Monke, 2001), subsidization (Bellmann, 2019), and incentive mechanisms. As agriculture is one of the main priority sectors of the economy (economic growth, food security and employment), tax regulation of this sector is a necessary condition (Miller, 2015). Scientists conducting research in this field (OECD, 2020b; Soliwoda & Pawlowska-Tyszko, 2014) distinguish two main models of agricultural regulation: British model and Continental model. In the British model, agricultural income is taxed in addition to income from non-agricultural activities. This model is applied in countries where land plots are owned by small business groups. In this model, the regulatory norms on the factors affecting the tax base are defined. In addition to all this, depending on the country's tax policy, land plots used only for agricultural purposes are exempted from property tax. In the continental model, income, profit and wealth (biological assets) from agricultural production are taxed with a single taxation base.
Incentives are applied for producers of agricultural products in Azerbaijan too. Thus, agricultural taxpayers have been exempted from income tax, VAT and property tax for a period of 10 years from January 1st, 2014. VAT applies only to the retail sale of agricultural products produced in Azerbaijan. Besides, since January 1st, 2017 import and sale of wheat, as well as production and sale of flour and bread; the sale of poultry meat has been exempted from VAT. As in many countries of the world, in Azerbaijan, tax concessions are applied to agricultural production, subsidies are given to some necessary products, cattle are given to households on preferential terms for the purpose of livestock development too.
The following are included in the State support measures for agriculture in the Strategic Road Map “on the production and processing of agricultural products in the Republic of Azerbaijan”. “Exemption of agriculture from taxes; giving preferential loans to producers from the budget; application of customs concessions to most of the imported means of production for the production and processing of agricultural products”. 40 percent of the cost of agricultural machinery, equipment and equipment sold by "Agroleasing" OJSC is paid from the budget and they are sold through leasing. This way 50 percent of the calculated insurance premium for insurance of agricultural property and specified insurance events is paid by the state".
Support for agriculture in OECD countries
Direct and indirect support for agricultural production is an important component of the economic and social policy of countries around the world. However, it is important to emphasize that, in many cases, agricultural support (or intervention) does not depend on economic impact and is more aimed at social protection and food security. Regulation of agricultural production is defined as the annual monetary value of the state budget, production stimulation, and total support of consumers and taxpayers to agriculture (TSE1). The general support to agriculture includes: Evaluation of Producer Support (PSE2), Customer Support (CSE3) and General Service Support (GSSE4). PSE support to agricultural producers is measured at the "farm gate" level and consists of market price support, budget payments and the value of assumed income. GSSE transfers are linked to measures that create favorable conditions for the primary agricultural sector through the development of private or public services, institutions and infrastructure.
It should be noted that in OECD countries, the support in the average amount of 276.9 billion USD per year in 1986-1988, 277.6 billion USD per year in 2000-2002, and 318.8 billion USD per year in 2017-2019 was provided. Compared to 1988, the volume of support (TSE) increased by 15.1% in terms of value and a decrease in the ratio of TSE to GDP was observed. In 1986-88, the ratio of TSE to GDP averaged 2%, while in 2017-2019, this indicator decreased to 0.6% (Table 1).
Table 1 - OECD: Estimates of support to agriculture.
| 1986-88 | 2000-02 | 2017-19 | |
| Producer Support Estimate (PSE) (%Total value of production (at farm gate)) | 38,96 | 32,95 | 19,66 |
| Support based on commodity output (%PSE) | 81,44 | 63,82 | 44,39 |
| Market Price Support (MPS)% PSE | 76,00 | 56,95 | 41,57 |
| General Services Support Estimate (GSSE)% PSE | 11,05 | 16,72 | 18,52 |
| General Services Support Estimate (GSSE) % TSE | 9,23 | 13,11 | 13,42 |
| Agricultural knowledge and innovation system | 18,95 | 21,86 | 31,29 |
| Percentage PSE (%) | 35,60 | 28,90 | 17,60 |
| General Services Support Estimate (GSSE)% PSE | 11,05 | 16,72 | 18,52 |
| General Services Support Estimate (GSSE) % TSE | 9,23 | 13,11 | 13,42 |
| Percentage TSE (% of GDP) | 2,00 | 1,00 | 0,60 |
| Percentage Total Budgetary Support Estimate TBSE (% of GDP) | 0,70 | 0,60 | 0,40 |
Source. OECD (2020) Agricultural Policy Monitoring and Evaluation 2020
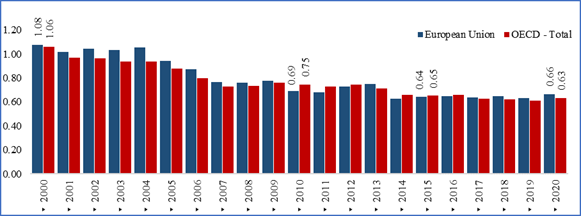
State support for the stimulation of production in agriculture originates from the agrarian policy implemented in the countries. As can be seen from the previous table, the specific weight of support to the producer (PSE) in the total product output has decreased by approximately 2 times (38.9% in 1986-1988 and 19.6% in 2017-2019). Compared to 2000, in 2020, the specific weight of state support to agriculture in the GDP has decreased in EU countries and OECD countries in general. Thus, the decrease in EU countries decreased from 1.08% to 0.66%, and in OECD countries from 1.08% to 0.63% (Figure 1).
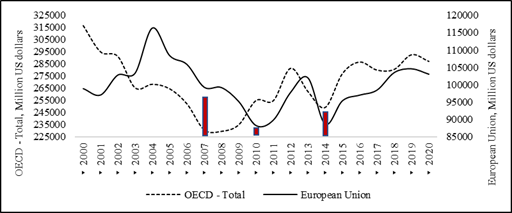
In fact, although there was a decrease in percentage expression, there was an increase in absolute indicators. As can be seen in Figure 2, the amount of state support (in absolute numbers) in the EU and OECD countries decreased during the crisis. Starting from 2015 it increased to the level of the 2000s in the following years. However, starting from 2020, a downward trend is observed, one of the main reasons for which is the COVID-19 pandemic.
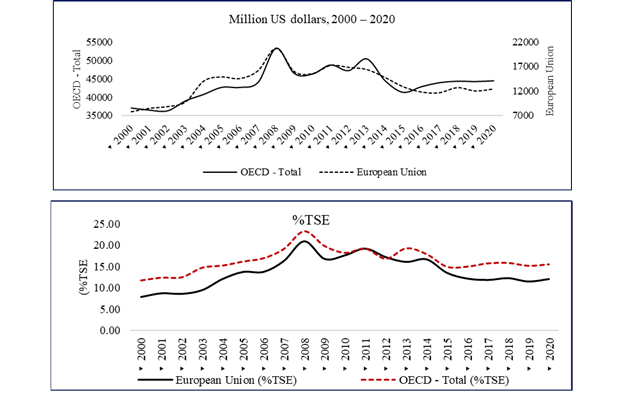
It is interesting that although there was a decrease in the amount of support for the TSE during the crisis period, there was an increase during the crisis period for the GSSE indicator. As can be seen, GSSE support increased in 2008 and then declined in subsequent years (Figure 3).
In particular, the development of support for agriculture in the OECD region is characterized by a long-term decline in support based on the production of commodities (including support for market prices and payments for production). Research shows that this form of support has the greatest potential to distort agricultural production and trade. Because, along with unlimited variable resource payments, in OECD countries it has increased slightly since the beginning of the millennium. These forms of support account for 8.5% of total farm receipts and 48% of producer support in 2017-2019, up from 19.5% and 68% in 2000-2002, respectively (Figure 4).
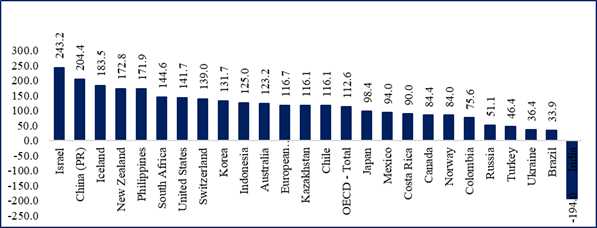
Fig. 4 - Changes in the volume of public support in OECD countries in 2010-2020 2010=100. Source. (OECD, 2020a)
It should also be noted that although numerous studies have been conducted on the development of the agricultural sector, its state regulation, promotion mechanisms, there is no study on the measurement of state intervention. Agrarian policy includes the solution of wide-ranging problems, including ensuring food security in the country, achieving access to sufficient food products at reasonable prices, and protecting the environment. In this regard, most countries aim to solve the mentioned problems by directly and indirectly interfering in agriculture.
Methodology for measuring state intervention in the agricultural sector
In order to measure the level of state intervention in the agricultural sector, a number of indicators available in the international databases are used in this study, specifically the approach and the indexing method proposed by ANAS Institute of Economics. The statistical data of the OECD has been used as a database.
It is known that all the countries of the world implement direct and indirect support (intervention) programs for the production of agricultural products, depending on their economic situation (and sometimes independently). State intervention (support) in agriculture is implemented through concessions, incentives, and other mechanisms for producers, and the strategic importance of agriculture for countries plays an important role in this policy.
The composite indicator of the share of Total Support to Agriculture (TSE) in GDP includes: (I) improvement of agricultural production (research and development); (II) agricultural training and education (agricultural schools); (III) control of the quality and safety of food, agricultural products and the environment (control services); (IV) improvement of off-farm collective infrastructure, including downstream and upstream industry (infrastructures); (V) assist in marketing and promotion (marketing and advertising); (VI) to pay the costs of storage of agricultural products and disposal of obsolete products; (VII) lack of information (various) and for all these reasons, the above categories include indivisible and other general services (OECD, 2000). These indicators allow to evaluate the indirect intervention of the state.
Another composite indicator is the producer protection composite indicator (OECD, 2023). Thus, producer protection is defined as the ratio between the average price (measured at the farm gate) and the marginal price (measured at the farm gate) received by producers, including net payments per unit of current output.
In this study, subsidy and incentive mechanisms were considered as stimulating intervention of the state. The indicators included in the measurement are normalized between 0-1 by equation 1.
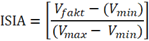
(1)
Here the results vary in the range (0-1) and the approach to 0 indicates a decrease in intervention (liberalization) and the approach to 1 indicates an increase in intervention.
Index of state intervention in agriculture (ISIA) was calculated on the basis of two sub-indexes: agricultural support sub-index and producer protection sub-index (equation 2)
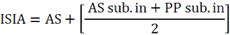
(2)
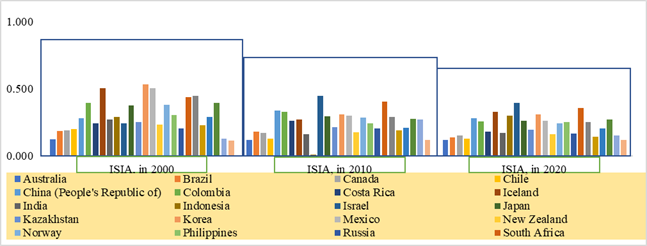
The result of the study is given in the Table 2. As can be seen from the table, Argentina was ranked first as a country that intervened less in agriculture among the countries included in the ranking.
Table 2 - Calculation of ISIA for selected countries
| The index of state support to agriculture 2000 | The index of state support to agriculture 2010 | The index of state support to agriculture 2020 | |||
| Argentina | 0,108 | Argentina | -0,174 | Argentina | -0,137 |
| Viet Nam | 0,114 | Indonesia | 0,009 | Australia | 0,119 |
| Australia | 0,123 | Viet Nam | 0,118 | Viet Nam | 0,120 |
| United States | 0,128 | Australia | 0,118 | Chile | 0,126 |
| Brazil | 0,185 | Chile | 0,130 | Brazil | 0,136 |
| Canada | 0,188 | India | 0,163 | Turkey | 0,142 |
| Chile | 0,198 | Canada | 0,172 | Canada | 0,150 |
| Russia | 0,203 | New Zealand | 0,177 | United States | 0,154 |
| Turkey | 0,228 | Brazil | 0,181 | New Zealand | 0,163 |
| New Zealand | 0,235 | Turkey | 0,189 | Russia | 0,168 |
| Israel | 0,243 | Russia | 0,205 | India | 0,173 |
| Costa Rica | 0,244 | Ukraine | 0,207 | Costa Rica | 0,183 |
| Kazakhstan | 0,253 | Kazakhstan | 0,213 | Kazakhstan | 0,194 |
| India | 0,269 | Philippines | 0,243 | Ukraine | 0,206 |
| China (PR) | 0,280 | Costa Rica | 0,263 | Norway | 0,245 |
| Ukraine | 0,292 | Iceland | 0,269 | Philippines | 0,251 |
| Indonesia | 0,292 | United States | 0,271 | Switzerland | 0,253 |
| Philippines | 0,306 | United Kingdom | 0,275 | Colombia | 0,257 |
| Japan | 0,377 | Norway | 0,285 | Mexico | 0,263 |
| Norway | 0,382 | Switzerland | 0,288 | Japan | 0,264 |
| Colombia | 0,395 | Japan | 0,295 | United Kingdom | 0,271 |
| United Kingdom | 0,396 | Mexico | 0,302 | China (PR) | 0,279 |
| South Africa | 0,439 | Korea | 0,311 | Indonesia | 0,298 |
| Switzerland | 0,449 | Colombia | 0,329 | Korea | 0,311 |
| Mexico | 0,502 | China (PR) | 0,339 | Iceland | 0,331 |
| Iceland | 0,503 | South Africa | 0,405 | South Africa | 0,359 |
| Korea | 0,533 | Israel | 0,446 | Israel | 0,394 |
| relative average | 0,291 | relative average | 0,223 | relative average | 0,210 |
Source. Calculated by the author based on the statistical database of the OECD.
Then, as can be seen in Figure 5 the state intervention in agriculture has decreased in all OECD countries compared to 2000.
Conclusions
State intervention in agriculture is necessary given the strategic importance of the agricultural sector for the provision of food and raw materials for the population and economy of a country. As the agricultural sector is vulnerable to external factors, such as climatic variations, plant and animal diseases, and fluctuations in the prices of agricultural products in the international market, governments usually intervene to help farmers face these challenges and protect your production capacity. In addition, state intervention is also necessary to address economic and social inequalities in the agricultural sector that affect small and medium-sized farmers, so state regulation makes it possible to guarantee fair prices for agricultural products and promote the adoption of agricultural practices. sustainable and efficient.
However, the market economy dictates that state interventions must be justified, so it is necessary to use indicators to effectively measure this phenomenon. In this paper, a novel index (ISIA) is proposed for this purpose, and it is calculated for different OECD countries, concluding that in Australia, New Zealand, Switzerland and Japan, the state supports agriculture more while in Mexico, Costa Rica, Turkey in the United States and Colombia, the state intervenes less. In general, in the period 1986-2020, a downward trend in the specific weight of state support in GDP was observed. Finally, the stimulating and encouraging intervention of the state in agriculture is considered important in terms of increasing production.

