


 Custom services
 English (pdf)
 Article in xml format
 Article references
 Send this article by e-mail
 Cited by SciELO
  Similars in
SciELO
Similars in
SciELO 
 Permalink
Introduction
In modern world, nature and society relations have become more complicated, resulting in geographical components being seriously subjected to the process of anthropogenization. The process of rapid settlement and land acquisition has led to greater exposure of the landscapes to anthropogenic influences and landscape transformation. As a result of the excessive use of geographical complexes and natural resources, the environmental condition of the territories deteriorates, and as a result, all geographical components, namely air, water, soil and biosphere, suffer considerable damage (Valishin, 2017). This has led to various environmental and/or socioeconomic crises like the increasing number and intensity of natural disasters, climate change, biodiversity loss, ecosystem destruction, regional disparities, and socioeconomic inequity. Besides, a large number of megacities around the world are creating urban management quagmires for their administrations. These crises are mainly caused by rapid population growth; and a net total growth of consumption of natural resources, combined with vigorous industrialization, urbanization, mobilization, globalization, and agricultural intensification (Yigitcanlar et al., 2019).
However, from the emerging and intensifying environmental problems, not only the flora and fauna, but also people are harmed (Hasanaliyeva, 2022). It is well known by researchers and health practitioners the potential benefits to health from activities in natural settings and regular contact with nature, which can be perceived as a preventive medical tool. In this sense, there is a close relationship between the concepts of health-supporting landscapes and sustainability in modern cities (Dushkova & Ignatieva, 2020). Therefore, it is essential to develop strategies for enhancing the therapeutic nature of everyday urban landscapes to improve the health and well-being of people with chronic diseases (Mei et al., 2021). Then, to address these environmental problems, there is a growing need for apply sustainable development concept to cities.
The development of smart cities is already well underway in many of the industrialized world's cities like London, Stockholm, Dubai, New York, Barcelona, Hong Kong, Amsterdam, Singapore, Tokyo, Paris, and Copenhagen (Lai et al., 2021) although there are still huge challenges to overcome (Javed et al., 2022). Among these we can highlight the need of strengthen supply chains for feeding the city’s population (Säumel et al., 2022), specialized infrastructure such as sensors, communication networks, and data centers, the need that data is collected and used ethically and securely; to incorporate more the environmental dimension into decision-making (Hanley et al., 2019), and in this process to take into account the aspects of uncertainty for which various methodological approaches can be adopted (Valdés López et al., 2020); in addition to develop a better regulatory and legal frameworks, etc. Therefore, smart cities require interdisciplinary research and development for successful implementation (Singh et al., 2022).
In the case of Azerbaijan, although the topic has been discussed before (Huseynov, 2011; Huseynova et al., 2022; Valiyev, 2022)
Is still in the country an emerging concept where the academic community needs to work on. In this sense, we would like to highlight that in order to create cities that are resilient, sustainable, and safe, planners must have a solid understanding of the local geography. For instance, while developing infrastructure and buildings, planners must take topography, hydrology, geology, and climate into account. They also need to consider the risks associated with natural calamities like landslides, earthquakes, and floods. Planners may design urban environments that are more livable, effective, and economically feasible by having a solid understanding of the topography of a given area. A good knowledge of the area's topography can also ensure that urban expansion doesn't harm the environment or have a detrimental effect on nearby populations.
Considering the above, the objective of this work was to analyze relevant information for the future development of the concept of smart cities in Azerbaijan. In the planning of these complexes, the collection of information tends to be a demanding stage, so we believe that the data presented here, in addition to being interesting, will be very useful as the country moves in this direction. Our research area covers the cities of Ganja, Mingachevir and Yevlakh.
Various methods were used during the study of cities which mainly included the method of field research in urban areas. However, considering contemporary technological advances, satellite image technology, Geographic Information Systems and Remote Sensing were used to study and determine the dynamics of cities. In addition, the mathematical-statistical methods were also important in the interpretation of the results. The main indicators used and how they are calculated are listed in Table 1.

Development
Yevlakh was built as a station in the 80s of the last century, although it as known as "Station" by the population for a long time. In official documents and sources of the late 19th and early 20th centuries was first the Yevlakh precinct or Yevlakh station of Yelizavetpol governorate, then Yevlakh village of Yelizavetpol governorate, and since 1920 and it was called Yevlakh village of Javanshir district. Yevlakh district was established on February 20th, 1935 and on February 1st, 1939, the City Council was established in Yevlakh, and Yevlakh was given the name of a city.
In the 70s and 80s of the last century, cotton ginning, tobacco fermentation, iron and concrete products, bread, tractor repair, beer and non-alcoholic beverages factory, "Karabakh" production, grain products, industrial plants, dozens of large transport, construction enterprises, and inter-regional supplies were located in Yevlakh. In Yevlax-Khankendi, Yevlax-Balakan railway line was built, Yevlax airport, Khaldan village complex secondary school, Chess school, Children's youth sports school, 19 secondary schools with 10535 places, 15 kindergartens with 840 places, hospitals, cultural centers, educational institutions, but also residential buildings were built and put into use. Thanks to the commissioning of the Yevlakh wool primary processing factory, which was the largest industrial enterprise in Transcaucasia, which was put into operation in 1978, the city of Yevlakh became one of the 3 largest industrial cities of the republic in terms of the volume of industrial products at that time.
The city of Yevlakh is on the Ancient Silk Road. It has a mild-hot semi-desert and dry desert climate with dry winters. Downstreams of Kura River, Alijan, Korchay and Incechay pass through the area. The south-eastern part of Mingachevir reservoir, and Varvara reservoir are located in Yevlakh territory. The upper parts of the Upper Karabakh and Upper Shirvan canals are also in the territory of the district. The area has in most cases, barren lands and vegetation is mainly semi-desert type. Xerophytic sparse forests, like Tugai forest, including desert plants are widespread (Hajiyeva et al., 2022). The forest fund is 4450 hectares. Some animals that can be seen in the area are: wolf, fox, gray rabbit, wild boar, hedgehog, badger, jackal, birds: turaj, partridge, starling, owl, woodcock, woodpecker, yellow shirt and others. Yevlakh is also a transport hub city. The nationally important Baku-Tbilisi railway, Baku-Kazakh highway, Baku-Supsa, Baku-Tbilisi-Ceyhan oil, Gazakh-Agstafa, Baku-Erzurum gas pipelines also pass through Yevlakh. The passing of the Baku-Tbilisi-Gaz railway line is an important prospect for Yevlakh.
Since March 2004, a number of industrial facilities have been reconstructed or built in the city. "Repair" ATSC has been rebuilt and here tractors of various brands are assembled and repaired. There are also "Lala-Textile" sewing, "Arfa" furniture factories, "Gilan" leather processing, "Dan" brick factories, "Gida" LLC, cannery and other new production enterprises. Also, there are a number of historical monuments in the territory of Yevlakh district that prove that Yevlakh was an ancient settlement. B.C. The Gochtepe mound, which belongs to the end of the III millennium B.C., is located in the area between the village of Garamammadli and the village of Rustamli. Near the mound, there was a settlement with the same name - Gochtepe village. In 1938, that village was abolished, and its population was transferred to Garamammadli village.
When studying cities on the basis of an atlas, it is possible to provide information about the geological development of the urban landscape and to carry out planning based on it. For this purpose, we have analyzed the geological development of the city of Mingachevir and the regularities of the distribution of rocks based on the National atlas of the Republic of Azerbaijan. We have determined that the territories belonging to the Upper Jurassic and Upper Cretaceous periods cover 7% of the city area, (7.7 km2), 11% (12.1 km2) Upper Quaternary alluvial-alluvial fan sediments (the bringing cone of the mountainous plains), 28% (30.8 km2) lower Quaternary alluvial-alluvial fan sediments (providing cone of mountain plains) and the largest part 54% (59.4 km2) is the area of modern and upper Quaternary diluvial-alluvial fan sediments. 91% of the territory of Ganja city (100.1 km2), is made up of sloping, undulating alluvial-alluvial fan plains, 9% (9.9 km2) of denuded alluvial-alluvial fan plains.
Atlas sources also allow obtaining certain information about the hydrographic network in cities. It is known that the cities of Ganja and Mingachevir, which are the research area, are among the oldest human settlements in the country. The cities' smooth terrain, favorable climatic conditions, and location near river sources led to rapid settlement by people since ancient times. Ganjachay flows from the center of Ganja city, while Mingachevir city is bordered by the Mingachevir reservoir from the north, and Kura River, the longest river of the country, flows through its center. For this reason, the water supply is quite different in the cities. So, this indicator is many times higher in Mingachevir than the city of Ganja due to a number of reasons. The reasons are that the territory of Mingachevir is larger than Ganja, its population is smaller, it passes through the territory of the country's longest river, and it is located on the bank of the largest water reservoir.
According to the data of the meteorological station located in the city of Mingachevir, the amount of precipitation and temperature, which are the main indicators of the climate, have different characteristics in both cities. The relief conditions lead to the formation of a climate type in the area of the study cities, as the plain relief makes the research area have a relatively more favorable climate (Salamov et al., 2017). Thus, the average annual temperature in Mingachevir city is higher, the amount of precipitation is less, and the average annual temperature in Ganja is relatively lower, and the amount of precipitation is relatively higher compared to the city of Mingachevir (Table 2).
The total solar radiation during the year is 120-130 kcal/cm2 in Ganja and 125-135 kcal/cm2 in Mingachevir. The absolute minimum temperature is -14-22 oC in Ganja, -18-26 oC in Mingachevir, and the absolute maximum temperature is 30-37 oC, 37-40 oC, respectively. Relative humidity is 20-50% in Ganja and 20-30% in Mingachevir. In the temperate climate zone, the average temperature of the hottest month is 24-26 oC, the average temperature of January is 1.0-3.9 oC, the maximum temperature is 37-40 oC, the absolute minimum temperature is 15-17 oC. The small differences recorded in the climate indicators for the study areas are related to the existing relief conditions of the cities and its influence on the climate (Alizadeh, 2014).
Table 2 - Average climatic indicators of Ganja and Mingechevir cities
| Elements | Monthly average temperature, oC | The difference in distribution of monthly average temperature, oC | Monthly average percipitation, mm | The difference in distribution of monthly average precipitation, in % | |
|---|---|---|---|---|---|
| Months | I | 1.9-3.5 | 0.8 | 10.4-19.2 | 4-7 |
| II | 2.9-4.1 | 0.1 | 14.9-25.4 | 21-35 | |
| III | 6.7-7.5 | 0.3 | 19.2-29.3 | 14-20 | |
| IV | 12.6-13.3 | 0.4-0.6 | 31.1-34.2 | 14-15 | |
| V | 17.9-19.4 | 0.3-0.6 | 43.4-45.5 | 17-34 | |
| VI | 22.1-24 | -0.1 | 44.1-49.9 | 43-47 | |
| VII | 25.3-27.4 | -0.1-(-0.2) | 19.9-23.4 | 2-33 | |
| VIII | 24.4-26.6 | -0.3-(-0.6) | 18.8-19 | 27-57 | |
| IX | 20.4-22.4 | 0.2-0.4 | 16.9-25.1 | 23 | |
| X | 13.9-16 | -0.1-(-0.4) | 30.6-40.6 | 19-39 | |
| XI | 8.7-10 | 0.4-0.6 | 15-26.6 | 11-21 | |
| XII | 4.3-6 | 0.8-0.9 | 13.1-19.1 | 9-19 | |
| Yearly average temperature | 13.4-15 | 0.23-0.3 | 28.7-34.8 | 14-16 |
Source: own elaboration
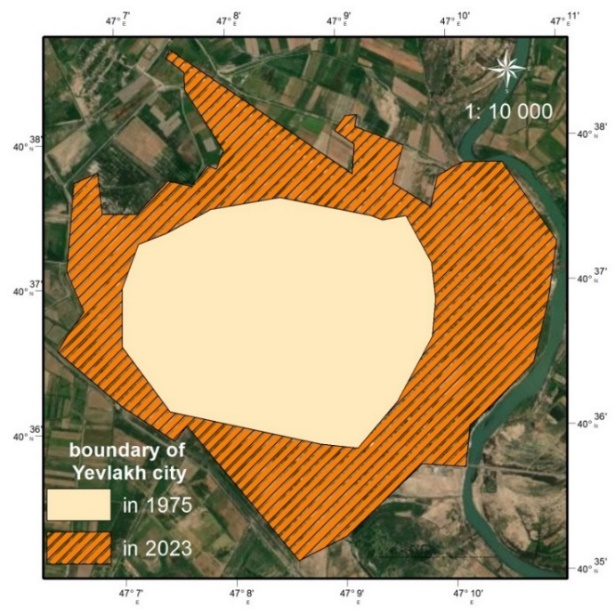
During the study of cities, it is also possible to use topo maps compiled in different years. We analyzed the boundaries of the city in Yevlakh city in 1975 using a topo plan. Based on satellite images, we determined the borders of Yevlakh city in 2023 and analyzed the territorial dynamics of the city for 48 years. We have determined that the area of the city has more than doubled during this period. Thus, in 1975, the area of the city was 1,064 km2, but in 2023, this figure was 2,464 km2 (Figure 1). The intensive development of the city's territory has led to the reduction of the area of agricultural land in the surrounding area.
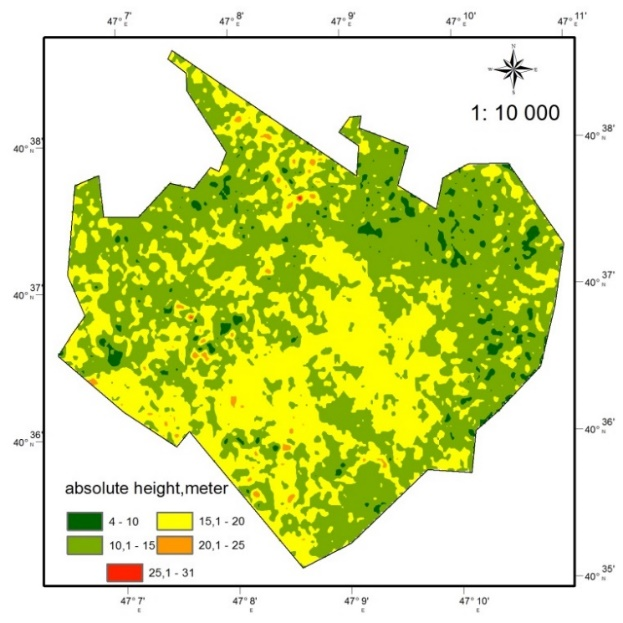
Analysis of the Digital Elevation Model of the area was also used during the analysis of urban landscapes. As a result of the analysis, it was determined that the city of Yevlakh is located at an altitude of 4-31 m, and the main part is at an altitude of 15-20 m (Figure 2).
In the city of Ganja, the areas with a hypsometric index between 270-350 m high make up 33% (36.3 km2) of the total city area, 350-400 m area 27% (29.7 km2), 401-450 m 21% (23 ,1 km2), 450-500 m is 9% (9.9 km2), 501-550 m is 10% (11 km2). In the city of Mingachevir, the areas of 0-150 m height are 91% of the total city area (118.3 km2), 151-250 m 6% (7.8 km2), 251-320 m 3% (3.9 km2). This shapes the climate and hydrogeological conditions of the two mentioned cities in terms of relief and orography, according to the research areas.
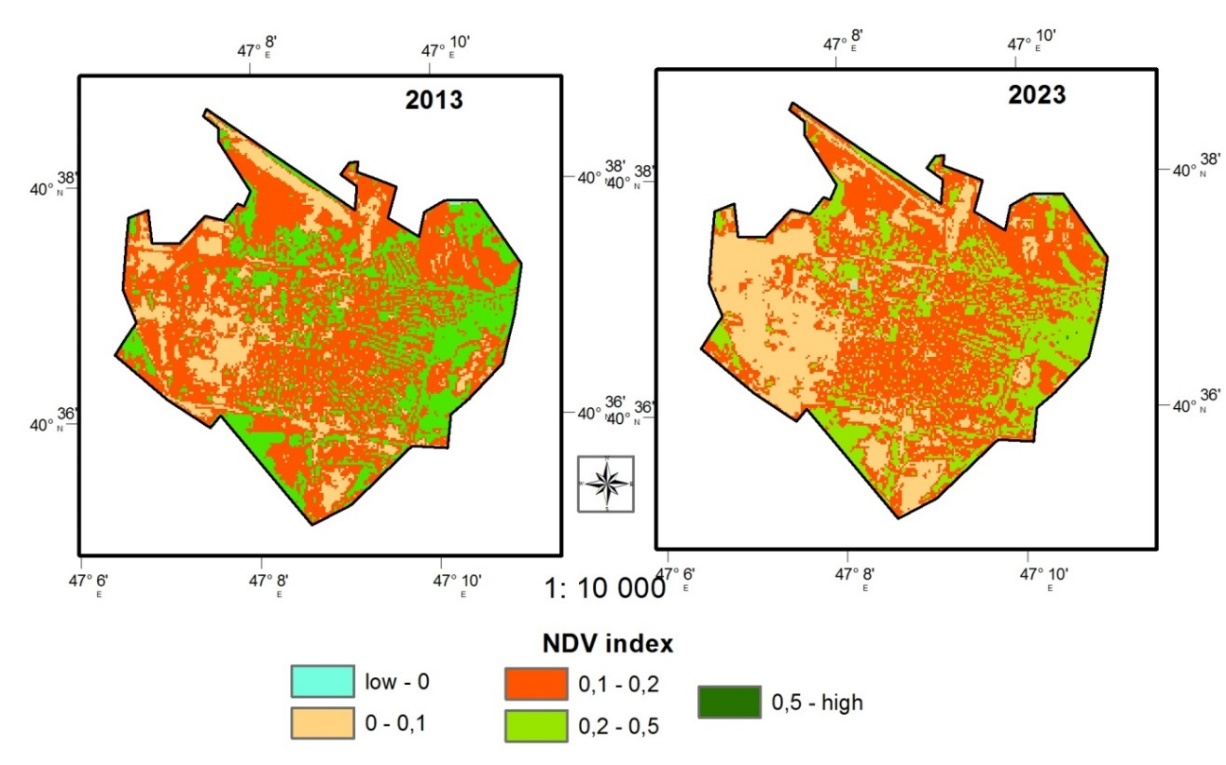
It is also possible to analyze the development of vegetation in cities based on satellite images. In this case, it is important to use the NDV index. For this, we conducted research in the city of Yevlakh. At this time, we used data from Landsat 8 and 9 satellites. Vegetation was analyzed using Bands 4 and 5 of the 2013 Landsat 8 and 2023 Landsat 9 satellites.
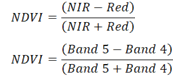
The Normalized Difference Vegetation Index (NDVI) is the most commonly used vegetation index for observe greenery globally. High reflectance in NIR and high absorption in Red spectrum, these two bands are used to calculate NDVI as shown in equation 1. So, following formula gives Normalized Difference Vegetation Index (NDV) (Avcı & Farzaliyev, 2021). The NDVI value varies from -1 to 1. Higher the value of NDVI reflects dense greenery. -1 to 0 represent Water bodies, -0.1 to 0.1 represent barren rocks and sand, 0.2 to 0.5 represent shrubs, grasslands or senescing crops. The analysis shows that the area of buildings in the city has increased, and the area of crops and pastures has decreased relatively (Figure 3).
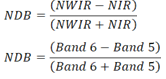
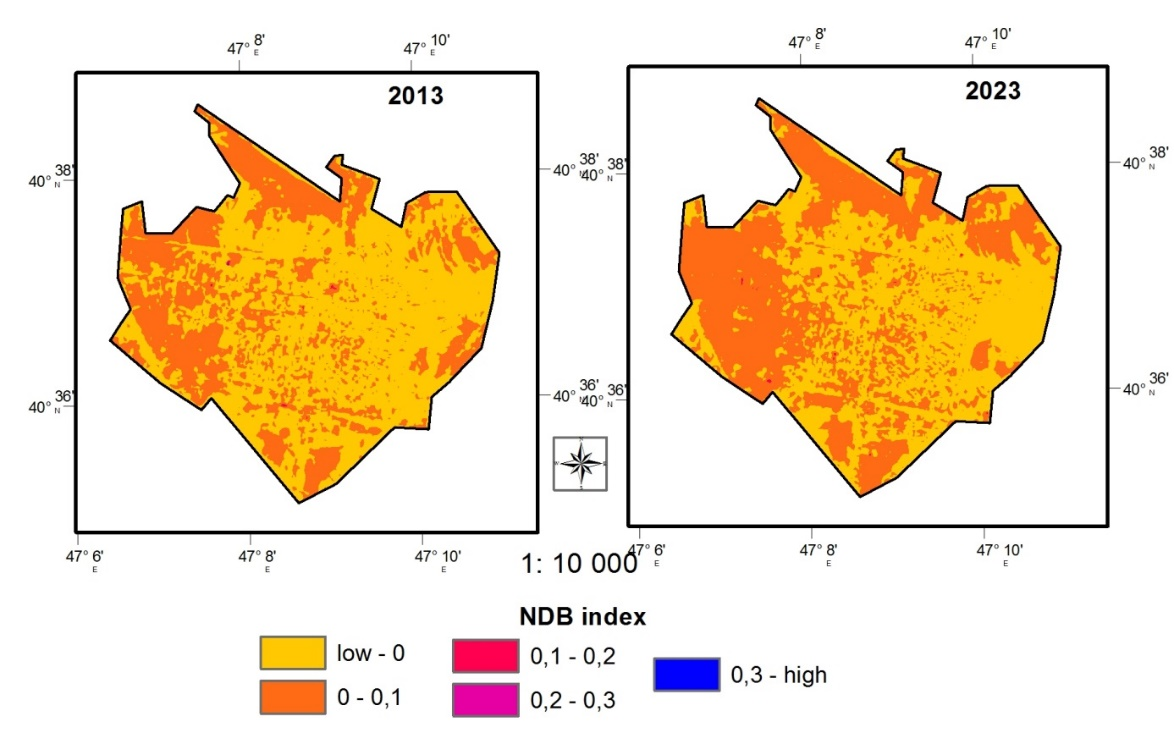
In addition, the NDB index can be analyzed based on the analysis of satellite images (Figure 4). NDBI calculation is simple and easy to derived. NDB can be calculated by equation 2. Normalize Difference Build-up Index value lies between -1 to +1. Negative value of NDB represent water bodies and higher values represent build-up areas. NDB value for vegetation is low.
 Source: https://satellites.pro/Yevlax_City_map
Fig. 4 - Normalized Difference Built-up Index (NDB) in Yevlakh city in 2013 and 2023.
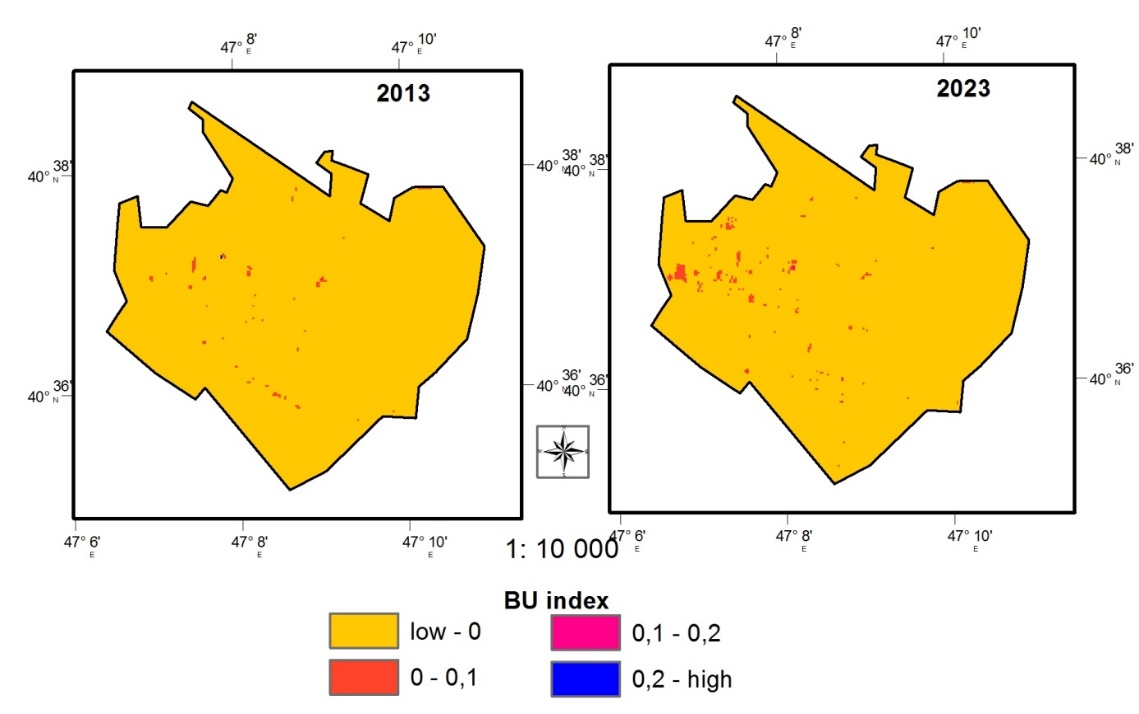
The BU index (equation 3) is used to study construction sites in urban landscapes although there are lots of indexes for the analysis of built-up area. Normalized Difference Built-up Index (NDBI), Built-up Index (BU), Urban Index (UI), Index-based Built-up Index (IBI), Enhanced Built-up and Bareness Index (EBBI) are most common indexes for analysis the built-up areas. These different indexes having their own formula, own calculation method (Amanova, 2023). Build-up Index is the index for analysis of urban pattern using NDBI and NDVI. (Figure 5).
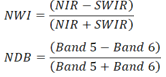
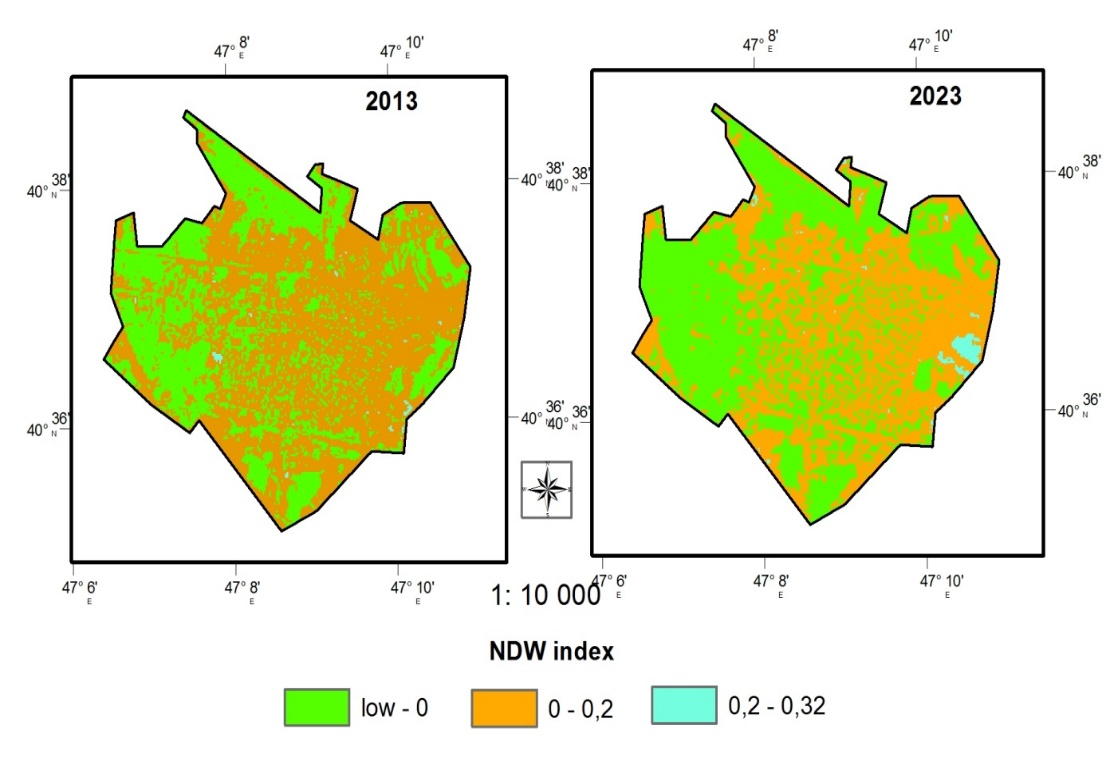
When studying urban landscapes, the study of water bodies is also important. For this, we used the NDW index in the city of Yevlakh (Figure 6). Normalize Difference Water Index (NDWI) is use for the water bodies analysis. The index uses Green and Near infra-red bands of remote sensing images. The NDWI can enhance water information efficiently in most cases (Șerban et al., 2022).
Analysis of population dynamics and environment is also important for studying urban landscapes. The role of cities in environmental pollution is undeniable. For this purpose, we studied the pollutants released into the environment in the cities of Ganja and Mingachevir based on statistical data. The analysis and comparison of sulfate and nitrate ion content in the research cities shows that although there were very serious differences in the cities in past, this difference has decreased in recent years and has approximately similar indicators. Although the amount of sulfate ion in Mingachevir city was much higher than in 2012, it then decreased relatively and increased again in 2021. On the contrary, in Ganja city, the lowest indicator was observed in 2012, and the maximum indicator was observed in 2020. Although the nitrate ion level fluctuates around the norm in certain years in the cities, violation of the maximum norm limit was observed in Ganja city in 2014. The minimum indicator was less than the norm, which was observed in the city of Mingachevir in 2013 (Table 3.).
Table 3 - Comparative dynamics of average annual indicators of sulfate and nitrate ions in the cities of Mingachevir and Ganja for 2012-2021 period.
| Identified components | Concentration norms (mg/kg) | 2012 | 2013 | 2014 | 2020 | 2021 |
|---|---|---|---|---|---|---|
| Sulfate ion | 320 | 668-150 | 304-579 | 325-406 | 391-1127 | 629-775 |
| Nitrate ion | 130 | 155-137 | 75-182 | 282-334 | 84-153 | 123-156 |
Source: own elaboration
The sources of air pollution in the study area are different. In the city of Ganja, these are harmful gases released from various industrial sources, but in the city of Mingachevir, these come thermal power plants. However, the common source of air pollution in both urban areas is gases released from vehicles (Table 4).
Table 4 - Average 2021 pollutants emitted from stationary sources into the atmospheric air of Ganja and Mingachevir cities, by substances (tons).
| Cities | The total amount of pollutants released into the atmosphere | Including: | ||||
|---|---|---|---|---|---|---|
| Solid substances | Gaseous and liquid substances | From them: | ||||
| Sulfuric anhydride | Carbon monoxide | Nitrogen oxides | ||||
| Ganja | 131,9 | 33,2 | 98,7 | 2,8 | 44,1 | 14,0 |
| Mingachevir | 1880,0 | 3,5 | 1876,5 | 7,2 | 40,5 | 1816,0 |
Source: own elaboration
According to Table 4 the polluting substances with the highest index in both cities are the gaseous ones according to their state, in Ganja this indicator is about 75% (2.83% of it is sulfur anhydride, 44.68% is carbon oxide, 14.18% nitrogen oxide compounds), in the city of Mingachevir it is 97.8% (0.38% of it is sulfur anhydride, 2.16% is carbon oxide, 96.78% is nitrogen oxides). Solid substances make up 25.17% of the total pollution in Ganja city and 0.19% in Mingachevir city. An atmosphere with this characteristic composition is called compositional quality. Since the economic development and industrial importance of both research cities are almost equal to each other, this is also reflected in the environmental conditions of the atmosphere of both cities.
The discharge of household waste into water sources is a common problem since it pollutes water sources. The statistics of sewage disposal in the cities of Ganja and Mingachevir are reflected in Table 5. When analyzing the indicators, it was determined that these indicators are higher in the city of Mingachevir. Maximum statistics were observed in Ganja city in 2005, and in Mingachevir city in 2009. There is a slight fluctuation in both cities, and the numbers are roughly consistent.
Table 5 - Wastewater disposal in Ganja and Mingachevir cities, million m3
| Years | Ganja (million m3) | Mingachevir (million m3) |
| 2000 | 1,1 | 7,4 |
| 2005 | 19,0 | 18,0 |
| 2009 | 12,4 | 18,2 |
| 2010 | 12,3 | 9,4 |
| 2011 | 9,5 | 8,6 |
| 2012 | 9,2 | 8,2 |
| 2013 | 9,2 | 6,4 |
| 2014 | 8,5 | 6,1 |
| 2015 | 8,5 | 11,5 |
| 2016 | 8,8 | 10,8 |
| 2020 | 8,0 | 8,1 |
| 2021 | 8,3 | 9,3 |
Source: own elaboration
On the other hand, there are a number of reasons that pollute soils or limit their efficient use. Heavy metals that pollute the soil mainly appear as a result of the development of industries (Aliyev & Ismayilov, 2018). This situation became more widespread due to the development of the metallurgical industry in Ganja. The amount of heavy metals in the soil has repeatedly exceeded the permissible concentration norm. Although this situation is not very relevant in the city of Mingachevir, the fact that arable and more fertile lands remain under the urban landscapes, and settlements, greatly limits their agricultural use. This situation manifests itself more acutely in the city of Ganja. So, in addition to soil pollution with heavy metals, the area of urban landscapes is about 80% of the total city area, and due to the fact that fertile land suitable for cultivation is not used for its intended purpose, the city of Ganja becomes dependent on its surrounding regions. based on the risk factors of the existing ecological problems of the cities and their severity, ecological framework models have been created and applied for both cities. Since each element of the ecological frame is created after the environmental assessment of the current state of the cities, the system of relevant proposals is one of the most basic ways of optimization.
According to the information of the Ministry of Ecology and Natural Resources of the Republic of Azerbaijan, the Zn index in Ganja soils has increased by about 2 times, Pb has increased approximately 4 times, and Ni, Cr, Cu and Fe have also significantly increased in the corresponding years (Table 6).
Table 6 - Distribution of heavy metals in soils in the city of Ganja (a sample taken from the territory of the Aluminum factory)
| Years | Zn | Pb | Ni | Cr | Cu | Cd | Mn | Fe | Al |
|---|---|---|---|---|---|---|---|---|---|
| 2013 | 11,2 | 4,8 | 10,1 | 145 | 17,9 | 0,06 | 132,6 | 21636 | 30362 |
| 2014 | 11,47 | 4,47 | 14,3 | 257 | 14,28 | 0,28 | 184,6 | 35486 | 29587 |
| 2020 | 12,5 | 5,22 | 13,8 | 246 | 15,6 | 0,39 | 189 | 34216 | 28651 |
| 2021 | 13,8 | 5,87 | 11,6 | 197 | 18,4 | 0,57 | 165 | 33627 | 27340 |
| Concentration norms | 23 | 1,2 | 4 | 6 | 3 | - | 700 | - | - |
Source: own elaboration
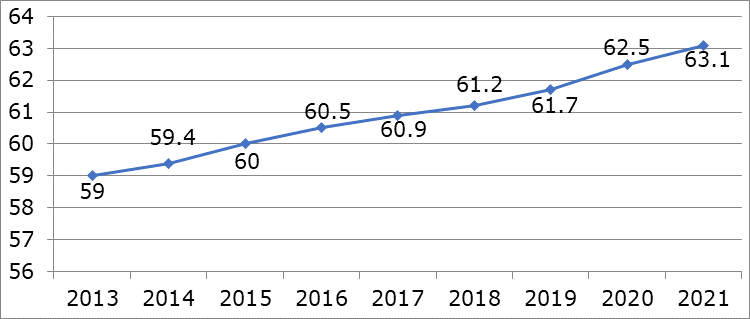
The growth of cities, population growth and its analysis can be determined on the basis of statistical data. For this, the population dynamics of Yevlakh city was studied starting from 2013 (Figure 7).
 Source: own elaboration
Fig. 7 - Dynamics of the population in Yevlakh city beteen 2013-2023 (thousands)
It was determined that the highest population increased was observed in 2019-2020. A number of factors influence this. One of these factors was the Covid-19 pandemic. Population growth before and after this period was relatively small. Thus, population growth in 2014 was 0.4 thousand people, in 2015 0.6 thousand people, in 2016 0.5 thousand people, in 2017 0.4 thousand people, in 2018 0 ,3 thousand people, 0.5 thousand people in 2019, 0.8 thousand people in 2020, and 0.6 thousand people in 2021.
Conclusions
The availability of new and reliable information allows decision makers to better understand the city's environment in real time. A deep understanding of urban realities can help inform public policy and smart city planning, improve resource allocation, and address key issues in areas such as transportation, public safety, energy use and resource management. On the other hand, data collection and analysis can help improve cities' performance and quality of life. By knowing about the use and consumption of resources such as energy and water, patterns of inefficiency can be identified and solutions that optimize resources and reduce waste can be implemented. Similarly, monitoring of environmental variables such as air and water quality may be necessary to solve environmental problems and improve public health.
For this, it is possible to use different sources in the study of urban landscapes which include both traditional and modern sources. When studying urban landscapes with traditional methods, it is important to conduct field studies, however, modern methods allow to achieve higher results in a shorter time. The sources used in the study of urban landscapes can be summarized as follows: field studies, atlases, Internet resources, satellite images, census materials, annual statistical materials, data of meteorological stations, etc. We would like to notice that the analysis of satellite images allows to conduct analyzes covering a long period in a short time meaning saving both time and money. Therefore, we hope that the information analyzed in this work will be relevant for future research.

