


 Servicios personalizados
 texto en
  Inglés (pdf)
 Articulo en XML
 Referencias del artículo
 Enviar articulo por email
 Citado por SciELO
  Similares en
SciELO
Similares en
SciELO 
 Permalink
INTRODUCTION
The green pigeon pea [Cajanus cajan (L.) Mill sp.] Is native to India and later developed in Africa. It is one of the main vegetable crops of the tropics and sub-tropics, cultivated in approximately 50 countries in Asia, Africa and America, mainly interspersed with cereals. Its tolerance to drought and the ability to use residual moisture during the dry season make it an important crop (Sheldrake, 1984; Sandoval et al., 1991; Robledo, 2010).
The production of pigeon pea occupies the sixth place in comparison with other grain legumes, such as beans, peas and chickpeas. India is the largest producer with 3.4 million ha, followed by Myanmar (580 000 ha), China (60 000 ha) and Nepal (28 000 ha). About 95% of the production comes from South Asia, where 90% belongs to India, (Neme & Sheila, 1990; PASOLAC (Programa para la Agricultura Sostenible en Laderas de El Salvador), 2000; Robledo, 2010; Duke, 2012).
PASOLAC (Programa para la Agricultura Sostenible en Laderas de El Salvador) (2000), mentions that the pigeon-hound adapts well to low and medium altitudes ranging from 0-1500 meters above sea level; the optimal temperatures go from 18-35ºC and the precipitations from 700-2500 annual millimeters. The production of pigeon pea varies, according to Abrams & Julia (1973), depending on the technology used, being affected mainly by the type of soil and yields grain, yields between 568.18 and 1362 kg / ha depending on the pruning of the plants at a height between 0.8 and 10 meters, which increases the number of pods and the production of grains. Research carried out by (CIAT (Centro internacional de Agricultura Tropical), (1983), showed that one hectare of pigeon pea can produce an average of 4 to 5 tons of green grains, 1 ton of dry grain and 10 to 14 tons of green fodder. Riollano et al. (1962), reported that in Puerto Rico, 7.5 t / ha of green pods were harvested when using a density of 8 100 plants per hectare, sown in April.
According to Gane (1972), the mechanization of the processes to achieve greater efficiency in obtaining green beans during the shelling of beans, peas and pigeon pea, dating from the late eighteenth century when there were countless teams. The first revolutionary step occurred in 1885 when Madame Faure presented, at the Paris exhibition, her manual peeler machine, whose principles have been incorporated into all successful modern harvesters. Likewise, Scott, (1888), developed a design, which used power transmission mechanism, so that the activation of a lever generated the necessary rotations so that several blades made the process of cutting and separating the sheath and thus achieve separation of grains and pods.
The study of the physic-mechanical properties of grains provides scientific knowledge; essential to efficiently improve the design and construction of equipment and structures for the management, collection, transportation, cleaning, classification, and agro-industrial processing. However, according to Villamizar et al. (2004), there is little knowledge of the physical and mechanical characteristics of many products of plant origin. These properties constitute basic engineering information, essential for the design and optimization of machinery, equipment, structures and processes. The ignorance of these properties leads to inefficient agro industrial processes, where the design and construction of equipment, structures and agro-industrial processes are based on empirical knowledge and also in most cases, imported machinery is used adding higher investment costs. Castro, (1996) and Ospina & Julio (2001), state that the knowledge of the physical properties of grains and seeds, constitute a fundamental engineering information to adapt and operate machines, design and build storage structures, assemble adequate transportation systems; In addition, it is a fundamental parameter for packaging design, quality analysis and process control. This work aims to determine the physical-mechanical properties of grains and pods of green pigeon pea of the variety Gwailor-3, for use as parameters of design and operation of a machine for the shelling of green pigeon pea.
METHODS
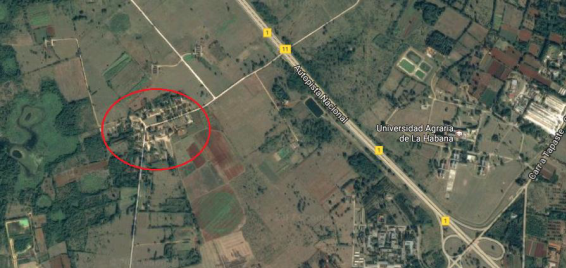
The samples of green pigeon pea, were taken from the "Guayabal" farm, belonging to the Institute of Animal Sciences (ICA) located in the municipality of San José de las Lajas, Mayabeque Province (Figure 1).
For the sampling, the green pigeon pea (Cajanus Cajan) Gwailor-3 variety, was selected in full harvest maturity and the sampling was carried out at random.
The size of the sample was determined from a pre-experiment of Luyarati, (1997), through the following expression:
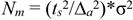
Where:
σ |
- typical deviation or standard deviation; |
ts |
- coefficient that depends on the confidence level and the number of samples, is determined for a student’s t distribution; |
Δa |
- maximum permissible error of the mean. |
The arithmetic mean is determined as:

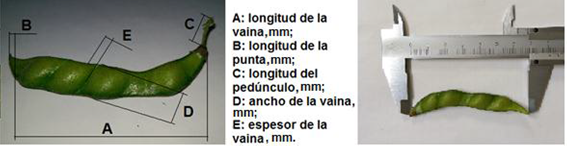
Among these properties are the dimensional characteristics of the grains and pods, as well as their mass and coefficients of friction in relation to surfaces of different material. Once the sample was selected, the dimensional characteristics of the pods and grains were determined by using a caliper of 0-150 mm, brand SIMCT., With an accuracy of 0.02 millimeters.
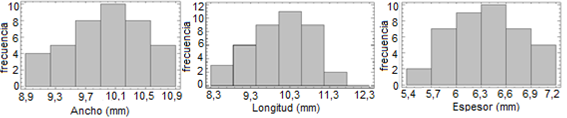
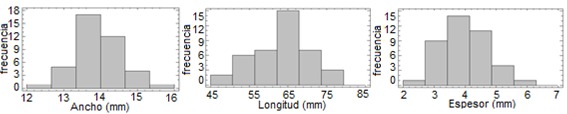
The dimensions that were measured in the pods were: the length of the pod (A), the peduncle (C) and the tip (B), the width of each pod (D) and the thickness of the pod €, (Figure 2).
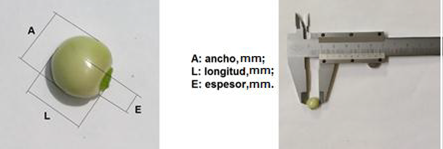
In the case of grains, the main dimensions were determined, length (L) (greater dimension), width (A) (medium dimension) and thickness (E) (smaller dimension), to a sample of 40 grains (Figure 3).
The geometric mean (Dg) and arithmetic diameter (Da) was determined according to Mohsenin (1986).
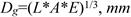
For the determination of the mass, a College scale balance was used, with a precision of 0.01 grams (Figure 4).
The mass of the pods was determined individually and in the case of grains the methodology exposed by Vilche et al. (2003), weighing 5 sub-samples of 100 seeds each and extracting the result for 1 000 grains.
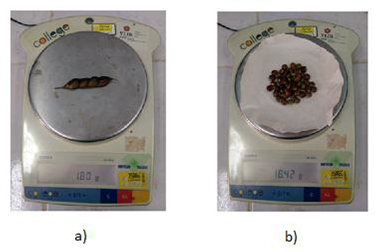
To determine the angle of friction, an inclined plane was used in which three surfaces were placed separately: steel, wood and rubber, completely clean (Figure 5).
The friction angle between the material of the pigeon pods and the surfaces described above was determined after placing the sheath on the surfaces and moving the ramp from the horizontal position (0 °) until obtaining the angle at which the pod begins to slide. This angle was measured with the semicircle graduated with precision up to 1º which is in the inclined plane.
In the case of grains, the friction angle was determined applying the same procedure as for the pods, with the difference that the grains were grouped in groups of three with adhesive tape to prevent rolling (Figure 6)
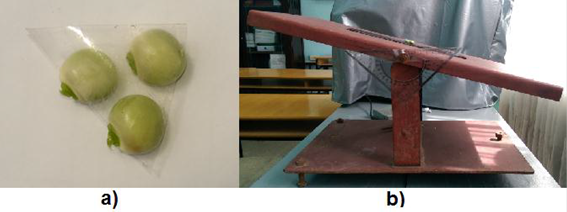
FIGURE 6 Determination of the angle of friction of the grains, a) grains together with adhesive tape, b) inclined plane.
In both cases for the calculation of the coefficient of static friction (Cd) the following expression was used.

For the statistical mathematical processing of the data, the following programs were used: Statgraphics plus, version 5.1 (in Spanish) and Excel 2010. A descriptive analysis of the experimental data was carried out, determining the Arithmetic Mean ( ), the Typical Deviation of the mean (σ), the Error of the mean (Δr) and the Variation Coefficient (CV).
RESULTS AND DISCUSSION
The result of the pre-experiments, it was obtained that the number of samples necessary for the realization of the experiment must be greater than 38. Taking 40 grains and 40 pods for the realization of the experiments, in order to guarantee greater precision in the final results.
In table 1, the results of the descriptive analysis performed on the grain and pod dimensions are appraised.
TABLE 1 Descriptive analysis starting from dimensions of grains and sheaths
| Granos | Vainas | |||||
|---|---|---|---|---|---|---|
| Ancho | Largo | Espesor | Ancho | Largo | Espesor | |
| Media(mm) | 9,99 | 10,08 | 6,40 | 13,90 | 63,42 | 3,97 |
| Desv. Std. | 0,48 | 0,74 | 0,43 | 0,67 | 7,37 | 0,75 |
| Error de la media, % | 0,50 | 0,50 | 0,32 | 0,70 | 3,17 | 0,20 |
| Mínimo | 9,0 | 8,5 | 5,5 | 12,5 | 46,8 | 2,2 |
| Máximo | 10,8 | 11,7 | 7,1 | 15,8 | 78,9 | 6,0 |
| Rango | 1,8 | 3,2 | 1,6 | 3,3 | 32,1 | 3,8 |
In the previous table it is observed that the width of the pods ranges between 12.5 and 15.8 mm, the length is between 46.8 and 78.9 mm. Similar results were obtained by Sheahan (2012), who obtained pod lengths between 50.0 and 90.0 mm and widths of around 12.0 mm for this crop.
While for the grains the length, width, thickness, of the grains varies between 8.5 and 11.7 mm; 9.0 and 10.8 mm and 5.5 and 7.1 mm, respectively. The geometric mean diameter of 9.06 and the arithmetic of 8.63 mm, according to the three characteristic dimensions of the grains. The length, width, thickness and geometric diameter of pigeon seeds in India according to Khan et al. (2017), ranged from 4.9 to 6.9 mm, from 4.52 to 5.40 mm, from 4.10 to 4.70 mm and from 4.95 to 5.45 mm, respectively. Very similar results were obtained by Sobukola & Onwuka (2011), in the cultivation of the carob tree in the seed where the length, width, thickness and geometric mean diameter ranged between 10.00 and 11.72 mm; 7.80 to 9.22 mm; 4.00 to 4.85 mm; and 6.78 to 8.06 mm, respectively. Like Shirneshan (2011) in grains where the geometric mean diameter varied from 3.2 to 8.4 mm, respectively.
The above shows the commercial quality of the green locust bean, the Gwailor-3 variety.
In the frequency histograms obtained (Figure 6), we can see a close to normal distribution of the behaviors of the values of each variable for the case of grains.
In the case of the pods, in practical terms, significant differences are observed during the mutual comparison of the three magnitudes.
The lower error values of the mean are seen in the thickness characteristic, where it reaches 0.20 while the maximum values are found in the characteristic of the length, with a value of 3.17 (Table 1).
According to the frequency histograms obtained (Figure 7), we can see a close to normal distribution of the behaviors of the values of each variable.
The results obtained during the evaluation of the possibility of separation of the grains and pods are shown in table 2.
TABLA 2 Comparison of the thickness of the grains and the sheaths
| p-valor | Intervalo de confianza | Sesgo estandarizado | Curtosis estandarizada | |
|---|---|---|---|---|
| Espesor de los granos | 0,004 | 95% | -0,407 | -1,157 |
| Espesor de las vainas | 0,004 | 95% | 0,4810 | 0,537 |
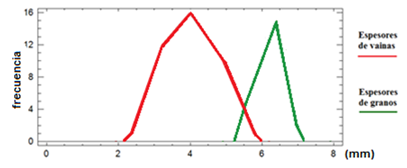
Since the p-value is less than 0.05, there are statistically significant differences during the mutual comparison of the thicknesses of grains and pods, for a confidence level of 95%. These results assume that the populations from which the samples come can be represented by normal distributions.
The above can be observed when analyzing the frequency of distribution of these dimensions and the box and whisker plot (Figure 8), observing the existence of significant differences between the compared dimensions of grains and pods.
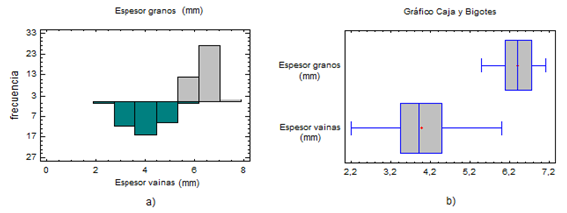
In Figure 9, the analysis of the variation curves of distribution of grain and pod dimensions is shown. It shows the existence of a small overlap between the thickness of the pods and the grains, which shows that it is possible to separate these two components, although not total, since a small part of the grains will pass through the rolls mixed with pods. This result does not affect the quality of the process taking into account that the smaller grains do not meet the dimensional conditions required in the final product.
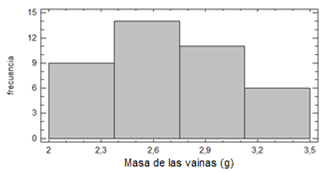
The results of the descriptive analysis for the mass of the beans and pods are shown in table 3.
TABLE 3 Descriptive analysis of the data of the mensurations of the mass of the grains and the sheaths
| Masa de 1000 granos | Masa de las vainas | |
|---|---|---|
| Media (g) | 358,8 | 2,70 |
| Desv. std | 0,17 | 0,38 |
| Error de la media, % | 3,58 | 0,27 |
| Mínimo | 358,6 | 2,13 |
| Máximo | 359,0 | 3,37 |
| Rango | 0,04 | 1,24 |
As shown in Table 3, there are significant differences during the mutual comparison of the masses. The lower values of error of the mean are observed in the case of the pods, where it reaches a value of 0.27, while the maximum values are found in the grains, with a value of 3.58.
In the frequency histogram (Figure 10), a close to normal distribution of the behaviors of the values for the mass of the pods is observed.
The results of the determination of the friction angle of pods and grains on wood, rubber and steel are shown in Table 4.
TABLE 4 Certain statisticians for the angle of friction
| Ángulo de fricción (º) | ||||||
|---|---|---|---|---|---|---|
| Granos | Vainas | |||||
| Goma | Madera | Acero | Goma | Madera | Acero | |
| Media (º) | 43.60 | 21.07 | 20.13 | 34.90 | 35.38 | 25.95 |
| Desvstd | 3.00 | 1.28 | 1.13 | 2.58 | 4.00 | 4.45 |
| Error de la media (%) | 4.36 | 2.11 | 2.01 | 1.75 | 1.77 | 1.30 |
| Mínimo | 39.0 | 19.0 | 18.0 | 28.0 | 28.0 | 18.0 |
| Máximo | 50.0 | 23.0 | 22.0 | 41.0 | 44.0 | 36.0 |
| Rango | 11.0 | 4.0 | 4.0 | 13.0 | 16.0 | 18.0 |
In Table 4 it can be seen that in the case of grains, the smaller average for the friction angle was obtained in the steel surface 20.13º, while the greater one is given for the rubber surface 43.6º. Similar results were obtained by Shirneshan (2011), for grains where the average values showed that the lowest static coefficient 0.32 occurred with galvanized steel and the highest 0.40 and 0.44 for rubber and canvas, respectively.
In turn, the frequency histograms (Figure 11) show a normal distribution of the behaviors of the values of each variable during the analysis of the friction angles between the grains and the different surfaces.
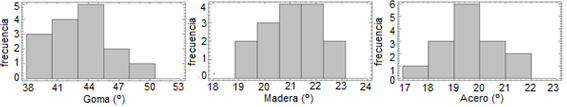
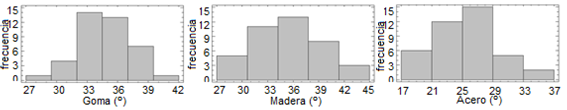
Something similar happens for the case of the angle of friction of the pods, where the results show that the smallest average for the friction angle is obtained in the steel surface, with 25.95º, however in this case the highest values of angle of friction are given for the wood surface with 35.38º, although very similar to that of the rubber with 34.90º (Table 4).
Which means that the most convenient material to use is the rubber to cover the contact surfaces which will allow the feed to the sizing rollers progressively avoiding jamming.
Similarly, when the grain (43.60 º) has a friction angle greater than the sheath (34.90 º), we can advise that the separating screen of both be covered with rubber.
When analyzing the frequency histograms (Figure 12), a close to normal distribution of the behaviors of the values of each variable is observed.
CONCLUSIONS
In the grains of green pigeon pea l variety Gwailor-3 the length, width, thickness, of the same varies between 8.5 and 11.7 mm; 9.0 and 10.8 mm and 5.5 and 7.1 mm, respectively. The geometric mean diameter of 9.06 and the arithmetic of 8.63 mm, guaranteeing its commercial quality.
The average friction angle of the grains on rubber, wood and steel surfaces is 43.6º; 21.07º and 20.13º respectively and for pods of 34.9º; 35.38º and 25.95º, which means that the most convenient material to use is the rubber to cover the contact surfaces, which will make it possible to feed the desicating rollers progressively, thus avoiding the jamming of the same, as well as the separation of pods and grains.

