


Mi SciELO
 Servicios personalizados
Servicios Personalizados
Articulo
 texto en
  Inglés (pdf)
 Articulo en XML
 Referencias del artículo
 Enviar articulo por email
Indicadores
-
 Citado por SciELO
Links relacionados
-
 Similares en
SciELO
Similares en
SciELO
Compartir

 Permalink
Revista Cubana de Ciencias Forestales
versión On-line ISSN 2310-3469
Rev CFORES vol.12 no.1 Pinar del Río ene.-abr. 2024 Epub 01-Abr-2024
Original article
Sawnwood yield prediction Pinus caribaea Morelet var. caribaea Barret & Golfari in Pinar del Rio, Cuba
1Universidad Mariem NGuabi. Congo.
2Universidad de Pinar del Río "Hermanos Saíz Montes de Oca". Pinar del Río, Cuba.
The objective of this study was to use mathematical models for the prediction of sawnwood yields based on dendrometric parameters of standing trees, which allow an adequate definition of their potential in the Combate de la Tenería sawmill. Sawnwood yields are influenced by the position of the log in the tree trunk, with a decrease depending on the height. The four equations constructed to determine the yield of sawnwood have acceptable correlation and determination coefficients and low standard errors of estimation. However, the best behavior is shown by the model Ln (rend) = 1.084 + 0.464 * l n d 1.30 0.1201 l n which has the best fit, the independent variables explain 67% and the lowest value of the standard error of estimation. Based on the elasticity analysis, the diameter can be defined at 1.30 m, it is the predictor variable with the greatest positive influence on the increase in sawnwood yields. Taper has a negative effect on the volume and value of sawnwood. The use of the statistical control of saw detected that the process is out of control, which implies the need to carry out the corresponding analysis to eliminate this deficiency.
Key words: tree; dimensions; sawmill; efficiency; quality
INTRODUCTION
Different studies have been carried out related to the determination of sawnwood yields, taking into consideration the characteristics of the logs, the use of statistics and mathematical programming, but they present the limitation that they do not take into consideration the dendrometric variables. and the quality of standing trees, without which the planning of activities related to wood supply does not present the desired accuracy (Sharna y Zhang, 2004; Zhang et al., 2005, Liu et al., 2007 y Estremera y Rodríguez, 2021).
However, in works developed in Canada, the United States, Germany, and Sweden, they do take into consideration the dendrometric characteristics of standing trees to predict sawnwood yields (Zhang et al., 2006 y Liu et al., 2007). Thus, it is established that it is essential in wood sawing processes to take into consideration the relationship between sawnwood yields and the dendrometric characteristics of the trees.
Establishing the relationship between tree characteristics and product value can be used in the mechanical wood processing industry to estimate the potential of individual trees and the stand before they are felled. This relationship can be useful for the strategic development of sustainable forest management.
The objective of this research was to use mathematical models for the prediction of sawnwood yields based on dendrometric parameters of standing trees that allow an adequate definition of their potential in the sawmill.
MATERIALS AND METHODS
The work is carried out at the Combate de la Tenería sawmill, belonging to the Macurije Agroforestry Company, located in the westernmost region of the province of Pinar del Río, covering parts of the territories of the Guane and Mantua municipalities.
Determination of sample size and sampling intensity
The data were taken from a population of 954 trees belonging to stands 21 and 19 of lot 22 of the Guane Forestry Unit, from which, through random sampling, a pilot sample of 58 trees was taken to determine the number of representative units for the study, having as the variable of interest the diameter at 1.30 m height of the tree, to determine the number of representative units for the study, based on the following equation for infinite population (Ortiz et al., 2016; Borges et al., 2019) Equation 1:
Where: n- sample size; t2 á - tabular value of t (a= 0.05); with (n-1) degrees of freedom; S 2 Estimated variance; E Allowable error (10 %); N- total number of trees measured.
From which resulted a sample of 106 trees that were marked standing and after being felled, their diameters were measured at 1.30 m, diameters of the ends of the logs and their lengths, this marking procedure is necessary for subsequent identification and measurement of variables in the sawmill such as the taper and volume of the logs and volume of sawnwood
Mathematical modeling of the influence of dendrometric parameters of standing trees on sawnwood yields
To obtain the percentage yield, the following relationship was used based on the work carried out by Barth et al. (2016); Cevallos et al. (2017) y Leyva et al. (2017). Equation 2:
Where: Rv - Total volumetric yield, %; Vma - Volume of sawnwood, m 3 ; Vt - Volume of wood in logs, m 3 .
The volume of total sawnwood in each log in the sawmills is determined based on the linear measurements obtained from the sawnwood according to the expressions set forth below (Orozco et al., 2016; Leyva et al. 2020) Equation 3:
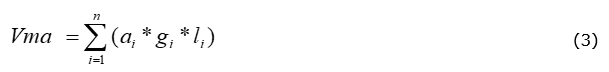
Where: Vma- Volume of sawnwood from a log, m3; a, g, l width, thickness and length of the piece i obtained from a log or group of logs, m; n- Number of sawn pieces of a log
The calculation of the raw volume of each log is carried out using the Smalian formula in correspondence with the work developed by Alzamora et al. (2019) and Casagrande et al. (2019) Equation 4:
Where: Vmb - volume of the bolus (m3); g1, basal area at the fine end (m2); g2, basal area at the thick end (m2); L, length of the log (m).
For the prediction of the estimated yield of sawnwood, simple, multiple and stepwise linear regression was used, taking into consideration the models shown below, Equation 5, 6, 7 and 8:
To determine the conicity of standing trees, work carried out by Kozakiewiz et al. (2018) was taken as a reference. and Álvarez et al. (2020), which take into consideration the lower value of the first two logs, using the following mathematical expression Equation 9:
Where: Con-taper, cm /m; D 1 -Smaller diameter of the log, (cm); D 2 - Largest diameter of the log, (cm); L - Length of the log, (m)
1.30), stem height (commercial) and taper were used as independent or predictor variables, and the yield of sawnwood was used as a response or dependent variable.
In determining the quality of the proposed models, the following aspects were taken into consideration:
Theoretical assumptions: normality, homoscedasticity and serial independence of the residuals using the Durbin Watson test. The presence of multicollinearity between the predictor variables is evaluated using the variance inflation factor (VIF) (Maddala, 1996 and Najera et al., 2012), assuming for those equations that presented a VIF greater than 10 for some of their independent variables
Goodness of fit: adjusted coefficient of determination (R^2 adj), the standard error of the estimate (S x), and the statistical significance of the adjusted regression coefficients. Those models that presented at least one non-significant parameter other than zero were eliminated.
Validation of regression models
It is proposed that the most important process after a model has been obtained is validation. Its main objective is to ensure that the results are generalized to the entire population and not specific to the sample used in the estimation (Hair et al., 1999).
The data used for validation are different from those used to fit the models; coinciding with the approaches of Alder (1980). Bias and mean square error were used as prediction statistics Equation 10:
Where: Ç- bias; Y i - observed value; 𝑌 𝑖 - - predicted value; N- total number of data used Equation 11:
Where: Where: EMC-mean square error; Y i - observed value; - predicted value; N- total number of data used; P-total number of parameters to estimate
Evaluation model using elasticity analysis
Yields in value of sawnwood from individual trees will be quantified based on the diameter at 1.30 m, the diameter of the root of the tree, the total height of the tree, the height of the first branch of the tree, the height of the crown of the tree and the taper of the stem; so we have the following expression: agreeing with Zhang et al. (2005). Equation 12:
Where: R f - Represents the values of the Con- Conicity of the stem, (cm/m).
The elasticities of the outputs were determined in the following ways Equation 13 and 14:
For d 1.30 m
For taper
Determination of sawing variation from the implementation of statistical control of the sawing process
To carry out the pertinent analysis, in the Combate de la Tenería sawmill, 100 sawn pieces of Pinus caribaea have been taken coinciding with the methodology proposed by Leyva et al. (2017) and Álvarez et al. (2020).
For each piece of sawnwood, six measurements were taken, three on each edge, equidistant along them, taking care to establish a permanent sequence of measurements with respect to the direction of exit of the pieces from the saw, with the aim of identifying possible problems in the equipment. Measurements are made with a caliper to the precision of the tenth of a millimeter, in areas of healthy wood, avoiding knots, rot and other defects.
Due to the complexity and volume of the calculations, especially in the calculation of thickness variations in the sawing when a large sample is available, it was necessary to find an agile and feasible tool for data processing, which is why use the CONTROL program (Álvarez et al. 2020).
For this, the Control software version 5.1 was used, which allows determining the optimal sawing dimensions; as well as the determination of the variation in thickness, which is based on the formulation proposed by Brown (1986) and Álvarez et al. (2020), for the calculation of the optimal dimension of the assortment and other parameters described below Equation 15:
Calculation of the optimal dimension (Do)
Where: Do -Optimal green wood cutting dimension, mm; DF- Final dimension, mm; TC- Tolerance for brushing on both sides of the assortment, mm; %C- Wood shrinkage tolerance, %; Z- minimum acceptable dimension factor (dimensionless); St - Total sawing variation, mm Equation 16, 17 and 18:
Sd - standard deviation of the sawing process within the parts (mm);
Se- standard deviation of the sawing process between pieces, mm.
Where: S^2 (x)- represents the variance of the average thicknesses of each sampled piece; n-number of measurements per piece.
Dc ) must be taken into consideration , which is related to the dimension of the green wood, if pieces could be produced without sawing variation. The mathematical expression that makes it possible to determine this dimension is the following Equation 19:
The data from the analyzed samples are processed using the CONTROL program, considering the following specific aspects:
DF = 25 mm;
TC = 0;
C= tangential contraction of Pinus wood caribaea of 4.30% according to Ibáñez (1975); Z- 5 % according to Zavala (1991), Najera (2011) and Álvarez et al. (2020).
RESULTS AND DISCUSSION
Determination of sawnwood yields
In Figure 1, shows that sawnwood yields decrease from the base to the tail; which is a direct consequence of the increase in conicity due to the decrease in diameters with height; coinciding with Najera et al. (2012).
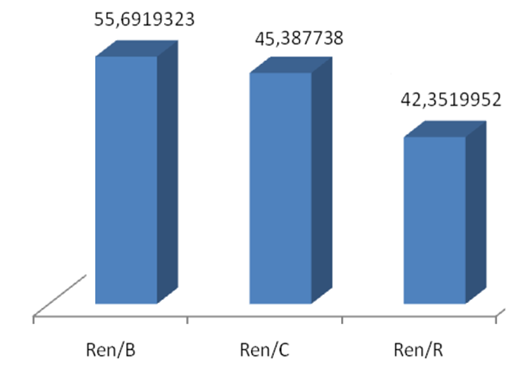
Fig. 1. - Frequency of performance in different positions of the tree trunk. Ren/B-yield at base (%); Ren/C- performance in the center (%); Rend /R-yield at the top (8 %).
The results presented above demonstrate that diameter is a dendrometric variable that has a direct relationship with sawnwood yields, coinciding with Ortiz et al. (2016); Álvarez et al. (2020) and Leyva et al. (2020).
As the diameter increases, the yield of the logs in sawing also increases. Which implies in the processing of small-sized wood, low levels of performance and less profit for the sawmill.
Models to estimate the yield of sawnwood from dendrometric variables
Using the independent variables with the greatest relationship with the dependent and response variable, equations for estimating the yield of sawnwood were obtained. The compared models are seen in Table 1, with their respective coefficients of determination (R2) and standard error of estimation (S).
Table 1. - Models to determine wood yield in standing trees
| Regression models | R 2 | S |
| L n ( rend ) = 1.013 + 0.0519 * l n d 1.30 (20) | 0,657 | 0,032 |
| Ln (rend) = 1,084 + 0,464 * ln d1,30 - 0,1201 ln Con (21) | 0,671 | 0,031 |
| Ln (rend)= ln 7,27119601 + (1,02303964 * ln (d1,30)) (22) | 0,654 | 0,11 |
| L n (rend) = l n 0.16089255 + (l n (1.2660825) * d 1.30) (23) | 0.657 | 0.11 |
The four equations constructed to determine the yield of sawnwood have acceptable correlation and determination coefficients and low standard errors of estimation. However, the best behavior is shown by model (20):
Ln (rend) = 1.084 + 0.464 * l n d 1.30 0.1201 l n that has the best fit (the independent variables explain 67 % and the lowest value of the standard error of estimation.
The present model also agrees with the assumptions of Durbin-Watson independence with a value of 2.038, the homogeneity of variance and the assumption of multicollinearity with a tolerance of 0.308.
Table 2 shows the prediction capacity of the model that provides the best results, showing the low values of the mean square error, bias and standard deviation of the residuals. These results correspond to those obtained by Sánchez et al. (2003).
Evaluation model using elasticity analysis
The relationships derived from regression models can be used to characterize some properties, among which elasticities and the interaction between dependent and independent variables stand out (Liu et al., 2007) .
The elasticities of the outputs in the model Ln (rend) = 1.084 + 0.464 * ln d1.30 0.1201 l n with in the case of sawnwood are illustrated as follows Equation 20 and 21:
For d1.30 m
The contribution of the predictor variables on the yield of sawnwood is:
0.464 d1.30 m
- 0.120 for taper
Which indicates that d 1.30 m is the factor of greatest significance and influence on the volume of sawnwood produced in a positive way. On the other hand, taper has a negative effect, which makes it possible to establish that sawnwood yields decrease with an increase in taper (Tong and Zhang, 2006).
The relative value of sawnwood shows an increase as a function of d1.30 m, which is quantified based on the following mathematical expression Equation 22:
Which establishes that the increase of 1 % of d 1.30 can cause an approximate increase of 0.464 % of the yield in value of the sawnwood, which denotes a positive contribution of d 1.30 m on the magnitude of the value of sawnwood.
It is significant to define that the taper presents an inverse effect as set out in the following mathematical expression Equation 23:
With which it is established that the increase of 1 % of the taper causes a negative effect or reduction of yields in sawnwood values of -0.120 %; agreeing with Zhang et al. (2006).
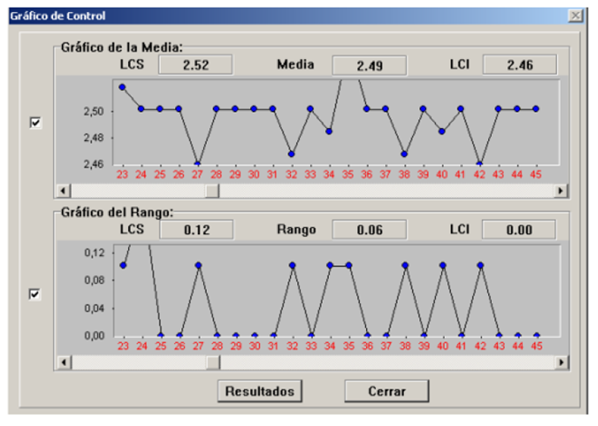
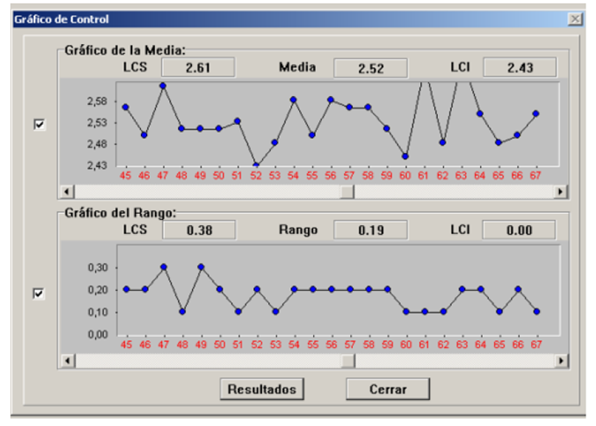
Statistical control of the saw process at the Combate de la Tenería sawmill
In the Combate de la Tenería sawmill, belonging to the EAF Macurije, there is a generalized oversizing of the sawnwood, which can be seen in Table 3. These results coincide with those obtained by Álvarez et al. (2020) and Leyva et al. (2020).
Table 3. - Results related to the analysis of sawing variation in the sawmill
| Parameters | 25mm thick pieces | |
| 3 m long piece | 4 m long piece | |
| Optimal dimension (Do), mm | 26,40 | 27,50 |
| Final dimension ( Df ), mm | 25,00 | 25,00 |
| Optimum dimension (Do), mm. | 26,30 | 27,54 |
| Critical dimension ( Dc ), mm. | 25,48 | 25,48 |
| Variation within pieces ( Sw ), mm | 0,00371 | 0,0726 |
| Variation between pieces (Sb), mm | 0,0210 | 0,07 |
| Total process variation (St), mm. | 0,0427 | 0,11 |
According to the average thickness values for the pieces represented in Table 3, values are shown for the species, above what was established as the final dimension (25 mm), with variations greater than 1.5 mm, representing a considerable loss. of sawnwood, which implies the need to develop the statistical process control process in the sawmill; coinciding with Barrera et al. (2016).
The use of the Control program to determine the optimal dimensions of sawnwood, as well as the construction of control charts (Figure 2 and Figure 3). It constitutes an appropriate tool for making decisions aimed at increasing the yield and quality of timber; exposing that automation constitutes an excellent tool for data management and decision making in sawmills.
CONCLUSIONS
The contributions of the predictor variables in sawnwood yields indicate that the diameter at 1.30 m is the most significant factor,
Based on the elasticity analysis, the diameter at 1.30 m can be defined as the predictor variable with the greatest positive influence on the increase in sawnwood yields.
The use of the Control program to determine the optimal dimensions of sawnwood, as well as the construction of control charts, constitutes an appropriate tool for making decisions aimed at increasing the yield and quality of sawnwood.
REFERENCIAS BIBLIOGRÁFICAS
ALDER, D. 1980. Estimación del volumen forestal y predicción del rendimiento con referencia especial a los trópicos. Estudios FAO. Montes 22/2, Roma. Itália. 118 p. [ Links ]
ÁLVAREZ LAZO, D., DOMINGOS SEBASTIAO, J.D., NAZARE BUANGA LELO, F.N., SILVA FUENTES, S., y ESTEVES VALDES, I., 2020. Análisis de la calidad del aserrado de maderas tropicales en Cabinda, Angola. Revista Cubana de Ciencias Forestales [en línea], vol. 8, no. 1, [consulta: 20/06/2023]. ISSN 2310-3469. Disponible en: Disponible en: https://cfores.upr.edu.cu/index.php/cfores/article/view/452 . [ Links ]
ALZAMORA, R.M., PINTO, A., ULLOA, C., y AGUILERA, A., 2019. Modelamiento de la eficiencia productiva de trozas de lenga (Nothofagus pumilio) destinadas a la producción de madera aserrada en la Patagonia chilena. Madera y bosques [en línea], vol. 25, no. 3, [consulta: 20/06/2023]. Disponible en: Disponible en: https://www.redalyc.org/journal/617/61762764005/ . [ Links ]
BARRERA BUSTAMANTE, A., ÁLVAREZ LAZO, D., PEÑALVER ROMERO, A., LECKOUNDZOU, A., RAMÍREZ LARA, A., y FERNANDO EGAS, A., 2016. Aplicación del proceso de control estadístico para incrementar la calidad de la madera aserrada en La Empresa Forestal Integral Gran Piedra Baconao Santiago de Cuba. Revista Cubana de Ciencias Forestales [en línea], vol. 4, no. 1, [consulta: 20/06/2023]. ISSN 2310-3469. Disponible en: Disponible en: https://cfores.upr.edu.cu/index.php/cfores/article/view/143 . [ Links ]
BARTH, S.R., GIMÉNEZ, A., JOSEAU, M., GAUCHAT, M.E., y VIDELA, D.. 2016. Influencia de la densidad de plantación y la posición sociológica en el rendimiento y la calidad de madera aserrada de Grevillea Robusta A. Quebracho [en línea], vol. 24, no. 1-2, Disponible en: https://www.researchgate.net/publication/346939233_Influencia_de_la_densidad_de_plantacion_y_la_posicion_sociologica_en_el_rendimiento_y_la_calidad_de_madera_aserrada_de_Grevillea_Robusta_A. [ Links ]
BORGES DE LIMA, R., CARACIOLO FERREIRA, R.L., ALEIXO DA SILVA, J., CARNEIRO GUEDES, M., SILVA DA SILVA, D., PEREIRA DE OLIVEIRA, C., GALVÃO RABELO, F., y CRUZ SILVA, L.F. da, 2019. Effect of species and log diameter on the volumetric yield of lumber in northern Brazilian Amazonia: preliminary results. Journal of Sustainable Forestry [en línea], vol. 38, no. 6, DOI 10.1080/10549811.2019.1636661. Disponible en: https://www.researchgate.net/publication/334057755_Effect_of_species_and_log_diameter_on_the_volumetric_yield_of_lumber_in_northern_Brazilian_Amazonia_preliminary_results. [ Links ]
BROWN, T.D., 1986. Lumber Size Control [en línea]. Estados Unidos: Forest Research Lab, College of Forestry, Oregon State University. Disponible en: https://books.google.com.cu/books/about/Lumber_Size_Control.html?id=8uUOAQAAMAAJ&redir_esc=y. [ Links ]
CASAGRANDE STRAGLIOTTO, M., COSTA OLIVEIRA, A., CORRADI PEREIRA, B.L., y MELO FREITAS, J., 2019. Yield in sawnwood and residue utilization of Quarea paraenses Ducke and Erismauncitum Warn. Floresta [en línea], vol. 49, no. 2, Disponible en: https://pdfs.semanticscholar.org/867b/46d1bb2fceee9501a054d6cf4fe2778360cb.pdf [ Links ]
CEVALLOS, E., LARA, X., MOROCHO, J., DÁVALOS, M., SALAZAR, E., y LARA, S., 2017. Estudio de tiempos y rendimientos en la transformación de trozas de madera Pinus Radiata D. Don (Pino) en tablas para la elaboración de pallets. European Scientific Journal [en línea], vol. 13, no. 10, Disponible en: https://eujournal.org/index.php/esj/article/download/9144/8683. [ Links ]
ESTREMERA, D., RODRIGUEZ, Y. 2021. Modelos matemáticos para la predicción de los rendimientos y calidad de la madera aserrada. Ciencia Y Progreso, v. 6, n. 13. Disponible en: https://cienciayprogreso.cug.co.cu:443/index.php/Cienciaprogreso/article/view/381 [ Links ]
HAIR, J.F., 1999. Análisis multivariante [en línea]. España: Pearson Educación. ISBN 978-84-8322-035-1. Disponible en: https://books.google.com.cu/books/about/An%C3%A1lisis_multivariante.html?id=QV4INQAACAAJ&redir_esc=y. [ Links ]
IBÁÑEZ, A. 1975. Informe sobre nueve especies maderables cubanas. Instituto de Investigaciones Forestales. Ministerio de la Agricultura: Ciudad Habana, Cuba. 55 pp [ Links ]
KOZAKIEWICZ, P., RÊBKOWSKI, B., KOCZAN, G., y KRZOSEK, S., 2018. Influence of machining technologies and quality of logs on material losses of typical supply of Scots pine wood (Pinus sylvestris L.) destined for layered floorboards. Folia Forestalia Polonica, Series A [en línea], vol. 60, no. 4, DOI 10.2478/ffp-2018-0025. Disponible en: https://www.researchgate.net/publication/330196421_Influence_of_machining_technologies_and_quality_of_logs_on_material_losses_of_typical_supply_of_Scots_pine_wood_Pinus_sylvestris_L_destined_for_layered_floorboards. [ Links ]
LEYVA MIGUEL, I., ROJAS ROMERO, A., y SEGURADO GIL, Y., 2017. Determinación del rendimiento y calidad dimensional de la madera aserrada en aserríos en la Provincia de Guantánamo.: Revista Cubana de Ciencias Forestales [en línea], vol. 5, no. 3, [consulta: 21/06/2023]. ISSN 2310-3469. Disponible en: Disponible en: https://dialnet.unirioja.es/servlet/articulo?codigo=6222088 . [ Links ]
LEYVA MIGUEL, I., ÁLVAREZ LAZO, D., LA O MUNDIS, Y., CÉSPEDES CORREA, G., y SEGURADO GIL, Y., 2020. Rendimiento y calidad dimensional de la madera aserrada de Samanea saman Jacq. en el Aserradero de la Empresa Agroforestal Guantánamo. Revista Cubana de Ciencias Forestales [en línea], vol. 8, no. 3, [consulta: 21/06/2023]. ISSN 2310-3469. Disponible en: Disponible en: https://cfores.upr.edu.cu/index.php/cfores/article/view/579 . [ Links ]
LIU, C.M., ZHANG, S.Y., CLOUTIER, A., y RYCABEL, T., 2007. Modeling lumber value recovery in relation to selected tree characteristics in black spruce using the Optitek sawing simulator. Forest Products Journal [en línea], vol. 57, no. 4, Disponible en: https://www.researchgate.net/publication/237079761_Modeling_lumber_value_recovery_in_relation_to_selected_tree_characteristics_in_black_spruce_using_the_Optitek_sawing_simulator. [ Links ]
MADDALA, G.S., 1996. Introducción a la econometría [en línea]. México: Prentice Hall Hispanoamericana, S.A. ISBN 978-968-880-697-5. Disponible en: https://books.google.com.cu/books/about/Introducci%C3%B3n_a_la_econometr%C3%ADa.html?id=5915OwAACAAJ&redir_esc=y. [ Links ]
NÁJERA LUNA, J.A., AGUIRRE CALDERÓN, O.A., TREVIÑO GARZA, E.J., JIMÉNEZ PÉREZ, J., JURADO YBARRA, E., CORRAL RIVAS, J.J., y VARGAS LARRETA, B., 2011. Rendimiento volumétrico y calidad dimensional de la madera aserrada en aserraderos de El Salto, Durango. Revista mexicana de ciencias forestales [en línea], vol. 2, no. 4, [consulta: 21/03/2023]. ISSN 2007-1132. Disponible en: Disponible en: http://www.scielo.org.mx/scielo.php?script=sci_abstract&pid=S2007 -11322011000200007&lng=es&nrm=iso&tlng=es . [ Links ]
OROZCO CONTRERAS, R., HERNÁNDEZ DÍAZ, J.C., NÁJERA LUNA, J.A., DOMÍNGUEZ CALLEROS, P.A., GOCHE TELLES, J.R., LÓPEZ SERRANO, P.M., y CORRAL RIVAS, J.J., 2016. Rendimiento en calidad de la madera aserrada de pino. Revista Mexicana de Ciencias Forestales [en línea], vol. 7, no. 36, pp. 37-50. Disponible en: http://www.scielo.org.mx/scielo.php?script=sci_abstract&pid=S2007-11322016000400037&lng=es&nrm=iso&tlng=es. [ Links ]
ORTIZ BARRIOS, R., MARTÍNEZ, S.D., VÁZQUEZ RABANALES, D.E., y SANTIAGO JUÁREZ, W., 2016. Determinación del coeficiente y calidad de aserrío del género Pinus en la región Sierra Sur, Oaxaca, México. Colombia Forestal [en línea], vol. 19, no. 1, [consulta: 21/03/2023]. Disponible en: Disponible en: https://www.redalyc.org/journal/4239/423943446006/html/ . [ Links ]
SÁNCHEZ RODRÍGUEZ, F., RODRÍGUEZ SOALLEIRO, R., ROJO ALBORECA, A., ÁLVAREZ GONZÁLEZ, J.G., LÓPEZ SÁNCHEZ, C.A., GORGOSO VARELA, J.J., y CASTEDO DORADO, F., 2003. Crecimiento y tablas de producción de Pinus radiata D. Don en Galicia. Investigación agraria. Sistemas y recursos forestales [en línea], vol. 12, no. 2, [consulta: 21/06/2023]. ISSN 1131-7965. Disponible en: Disponible en: https://dialnet.unirioja.es/servlet/articulo?codigo=654359 . [ Links ]
SHARNA, M., ZHANG, S. Y. 2004. Variable exponent taper equation for jack pine, black spruce and balsam fir in eastern Canada. Forest Ecology and Management, n. 198, p. 39-53. [ Links ]
TONG, Q. J., ZHANG, S.Y. 2006. Modelling simulated product value recovery in relation to tree characteristics in jack pine using Optitek. Forest Product Journal, v. 56, n. 1, p. 66-72. [ Links ]
ZAVALA ZAVALA, D., 1991. Manual para el establecimiento de un sistema de control de la variación de refuerzos en madera aserrada [en línea]. Chapingo, México: UACH. División de Ciencias Forestales. Serie de Apoyo Académico, 44, Disponible en: https://chapingo.orex.es/cgi-bin/koha/opac-detail.pl?biblionumber=3641. Folleto 12962 [ Links ]
ZHANG, S.-Y., y TONG, Q.-J., 2005. Modelling lumber value recovery in relation to selected tree characteristics in jack pine using Optitek sawing simulator. Ann. For. Sci. [en línea], vol. 62, Disponible en: https://hal.science/hal-00883877/document. [ Links ]
ZHANG, S. Y., LEI, Y. C., JIANG, Z. H. 2006. Modelling the relationship of tree-level product value with tree characteristics in black spruce. The Forestry Chronicle, v. 82, n. 5, p. 630-699. Disponible en: https://www.researchgate.net/publication/272900028_Modelling_the_relationship_of_tree -level_product_value_with_tree_characteristics_in_black_spruce [ Links ]
Received: May 25, 2023; Accepted: March 04, 2024

