


My SciELO
 Custom services
Services on Demand
Article
 text in
  English (pdf)
 Article in xml format
 Article references
 Send this article by e-mail
Indicators
-
 Cited by SciELO
Related links
-
 Similars in
SciELO
Similars in
SciELO
Share

 Permalink
Cultivos Tropicales
On-line version ISSN 1819-4087
cultrop vol.42 no.3 La Habana July.-Sept. 2021 Epub Sep 30, 2021
Original article
Influence of population density on maize crop (Zea mays L.)
1Instituto Nacional de Ciencias Agrícolas (INCA), carretera San José-Tapaste, km 3½, Gaveta Postal 1, San José de las Lajas, Mayabeque, Cuba. CP 32 700
In order to determine the effect of population density on the hybrid HST-3235 maize (Zea mays L.) crop yield, a study in experimental areas of the National Institute of Agricultural Sciences (INCA) was conducted. The experiment was performed on a typical Eutric Leached Red Ferrallitic soil, under a randomized block experimental design with three treatments and three replications. Population densities were 44,444, 74,074 and 88,888 plants ha-1. The density of 88 888 plants ha-1 presented the highest yield. Planting depth influenced the emergence of corn seedlings, so not all of them emerged uniformly.
Key words: planting density; grains; hybrids; cob corn
INTRODUCTION
The dry matter production of a crop is directly related to the use of incident solar radiation. Furthermore, to achieve maximum yields in situations without significant environmental limitations, crops must take full advantage of the available solar radiation during critical moments of yield determination 1.
In corn cultivation, plant density has important effects on dry matter appearance of between plant and reproductive structures. The yield of this crop shows little stability against variations in plant density and it is highly sensitive to the decrease in the amount of resources per plant, mainly in the flowering period 2,3.
Consequently, adjusting the plant density is especially critical in this crop. The choice of density is an important factor of corn crop production within the reach of the farmer. For this reason, it is desirable for agronomists to define the relationships between the number of plants achieved per unit area in a crop and their yield, for different situations of environmental supply 4.
Population density is considered the most important controllable factor to obtain higher crop yields. In corn, it exerts a high influence on grain yield and agronomic characteristics, since grain yield increases with population density, until it reaches a maximum point and decreases when density increases beyond this point 5. Population density is one of the factors that the producer frequently modifies to increase grain yield, but it does not always establish the adequate density. If the producer uses a population density greater than the optimal one, it increases the competition for light, water and nutrients, which causes a reduction in root volume, cob number, quantity and quality of the grain per plant and increases the frequency of root and stem rotting, which favors lodging 6. On the contrary, low population densities cause problems with weeds or soil waste 7.
The relationship between grain production and population density is complex, because the best response in grain yield varies according to soil condition, climate, cultural practices, and genotype 5. The International Maize and Wheat Improvement Center (CIMMYT, according its acronyms in Spanish) suggests optimal stocking densities of 65,000 plants ha-1, for tropical maize genotypes with a plant height greater than 2.4 m 8. Work carried out on population densities in seasonal low corn hybrids, in humid tropics, showed that when increasing the density from 50,000 to 62,500 plant ha-1, they obtained the highest grain yield, since it increased by 0.30 t ha-1 (9. It was also reported that the yield increased 0.6 t ha-1, when increasing the population density from 60,000 to 70,000 plants ha-1 (10. Several studies indicated that maize differed in its response to population density as a function of genotype and environmental conditions 11.
Therefore, the objective of this study was to determine the effect of population density on the yield of the corn crop, which will allow identifying the density to obtain the highest grain yield.
MATERIALS AND METHODS
The research was developed in dry period (December) between 2017 and 2018, in experimental areas of the National Institute of Agricultural Sciences (INCA), located in San José de las Lajas, Mayabeque province, km 3½ of the road to Jamaica. It has its center at 22º59'40.79 "North latitude and 82º8'21.88" West longitude 12, at an altitude of 138 m a.s.l.
The climatic characteristics of the agroecosystem where the experiments were carried out belong to the old Havana climate-region, which extends to the northeast of the province of Havana and is characterized by presenting a short rainy period, which extends from the month from November to March, without actually producing a typical ecological drought 13.
The mean monthly temperature of the two years covered by the research ranged between 17 and 27.4 ºC in correspondence with the less hot and less rainy months (November-April) and the hottest and rainiest (May-October), respectively while monthly rainfall varied from 3.4 mm in the least rainy stage to 423.0 mm in the wettest. In this variable, it should be noted that the accumulated minors occurred in the months of December to March, the period during which the cultivation of corn was developed. Relative humidity behaved between 70 to 86 %, during the experimental stage, being higher in the rainy period.
The predominant soil in the study area is typical eutric leached Red Ferrallitic, characterized by a medium to high fertility 14.
Some chemical characteristics of the soil are shown in Table 1.
Table 1 Some chemical characteristics of the soil
| Depth (cm) | pH (H2O) | OM (%) | P (mg kg1) | K+Ca2+Mg2+ | (cmolc kg-1) | |
|---|---|---|---|---|---|---|
| 0-20 | 6.4 | 2.11 | 234 | 0.52 | 9.93 | 1.80 |
This soil is moderately deep with a slightly acidic pH, it has a low percentage of organic matter, the content of phosphorus and calcium in the soil is high; however, potassium and magnesium are low, which indicates that to achieve optimal productions it will be necessary to supply them with additional applications of nutrients to the soil, according to the needs of the crops.
Fertilization was carried out with nitrogen at the time of sowing at a rate of 50 kg ha-1 and 100 kg ha-1 of potassium, using urea and potassium chloride as carriers, respectively, it was not fertilized with phosphorus because the content in the soil it was high (Table 1).
The preparation of the soil and the sowing was carried out as recommended in the Technical Guide for the corn crop 15, establishing the hybrid HST-3235 at three planting distances (Table 2).
Table 2 Identification and description of treatments
| Treatments | Description (Seeding Density to use) |
|---|---|
| 1 | Control (0.90 x 0.30 m with 2 grains by nest) |
| 2 | 0.90 x 0.25 m with 1 grains by nest |
| 3 | 0.90 x 0.25 m with 2 grains by nest |
The surface of the experimental unit was 6 x 5.4 m, spaced 1 m wide. The management of the weeds (weeds) was carried out mechanically and manually on a weekly basis. The experiments were conducted under a randomized block design with three replications and three treatments.
Irrigation was by sprinkler with a spacing of 12 x 12 m. The irrigation regime (exploitation) was with constant interval and variable norm, Table 3 shows some irrigation data.
Table 3 Norm applied according to space to 3.0 BAR
| Number of irrigation | Date | Time of irrigation (hours) | Norm applied according to space to 3,0 BAR | |
|---|---|---|---|---|
| (mm) | (m3 ha-1) | |||
| 1 | 1st tenth/December/2018 | 1 | 15 | 146,5 |
| 2 | 2nd tenth/December/2018 | 2 | 29 | 293 |
| 3 | 3th tenth/December/2018 | 2 | 29 | 293 |
| 4 | 1st tenth/January/2019 | 2 | 29 | 293 |
| 5 | 2nd tenth/January/2019 | 2.5 | 37 | 366,2 |
| 6 | 3th tenth/January/2019 | 2.5 | 37 | 366,2 |
| 7 | 1st tenth/January/2019 | 2.5 | 37 | 366,2 |
Note: 1 mm of the cape of water be equivalet to 10 m3 ha-1
The methodology used to determine the number of plants per surface, was from the average distance between the plants in various points of the field to guarantee representativeness, it was multiplied by the distance of the median. This provides the area occupied by each plant, having the total area of the field; this is divided by that used by a plant, thus giving the number of plants on the surface 16.
No. of plants = Sn / n x c
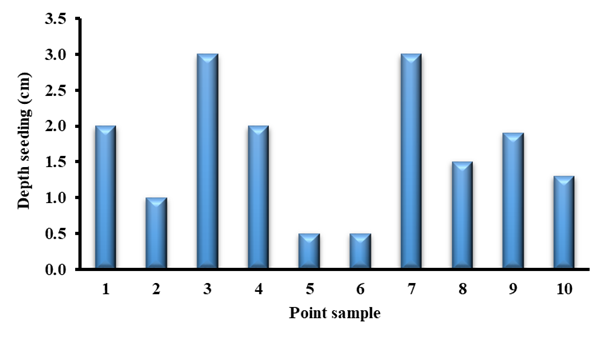
The variable evaluated was the yield (t ha-1). The sowing depth (cm) was also determined to know how the emergence of the plants influenced this variable. At different points of the experiment, the soil was removed until the plant was discovered and it was measured with a millimeter ruler from the mesocotile to the last leaf and the plant height (m). It was measured from the base of the stem to the last node where the flower is inserted, the average was taken for each plot, 70 days after emergence, 30 plants were taken at random, within the useful plot. The data obtained were statistically processed and analyzed, using the double classification analysis of variance and, when necessary, Duncan's multiple range test was performed at 5 % probability.
RESULTS AND DISCUSSION
Comparison of planting densities
A count of total plants at harvest was made to determine the plant density (Figure 1). The individual analysis by planting density had significant differences with respect to plant density. The best treatment was planting density 0.90 x 0.25 m with two grains per nest, with a plant density of 88 888, being significantly different from the other two densities of 74 074 and 44 444 plants ha-1.

The relationship between grain production and population density is complex, since the best response in grain yield varies according to the condition of the soil, climate, cultural practices and genotype 5. The International Maize and Wheat Improvement Center (CIMMYT) suggests optimal stocking densities of 65,000 plants ha-1 for tropical maize genotypes with a plant height greater than 2.4 m 8. Studies carried out on population densities in maize hybrids, under seasonal conditions in the humid tropics, showed that by increasing the density from 50,000 to 62,500 plants ha-1, an increase in grain yield of 0.30 t ha-1 was obtained 9. It has also been reported that the yield increased 0.6 t ha-1, by increasing the population density from 60,000 to 70,000 plants ha-1 (10. Several studies report differences in the response of maize to population density, depending on the genotype and environmental conditions 11, results that coincide with those obtained.
Maize (cob) crop yields
Table 4 shows the yield of corn in young cobs and in grains. The consumption of corn in Cuba is generally done when the grains are in their "tender" state. This method has the advantage of freeing the surface before the end of the crop cycle and allows to advance the entry of the new crop and, with it, the coefficient of rotation 17 is raised.
Table 4 Yield of young corn (cobs) and grains (t ha-1)
| Treatments | Yield of tender corn (t ha-1 ) | |
|---|---|---|
| Ear of corn | grains | |
| 0.90 x 0.30 m with 2 grains by nest | 9.619 b | 3.237 b |
| 0.90 x 0.25 m with 1 grains by nest | 7.223 c | 3.112 c |
| 0.90 x 0.25 m with 2 grains by nest | 11.800 a | 4.971 a |
The means followed by different letters, in the column, for each variable in joint analysis, differ from each other with the significance level of 0.05 probability, according to Duncan's test (1955). *** P˂0.001
With respect to the sowing distances 0.90 x 0.30 m with 2 grains per nest and 0.90 x 0.25 m with 2 grains per nest. The answer was in correspondence with what was stated by what was raised (18), when indicating as successful productions of young cobs, above 9 t ha-1; not being so for 0.90 x 0.25 m with 1 grain per nest.
The production of green beans without bracts (49 %) and corncob (34 %) corresponds to the expected results, since there is a coincidence with the production of cobs. Furthermore, it coincided with the range of production normally obtained in Cuba, for the green grain production indicator 19,20, which is considered good if grain production is above 3.5 t ha-1; the yield obtained was in correspondence with those achieved in other investigations, where a maize hybrid with different planting densities was used 15.
The grain yield ranged between 3, 112 and 4,971 t ha-1. The highest yield of grain and cobs was obtained with 0.90 x 0.25 m with 2 grains, when compared with the production control most used in productions; while the lowest yield was presented with the density 0.90 x 0.25 m with 1 grain per nest.
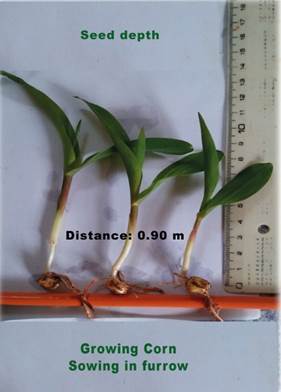
On the other hand, the height of the cob varied between 0.92 and 1.23 m, which could be in correspondence with the depth of sowing that was not uniform (Figure 2), which caused that all the seedlings did not emerge at the same time as shown in Figure 3.
The treatments with the highest population densities were those that showed the highest height of the upper cob (AMS), this indicator shows great importance, since the height of the cobs can make manual harvesting difficult if it is very high. In addition, it is more prone to lodging, due to the weight that the stem supports 21; therefore, in this case it is good to select the treatments that are lower in height of the upper cob or that have a good relationship with the height of the plant. By relating the height of the upper cob with the plant height, it can be argued that the height of the plant is a parameter that depends largely, on external factors of the environment. In this sense, treatments with the highest plant height have the shortest distances between them and the highest number of plants per nest, which increases density and causes greater growth 22.
It is worth noting that in the variable no significant differences were found between the treatments. The result shows that at low planting densities, the corn plants had less competition for water and nutrients and vice versa, thus they grow in search of sunlight, in this way equal in height to the plants that were planted at low densities.
With the density of 88 888 plants ha-1, the highest height was reached. Related to this, other authors mention that the plant height is a parameter that depends, largely, on external factors of the environment 22. In this sense, the treatments with the highest plant height have the shortest distances between plants and the highest number of plants per nest, which increases the density and this causes greater growth.
The amount of water that the crop received during its development was 550 mm, as a result of the rainfall recorded during the development of the crop (337 mm) and the irrigation applied (213 mm), which is within the appropriate interval (500 at 1 000 mm) for cultivation of maize in the humid tropics 23. Under conditions of the present study, the increase in density from 44,444 to 88,888 plants ha-1 increased grain yield by 50 %. This increase was similar to that found in other studies, in which increases in grain yield were observed at densities greater than 50,000 plants ha-1 (10,24.
Despite the fact that the height of the plant and the cob height were higher than those mentioned in other studies 25; the increase in population density was similar to that reported by other authors 26,27.
An increase in yield was obtained at a higher population density, so it is suggested to take into account, for other studies, the population density of 88 888 plants ha-1 for the hybrid HST-3235; from this it is inferred that it can support higher population densities.
BIBLIOGRAFÍA
1. Barroso F. Imágenes aéreas de muy alta resolución para la caracterización del maíz (Zea mays L.) de regadío en una zona semiárida [Doctorado]. Universidad de castilla-la mancha, Albacete; 2017. 178 p. [ Links ]
2. Ortiz-Aparicio S. Observación de la producción de maíz bajo el sistema de alta densidad y tradicional en San Juan Lagunas, Putla Villa de Guerrero, Oaxaca [Internet] [Diploma]. [Torreón, Coahuila]: Autónoma Agraria Antonio Narro; 2017 [cited 05/05/2021]. 72 p. Available from: http://repositorio.uaaan.mx:8080/xmlui/handle/123456789/422232. [ Links ]
3. Ávila AA. Maíz tardío, análisis de dos factores que afectan el rendimiento?: densidad y genotipo [Diploma]. [Argentina]: Nacional del Centro de la Provincia de Buenos Aires; 2018. 44 p. [ Links ]
4. León-Aguilar R, Torres-García A, Ardisana EH, Fosado-Téllez O, Véliz-Mantuano F, Pin-Quimis W. Comportamiento productivo del maíz híbrido Agri-104 en diferentes sistemas, densidades de siembra y riego localizado. Revista Espamciencia. 2018;9(2):124-30. [ Links ]
5. Sangoi L. Understanding plant density effects on maize growth and development: an important issue to maximize grain yield. Ciência rural. 2001;31(1):159-68. [ Links ]
6. Moya-Cisneros XD. Estudio agronómico de tres híbridos con tres distanciamientos de siembra en el cultivo de maíz Zea mays L. [Diploma]. [Guayaquil]: Facultad de Ciencias Agrarias Universidad de Guayaquil; 2016. 50 p. [ Links ]
7. Cañadas Á, Molina C, Rade D, Fernández F. Interacción época/densidad de siembra sobre la producción de ocho híbridos de maíz forrajeros, Ecuador. Revista MVZ Córdoba. 2016;21(1):5112-23. [ Links ]
8. Flores F, Balbi E, Pietrantonio J, Pagnan L, Alladio R, Errasquin L. MAIZ Actualización 2017. Informe de Actualización Técnica en Línea No8 INTA. 2017;60. [ Links ]
9. Saltos Bajaña EG. Manejo agronómico de tres híbridos y cuatro distancias de siembra en el cultivo de maíz Zea mays L. [Diploma]. [Guayaquil]: Facultad de Ciencias Agrarias Universidad de Guayaquil; 2018. 77 p. [ Links ]
10. Guevara-Escobar A, Barcenas-Huante G, Salazar-Martínez FR, González-Sosa E, Suzán-Azpiri H. Alta densidad de siembra en la producción de maíz con irrigación por goteo subsuperficial. Agrociencia. 2005;39(4):431-9. [ Links ]
11. Sener O, Gozubenli H, Konuskan O, Kilinc M. The effects of intra-row spacings on the grain yield and some agronomic characteristics of maize (Zea mays L.) hybrids. Asian Journal of Plant Sciences. 2004; [ Links ]
12. Google Earth. Programa Googlearth.exe [Internet]. 2015 [cited 06/05/2021]. Available from: http://earth.google.es/showcase/12. [ Links ]
13. Lecha L, Paz L, Lapinel B. El clima de Cuba. Academia; 1994. 186 p. [ Links ]
14. Hernández JA, Pérez JJM, Bosch ID, Castro SN. Clasificación de los suelos de Cuba. Mayabeque, Cuba: Ediciones INCA. 2015. 93 p. [ Links ]
15. Instituto de Investigaciones de Granos. Guía técnica para el cultivo del maíz. La Habana, Cuba: Agroecológica; 2013. 29 p. [ Links ]
16. León -Noguera P, Ravelo-Ortega R. Fitotecnia general [Internet]. Ciudad de la Habana, Cuba: Félix Varela; 2007 [cited 05/05/2021]. 434 p. Available from: https://isbn.cloud/9789590704178/fitotecnia-general/ [ Links ]
17. Leyva A. Metodología para el desarrollo de la biodiversidad vegetal (MEDEBIVE). Leyva A, Pohlan J. Agroecología en el trópico-Ejemplo de Cuba. La Biodiversidad Vegetal, cómo conservarla y multiplicarla. Aachen: Shaker Verlang. 2005;165-72. [ Links ]
18. de Cuba AE. Oficina Nacional de Estadística e Información. La Habana [Internet]. 2017; Available from: http://www.one.cu/aec2011/esp/09_Tabla_cuadro.htm18. [ Links ]
19. MINAG. Guía técnica para la producción del cultivo del maíz (Zea mays L) en Cuba. Quivicán, La Habana: Liliana Dimitrova (Instituto de Investigaciones Hortícolas); 2000. 20 p. [ Links ]
20. Medina-Méndez J, Santiago-Gelacio A, Soto-Rocha JM, Hernández-Pérez M. Rendimiento de maíz grano con y sin fertilización en el estado de Campeche. Revista mexicana de ciencias agrícolas. 2018;9(21):4306-16. [ Links ]
21. Vargas JV, Zepeda-Bautista R, Arellano-Vázquez JL, Avila-Perches MA, Rojas I. Producción de semilla de progenitores e híbridos de maíz de Valles Altos en dos fechas de siembra. 2013;1(1):26-32. [ Links ]
22. Blanco Y, Afifi M, Swanton CJ. Efecto de la calidad de la luz en el cultivo del maíz: una herramienta para el manejo de plantas arvenses. Cultivos Tropicales. 2015;36(2):62-71. [ Links ]
23. Loza-Espinosa AF. Evaluación de híbridos de maíz dulce (zea mays l.) var saccharata, bajo dos distancias de siembra para grano enlatado. [Diploma]. Central de Ecuador; 2017. 106 p. [ Links ]
24. Roca-Mendoza CO. Respuesta agronómica de tres híbridos de maíz sembrados a dos distancias en la parroquia La Esperanza del cantón Quevedo [Diploma]. Técnica Estatal de Quevedo; 2019. 88 p. [ Links ]
25. De la Cruz-Lázaro E, Córdova-Orellana H, Estrada-Botello MA, Mendoza-Palacios JD, Gómez-Vázquez A, Brito-Manzano NP. Rendimiento de grano de genotipos de maíz sembrados bajo tres densidades de población. Universidad y ciencia. 2009;25(1):93-8. [ Links ]
26. Khan K, Iqbal M, Shah Z, Ahmad B, Azim A, Sher H. Grain and stover yield of corn with varying times of plant density reduction. Pakistan Journal Biology Science. 2003;6(19):1641-3. [ Links ]
27. Sandoval Endara IL. Evaluación agronómica de dos híbridos de maíz Zea mays L. cultivados con tres distancias de siembra [Diploma]. Facultad de Ciencias Agrarias Universidad de Guayaquil; 2016. 74 p. [ Links ]
Received: June 02, 2020; Accepted: March 22, 2021

