


My SciELO
 Custom services
Services on Demand
Journal

Article
 text in
  English (pdf)
 Article in xml format
 Article references
 Send this article by e-mail
Indicators
-
 Cited by SciELO
Related links
-
 Similars in
SciELO
Similars in
SciELO
Share

 Permalink
Cultivos Tropicales
Print version ISSN 0258-5936On-line version ISSN 1819-4087
cultrop vol.42 no.3 La Habana July.-Sept. 2021 Epub Sep 30, 2021
Original article
Suitability for agricultural irrigation of Mampostón sub-basin surface water, Mayabeque, Cuba
1
*
 http://orcid.org/0000-0003-4620-6197
2
http://orcid.org/0000-0003-2598-8396
2
http://orcid.org/0000-0003-1366-0975
1Instituto Nacional de Ciencias Agrícolas (INCA), carretera San José-Tapaste, km 3½, Gaveta Postal 1, San José de las Lajas, Mayabeque, Cuba. CP 32 700
2Universidad Agraria de La Habana “Fructuoso Rodríguez Pérez”, carretera a Tapaste y Autopista Nacional, San José de las Lajas, Mayabeque, Cuba
3Instituto Superior de Tecnología y Ciencias Aplicadas (InSTEC), Universidad de La Habana, La Habana, Cuba
4Laboratorie de Écologie Fonctionnell et Environnement de Toulouse (EcoLab), France, CNRS
It is common to find effects on agricultural production derived from water quality, so the evaluation of its aptitude for irrigation is decisive to ensure food safety. The present work aimed to evaluate the chemical-physical and microbiological quality of the surface water of Mampostón sub-basin, for its use in agricultural irrigation. The parameters pH, electrical conductivity (EC), majority anions and cations, heavy metals (HM), dissolved organic carbon (DOC) and particular (POC), chemical (COD) and biological oxygen (BOD5) demand and content of total and fecal coliforms. The spatio-temporal variability of these parameters was determined by bifactorial ANOVA, establishing that the differences were in the main effects (monitoring stations and sampling time) and not in the interaction between them. The analysis of spatial variability indicated that stations G2, G3 (Ganuza river) and M5 (Mampostón river), presented organic and soluble salts contributions that establish limitations for their use. The average concentrations of dissolved Pb exceeded the permissible limits in stations G1, G2, G4 (Ganuza river), M2, M3 (Mampostón river) and P1 (Pedroso diverter dam), which disables their exploitation. The content of fecal coliforms compromises the quality of the water in station M5 (Mampostón river). The water from the rest of the sampling stations in the Pedroso diverter dam and the Mampostón dam are suitable for use in agricultural irrigation. A monitoring program and management strategy should be designed in the area.
Key words: irrigation; heavy metals
INTRODUCTION
Water quality for irrigation is determined by the quantity and type of salts that constitute it, being the main parameters established to measure the agricultural suitability of a water, the sodium adsorption ratio (SAR) and the electrical conductivity (EC). This is because the most important risk related to irrigation is creating saline soils 1.
However, irrigation water quality, if it comes from places close to polluting sources, should not be determined only taking into account the aforementioned parameters. Increasingly, chemical pollutants (either organic or inorganic) arrive in waters, both surface and underground, which are made available to plants and which can cause their accumulation in them, with the consequent magnification along trophic chains 2. Man, as the last link in most food chains, is involved in this cycle, observing immunological, embryological, neurological and systemic affectations 3. Biological pollutants that, like chemicals, can affect the food chain, causing serious diseases, can also affect these waters. These pollutants can be: helminths, protozoa, bacteria and viruses 4.
In Cuba, the monitoring of the quality of surface and groundwater is carried out from the water quality network (RedCal), belonging to the Institute of Hydraulic Resources, using as an instrument for the integration of analytical results the Quality Index of Surface Waters (ICAsup). Among the indicators that compose it are pH (acidity or basicity), electrical conductivity (EC: content of soluble salts), dissolved oxygen (ODSAT: state of the water body with respect to its dissolved oxygen content), chemical demand of oxygen by the dichromate method (COD: organic matter present) and fecal coliforms (density of fecal bacteria) (5). Other countries have their own index taking into account the content of N-NH4, N-NO3 and PO46,7.
From the regulatory point of view, Cuba has standards for determining drinking water quality 8 and regulates discharges to bodies of terrestrial water and sewerage 9. However, the evaluation of inorganic metallic pollutants is not carried out on a scheduled and widespread basis in the country, but rather at the level of research projects that finance studies in a specific area of interest.
The Mampostón sub-basin, object of this study, covers an area of 157.8 km2. It is strongly anthropized, as it receives direct dumping from seven industries, numerous agricultural farms, towns and highways. Surface water is used from the agricultural point of view for the irrigation of vegetables (1 026.63 ha) and in the cultivation of rice (Oryza sativa L.), with an area of 67.60 ha, according to data from the Ministry of Agriculture 10. There is also a large area cultivated with pastures and forest crops that do not receive direct irrigation 11. Therefore, the objective of this work was to evaluate the chemical-physical and microbiological quality of the surface water of the Mampostón sub-basin for its use in agricultural irrigation.
MATERIALS AND METHODS
Description of the study area
The Mampostón sub-basin is of karstic origin and its extension covers the territories included to the north by Mampostón dam, to the east by the Pedroso diverter dam, to the west by the Cueto-Ganuza hills and to the south by the Güines hills (Figure 1).

The samplings were carried out upstream and downstream of the seven direct pollutant sources reported by the National Institute of Hydraulic Resources (Table 1) 11. It has 100 m of separation between them for a total of 16 sampling stations: four on the Ganuza tributary (G1-G4), five in the Mampostón tributary (M1-M5), three in the Pedroso diverter dam (P1-P3), one in the water outlet towards Güines (P4) and three in Mampostón dam (PM1- PM3). The samplings were carried out at the end of two seasons of the year differentiated by the climate in Cuba (rainy season and little-rainy season).
Table 1 Companies related to the pollutant load of the site under study
| Polluting focus | Sampling stations | Coordinates | Residual | Category |
|---|---|---|---|---|
| Milk pasteurisation unit “Aljibe” | G1-G2 | N 22º 55´ 47.59” O 82º 7´ 4.02” | Organic: Dairy Waste | III |
| Rum Factory "San José" | G2-G3 | N 22º 55´ 48.8” O 82º 6´ 58.06” | Organic: stillage among others | V |
| Paint Factory "Raúl Cepero Bonilla" | G3-G4 | N 22º 55´ 40.77” O 82º 5´ 45.5” | Inorganic: complex chemicals | I |
| CEPAM | before M1 | N 22º 56´ 14.71” O 82º 5´ 26.77” | Organic: waste from the fry rearing process | III |
| Aluminum Factory | M1-M2 | N 22º 56´ 27.11” O 82º 4´ 39.45” | Inorganic: solid waste | V |
| Asphalt Plant | M2-M3 | N 22º 55´ 49.95” O 82º 5´ 0.20” | Inorganic and organic: solid and gaseous waste | V |
| Institute of Animal Science | M4-M5 | N 22º 54´ 8.44” O 82º 2´ 19.18” | Organic: Seedlings and animal husbandry waste | III |
Evaluation of chemical-physical parameters
In 16 sampling stations, water samples were collected in inert plastic containers with a capacity of five liters. The samples were taken manually one meter from the surface, always in the middle of the river. In the reservoirs, a rowing boat was used for the collection.
The preparation of the samples for the analysis was carried out in Cuba (chemistry laboratories of the Agrarian University of Havana) and in France (Ecolab laboratories, Toulouse). The filtration for the determinations of heavy metals (PM) was carried out according to the methodology of Casanueva et al. 12. The samples for organic determinations (DOC and multi-element analysis) were filtered with a 70-µm GMA glass fiber filter previously washed with 1N HCl.
pH and EC
Both indicators were measured in the chemistry laboratories of the UNAH, by the potentiometric method using a PHSJ-3F model pH meter with a sensitivity of 0.001.
Majority anions
The anions (Cl-, NO3 -, SO4 2-, HCO3 -) were determined, in the chemistry laboratories of the UNAH, using volumetric procedures established by RedCal in its monitoring of water quality 13.
Organic composition of the dissolved and particulate phases transported in suspension
Both parameters were determined in the EcoLab laboratories (Toulouse, France). The catalytic oxidation was carried out at 680 ºC in a TOC-5000 Shimadzu equipment. The resulting CO2 was quantified by infrared detection and comparison with a standard curve at 0, 2, 5 and 10 ppm of potassium dipthalate 14. The reading was carried out on a ThermoFisher NA 2100 Protein equipment by combustion at 1800 ºC and subsequent separation of the gas mixture by gas chromatography. For quantification, results were compared with a standard curve of aspartic acid with 36.09 % C, 5.30 % H, 12.52 % N and 0 % S.
From the results of the particular phase (POC and NOP) the C/N ratio was estimated in order to establish the origin of the organic matter.
BOD5 and COD
Both parameters were determined, using procedures established by RedCal in its monitoring of water quality 13. From their results, the BOD5/COD ratio was calculated in order to determine the degradability of the organic matter present 15.
Composition of majority cations and heavy metals in the dissolved phase
Both procedures were carried out in the EcoLab laboratories (Toulouse, France). No concentration treatment was performed, the measurement was performed directly using ICPMS equipment. For the validation of the results, the internationally certified reference material SLRS-5 16 was used, which is an external indicator of the quality of handling. In the ICPMS determinations, each sample was doped with a known concentration of 115In/187Re (2.032 µg L-1) as an internal standard, in order to correct any deviation in the analysis, following the formulas:
where:
δIn/Re: identifies the relationship between doped concentration and equipment reading
C(In): represents In concentration
C (Re): represents Re concentration
Cx: Rectified indicates the correction factor for evaluated metals
In addition, quality controls (HNO3 0.37N, STD-2B in dilutions 100, 50, 25 and 5 %, EPOND-1 and SLRS-5) were used every eight samples, to calculate the background noise of the equipment and determine the loss of sensitivity over time. In all cases, this was corrected based on the correction of the internal standard.
Determination of microbiological parameters
The determinations were made in the UNAH microbiology laboratories. The microorganism count was made from the water samples taken at the Aljibe (G2), ICA (M5) and Violento (M3) monitoring stations, the first two due to receiving a significant organic pollutant load (dairy derivatives and animal waste). ) and the last because it is located between them, as a way of controlling the purification process of the river itself.
For the isolation of total microorganisms, the technique of quantitative dilutions and sowing in a Petri dish 17 were used, with a dilution order of up to 109 for bacteria. The isolation was carried out in Nutrient Agar culture medium with incubation for 72 h. Morphophysiological identification was carried out according to the technique described by Bergey 18. For the counting of fecal coliform microorganisms, the method of the most probable number MPN 19 and the Cuban standard that determines the microbiological water quality was used 20.
Statistical analysis
The spatio-temporal differences in the composition of pH, EC, majority elements and organic composition were determined from a multivariate variance analysis of double classification (bifactorial ANOVA), with the objective of knowing if there was variability due to the interaction of both factors (Sampling stations and Sampling time) or only by their main effects (factors separately). The parameters with significant differences were subsequently performed Duncan's test (p <0.05).
The content of heavy metals and fecal coliforms was compared with the Cuban standard for drinking water 8 and with the WHO standard for irrigation water 4.
RESULTS AND DISCUSSION
The bifactorial analysis of variance to determine the spatio-temporal differences in the composition of t Mampostón sub-basin surface water showed that, in the case of the interaction between the proposed factors (sampling stations and sampling time), there are no differences statistically significant in none of the parameters analyzed (Table 2), so the main effects were assessed separately.
Table 2 Multivariate analysis of double classification for the case of the evaluated factor interaction
| Factors | Parameters | Sum of squares type II | Quadratic mean | F | p | |
|---|---|---|---|---|---|---|
| Interaction effects between sampling stations and sampling time | pH | 2.10 | 0.14 | 0.303 | 0.992 ns | |
| CE | 359871.93 | 23991.46 | 0.648 | 0.813 ns | ||
| Organic matter | COD | 232.29 | 15.48 | 0.847 | 0.623 ns | |
| COP | 25367.33 | 1691.15 | 0.662 | 0.800 ns | ||
| NOP | 465.79 | 31.05 | 1.069 | 0.420 ns | ||
| DQO | 116823.25 | 7788.21 | 0.586 | 0.864 ns | ||
| DBO5 | 142312.85 | 9487.52 | 1.845 | 0.072 ns | ||
| Majority aniosn | HCO3 - | 37123.23 | 2141.54 | 1.010 | 0.761 ns | |
| SO4 2- | 613.93 | 40.92 | 0.599 | 0.853 ns | ||
| Cl- | 3160.00 | 210.66 | 1.719 | 0.097 ns | ||
| NO3 - | 27.10 | 1.80 | 0.783 | 0.686 ns | ||
| Majority cations | Na+ | 277.37 | 18.49 | 0.538 | 0.898 ns | |
| K+ | 275.94 | 18.39 | 1.271 | 0.275 ns | ||
| Mg2+ | 66.61 | 4.44 | 0.652 | 0.809 ns | ||
| Ca2+ | 5190.22 | 346.01 | 0.916 | 0.556 ns | ||
| Heavy methals | Cr total | 1497.88 | 99.85 | 0.872 | 0.599 ns | |
| Cu2+ | 1191.08 | 79.40 | 0.897 | 0.574 ns | ||
| Zn2+ | 466301.98 | 31086.79 | 0.950 | 0.524 ns | ||
| As total | 0.96 | 0.06 | 0.702 | 0.763 ns | ||
| Pb2+ | 51003.2 | 3400.21 | 0.923 | 0.550 ns | ||
Fisher's F-F; p-probability; ns-there are no statistically significant differences
Spatial differences in the physical-chemical composition of Mampostón sub-basin surface waters
pH and EC
The pH of Mampostón sub-basin surface waters showed little spatial variability (Table 3), which is in line with the powerful buffering effect produced by the HCO3 - and Ca2+ ions when dissolved 21. The general mean was 7.26, but without significant differences between the monitoring stations for p> 0.05.
EC determinations were higher than 318 µS cm-3, which indicated that there are no water permeability problems in the soil according to what was previously indicated 22.
Table 3 Determination of spatial differences for pH and EC parameters
| Parameters | Hydrosystem | N | ẋ | SD (ẋ) | F | p |
|---|---|---|---|---|---|---|
| pH | Ganuza river | 16 | 6.79 | 0.53 | 1.15 | 0.33 ns |
| Mampostón river | 16 | 6.81 | 0.44 | |||
| Pedroso diverter dam | 16 | 7.29 | 0.82 | |||
| Mampostón Dam | 16 | 7.38 | 0.64 | |||
| EC | Ganuza river | 16 | 696.18 a | 272.9 | 9.60 | 0.000* |
| Mampostón river | 16 | 496.40 b | 89.68 | |||
| Pedroso diverter dam | 16 | 441.30 b | 60.02 | |||
| Mampostón Dam | 26 | 330.61 c | 20.04 |
N- number of samples; ẋ- arithmetic mean; SD (ẋ) - Standard deviation of the mean; Fisher's F-F; p- probability; ns- there are no statistically significant differences; different letters in the same column indicate significant differences according to Duncan for p <0.05
Spatially, there are statistically significant differences in the EC of the different hydrosystems evaluated (rivers and dams), the Ganuza river having a higher concentration of dissolved salts and Mampostón dam having a lower concentration. However, when breaking down the different sampling stations in the bar graph (Figure 2), it can be clearly observed how these differences are related to the anthropic contribution at stations G2 and G3 on Ganuza river and M5 on Mampostón river.
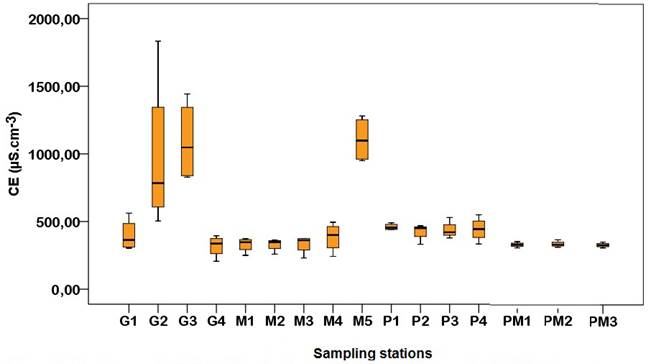
The boxes represent the values of 25-75 % of the sample
The mean is represented as a horizontal black line. The vertical bars represent the standard error of the mean (N = 64)
Figure 2 Electrical conductivity of the dissolved phase
The use of water from these three sampling stations for irrigation implies a risk of soil salinization, since the observed values are higher than the FAO standard 23. The EC is influenced, both by the specific electrical conductivity (ECi) of the ions dissolved in water, and by the contributions of organic matter (OM) from the medium that can dissociate (as weak acids), releasing hydronium ions with high ECi. In this regard, it was reported that, the greater amount of both exists, the higher the EC of a water in a given site 21,24.
Majority elements (anions and cations)
Ca2 + was the predominant cation (Table 4), which apparently its contribution is anthropic, in organic form (G2), from the soy yogurt production process, which can induce the precipitation of toxic metals 24. The rest of the spatial differences that were found are caused by different local geopedological processes 25 and coincide with reports made in this same area in the previous decade 26. The Na + and K + cations presented higher concentrations in stations G1, G2 and G3, indicating anthropic contributions as part of the dumping of waste from the dairy and rum factories. The production processes carried out in these companies introduce high concentrations of salts, mainly NaCl, NaHCO3, Mg (NO3)2 and KNO3.
The surface water that flows through the Ganuza and Mampostón rivers, as well as the one that is impounded in Pedroso diverter dam and the Mampostón dam presented high contents of dissolved HCO3 -, in a variable composition, spatially according to the geology of the area (Table 5), which coincides with the results obtained previously 26.
The spatial differences in the concentrations of Cl- and NO3 - are related to the aforementioned productive processes (companies whose discharge is carried out in the waters of the Ganuza tributary), including the discharge of waste from the Institute of Animal Science (M5) for the first anion.
The classification of the surface waters that circulate through the basin are considered as bicarbonate, sodium calcium sulfate (HCO3 -> Ca2 + = SO4 2-> Na +), corresponding to the lithological constitution of the area. In this regard, other authors point out that the dissolution of calcite produces waters with a Ca/Mg ratio between 4-50 mmol L-1 (26, being in the present study between 8.38-21.55 mmol L-1.
Organic composition of the dissolved and particulate phases transported in suspension
The evaluation of the dissolved organic carbon (DOC) content showed that there were statistically significant spatial differences between the G3 monitoring station and the rest. The stations with the highest concentration of particular organic carbon (POC) were G2 and G3, the rest have lower POC values. Therefore, it was considered that a wide variability was observed in the carbon determinations (Table 4).
The relationship between C and N that is transported in suspended matter was shown through the C/N relationship. C/N values between 2.6 and 8.0 indicated a predominance of autochthonous organic matter, either due to photosynthesis or bacterial chemosynthesis or due to the presence of fluvial phytoplankton 27,28. Following the aforementioned criteria, the monitoring stations where autochthonous organic matter predominates are G2 and G3. This could be because the residues from the yogurt and rum factory are easily degradable and cause intense microbial growth on the water surface, visible to the naked eye by flocculation film formation 29.
Table 4 Spatial variation of the majority cations and heavy metals in Mampostón sub-basin surface waters
| Cations (statistics) | Ganuza river | Mampostón river | Pedroso diverter dam | Mampostón dam | F | p | |||||||||||||||
|---|---|---|---|---|---|---|---|---|---|---|---|---|---|---|---|---|---|---|---|---|---|
| G1 | G2 | G3 | G4 | M1 | M2 | M3 | M4 | M5 | P1 | P2 | P3 | P4 | PM1 | PM2 | PM3 | ||||||
| Majority elements | (mg L-1) | ||||||||||||||||||||
| Ca2+ | ẋ | 60.9bc | 119.3a | 78.3b | 43.8cd | 47.7cd | 41.3cd | 39.0d | 71.9bc | 57.9bc | 73.2bc | 64.8bc | 57.9bc | 52.2bc | 38.8d | 38.0d | 38.8d | 4.5 | 0.000* | ||
| SD (ẋ) | 16.7 | 32.4 | 31.1 | 6.7 | 19.7 | 10.6 | 21.2 | 29.2 | 25.9 | 15.8 | 23.3 | 7.6 | 19.0 | 8.7 | 9.4 | 9.2 | |||||
| Mg2+ | ẋ | 4.2 | 5.6 | 7.2 | 4.2 | 4.2 | 4.4 | 4.1 | 5.4 | 3.9 | 5.9 | 5.8 | 5.8 | 6.2 | 4.6 | 4.6 | 4.7 | 0.6 | 0.8 ns | ||
| SD (ẋ) | 1.0 | 1.3 | 0.8 | 0.5 | 0.8 | 0.7 | 1.2 | 3.3 | 0.4 | 4.6 | 3.9 | 4.1 | 4.6 | 0.4 | 0.5 | 0.8 | |||||
| Na+ | ẋ | 10.7b | 63.3a | 59.7a | 11.4b | 13.1b | 13.6b | 12.9b | 15.7b | 10.8b | 13.0b | 12.9b | 12.3b | 11.7.b | 14.6b | 14.8b | 15.2b | 37.9 | 0.000* | ||
| SD (ẋ) | 5.6 | 10.7 | 4.8 | 7.0 | 2.3 | 2.8 | 4.2 | 10.4 | 2.6 | 4.4 | 3.3 | 2.3 | 3.6 | 2.9 | 3.8 | 4.5 | |||||
| K+ | ẋ | 5.8bc | 9.9b | 22.0a | 4.4bc | 4.1bc | 4.6bc | 4.5bc | 5.3bc | 4.9bc | 2.7c | 3.2bc | 2.3c | 2.3c | 4.6bc | 4.4bc | 4.4bc | 5.5 | 0.000* | ||
| SD (ẋ) | 3.6 | 3.8 | 14.3 | 1.0 | 1.5 | 0.9 | 0.5 | 3.3 | 1.9 | 0.9 | 0.8 | 0.5 | 0.6 | 0.6 | 0.4 | 0.5 | |||||
| Heavy metals | (µg L-1) | - | |||||||||||||||||||
| total Cr | ẋ | 7.4 | 23.6 | 19.3 | 8.4 | 9.3 | 6.3 | 8.0 | 13.4 | 8.0 | 7.1 | 10.0 | 8.0 | 7.0 | 16.2 | 8.9 | 4.9 | 0.4 | 0.9 ns | ||
| SD (ẋ) | 5.2 | 16.5 | 11.1 | 3.1 | 5.9 | 3.8 | 1.2 | 9.4 | 3.5 | 2.6 | 5.7 | 4.5 | 4.7 | 9.7 | 4.0 | 1.7 | |||||
| Cu2+ | ẋ | 3.4 | 4.8 | 9.1 | 5.0 | 10.3 | 4.6 | 4.8 | 24.3 | 2.6 | 4.0 | 2.8 | 3.2 | 2.4 | 4.1 | 3.7 | 2.6 | 0.9 | 0.5 ns | ||
| SD SD (ẋ) | 2.5 | 2.2 | 5.7 | 1.4 | 5.2 | 2.7 | 2.7 | 19.7 | 1.7 | 1.4 | 1.4 | 2.3 | 1.6 | 2.5 | 1.2 | 1.5 | |||||
| Zn2+ | ẋ | 25.8 b | 78.8 b | 277.4 a | 32.2 b | 329.7a | 30.3 b | 26.8 b | 33.7 b | 41.0 b | 53.4 b | 264.3 a | 36.0 b | 23.3 b | 40.4 b | 33.5 b | 36.1 b | 30.9 | 0.000* | ||
| SD (ẋ) | 13.9 | 36.1 | 143.4 | 12.7 | 173.7 | 18.5 | 16.1 | 17.3 | 22.7 | 22.4 | 138.2 | 22.0 | 11.7 | 12.2 | 7.1 | 15.4 | |||||
| total As | ẋ | 0.7 | 0.4 | 0.7 | 0.5 | 0.5 | 0.7 | 0.5 | 0.9 | 0.5 | 0.5 | 0.5 | 0.4 | 0.5 | 0.7 | 0.7 | 0.7 | 1.0 | 0.4 ns | ||
| SD (ẋ) | 0.2 | 0.2 | 0.1 | 0.3 | 0.2 | 0.1 | 0.1 | 0.4 | 0.1 | 0.2 | 0.1 | 0.1 | 0.2 | 0.2 | 0.1 | 0.1 | |||||
| Pb2+ | ẋ | 27.2 b | 97.2 a | 12.8 c | 38.6 b | 4.6 c | 20.5 b | 87.9 a | 5.4 c | 3.6 c | 85.5 a | 10.0 c | 6.8 c | 2.0 c | 2.8 c | 2.4 c | 2.4 c | 35.4 | 0.000* | ||
| SD (ẋ) | 15.3 | 64.4 | 8.4 | 20.1 | 3.8 | 10.9 | 32.9 | 2.5 | 1.9 | 33.2 | 1.1 | 4.0 | 0.6 | 1.1 | 0.9 | 0.5 | |||||
ẋ- arithmetic mean; SD (ẋ) - Standard deviation of the mean; Fisher's F-F; p- probability; ns- non-significant differences for the same row and different letters in the same row- statistically significant differences according to Duncan for p <0.05
Table 5 Spatial variation of the majority anions in Mampostón sub-basin surface waters
| Majority anions (statistics) | Ganuza river | Mampostón river | Pedroso diverter dam | Mampostón dam | F | p | |||||||||||||
|---|---|---|---|---|---|---|---|---|---|---|---|---|---|---|---|---|---|---|---|
| G1 | G2 | G3 | G4 | M1 | M2 | M3 | M4 | M5 | P1 | P2 | P3 | P4 | PM1 | PM2 | PM3 | ||||
| (mg L-1) | |||||||||||||||||||
| HCO3 - | ẋ | 343.5b | 364.0 b | 305.7 b | 280.7 bc | 199.7cd | 186.7 cd | 288.7 bc | 351.0b | 523.2 a | 262.0 bc | 275.2 bc | 232.5 bc | 289.7 bc | 135.0 d | 133.2 d | 140.0 d | 14.0 | 0.000* |
| SD (ẋ) | 67.3 | 140.1 | 9.9 | 23.7 | 25.2 | 61.7 | 65.1 | 16.4 | 42.3 | 43.1 | 61.9 | 51.0 | 49.2 | 12.9 | 14.1 | 12.1 | |||
| Cl- | ẋ | 25.7b | 54.7a | 21.5c | 23.7c | 22.2c | 17.7cd | 22.7c | 22.7c | 44.0a | 23.2c | 18.7cd | 20.0c | 26.0b | 14.2cd | 14.7cd | 15.2cd | 3.0 | 0.02 ns |
| SD (ẋ) | 2.7 | 14.5 | 2.3 | 3.8 | 3.1 | 4.1 | 3.28 | 2.6 | 14.1 | 3.7 | 2.5 | 4.0 | 2.9 | 0.9 | 0.5 | 0.9 | |||
| NO3 - | ẋ | 2.4b | 2.4b | 15.0a | 1.4b | 0.8b | 1.1b | 1.1b | 4.1b | 0.8b | 2.0b | 0.9b | 1.9b | 0.8b | 0.8b | 0.8b | 0.8b | 22.4 | 0.000* |
| SD (ẋ) | 2.0 | 2.1 | 2.4 | 0.6 | 0.1 | 0.5 | 0.5 | 2.8 | 0.1 | 0.1 | 0.1 | 1.5 | 0.1 | 0.1 | 0.2 | 0.1 | |||
| SO4 2- | ẋ | 20.5 | 20.7 | 16.7 | 20.7 | 20.7 | 13.5 | 22.2 | 16.2 | 41.0 | 16.2 | 16.5 | 19.2 | 20.0 | 20.2 | 20.0 | 20.2 | 2.1 | 0.2ns |
| SD (ẋ) | 1.7 | 7.4 | 2.8 | 9.5 | 7.1 | 2.3 | 6.2 | 3.2 | 22.4 | 4.6 | 5.9 | 13.3 | 6.8 | 0.9 | 0.8 | 1.2 | |||
ẋ- mean; SD (ẋ) - Standard deviation of the mean; Fisher's F-F; p- probability; ns- non-significant differences and different letters in the same row- statistically significant differences according to Duncan for p <0.05)
Table 6 Spatial variation of the organic composition of Mampostón sub-basin surface waters
| Parameters | Ganuza river | Mampostón river | Pedroso diverter dam | Mampostón dam | F | p | |||||||||||||
|---|---|---|---|---|---|---|---|---|---|---|---|---|---|---|---|---|---|---|---|
| G1 | G2 | G3 | G4 | M1 | M2 | M3 | M4 | M5 | P1 | P2 | P3 | P4 | PM1 | PM2 | PM3 | ||||
| (mg L-1) | |||||||||||||||||||
| DOC | ẋ | 8.3bc | 7.4bc | 17.1a | 6.7bc | 12.3b | 7.5c | 8.1bc | 5.5c | 5.2c | 5.0c | 4.6c | 6.7bc | 6.0bc | 8.7bc | 9.3bc | 6.7bc | 2.9 | 0.020 ns |
| SD (ẋ) | 3.8 | 4.4 | 2.9 | 2.3 | 3.3 | 3.6 | 3.3 | 1.8 | 1.3 | 1.9 | 1.9 | 4.4 | 2.6 | 2.8 | 3.4 | 2.5 | |||
| POC | ẋ | 24.2c | 172.1a | 107.4a | 8.1c | 13.7c | 9.8c | 10.1c | 22.0c | 67.7b | 76.1b | 30.0bc | 29.3bc | 28.5bc | 32.0bc | 52.5b | 43.7bc | 3.9 | 0.001* |
| SD (ẋ) | 20.4 | 74.5 | 69.6 | 5.8 | 14.2 | 8.6 | 8.2 | 17.8 | 63.7 | 67.7 | 25.0 | 25.3 | 18.0 | 24.1 | 43.0 | 37.7 | |||
| NOP | ẋ | 2.7c | 21.5a | 13.7b | 0.8c | 1.0c | 0.7c | 0.9c | 1.9c | 7.0c | 7.8c | 2.2c | 2.6c | 2.5c | 2.9c | 3.9c | 2.7c | 4.2 | 0.000* |
| SD (ẋ) | 2.3 | 11.5 | 13.2 | 0.2 | 0.9 | 0.5 | 0.6 | 1.3 | 6.7 | 5.7 | 1.4 | 2.3 | 1.7 | 2.1 | 3.6 | 2.3 | |||
| Ration C/N | 8.9 | 8.0 | 7.2 | 10.1 | 13.7 | 14 | 11.2 | 11.5 | 9.6 | 9.7 | 13.6 | 11.2 | 11.4 | 12.0 | 13.4 | 16.1 | - | - | |
| BOD5 | ẋ | 17.0c | 27.2c | 178.5b | 4.7c | 3.9c | 1.8c | 7.4c | 7.3c | 482.2a | 1.8c | 8.7c | 8.5c | 2.6c | 1.8c | 1.7c | 1.9c | 8.7 | 0.000* |
| SD (ẋ) | 11.8 | 25.1 | 92.1 | 2.0 | 2.2 | 0.9 | 7.1 | 6.4 | 298.1 | 0.4 | 6.3 | 6.5 | 1.0 | 0.6 | 0.8 | 0.4 | |||
| COD | ẋ | 39.2c | 55.5c | 355.7b | 15.2c | 14.5c | 8.0c | 17.2c | 11.2c | 664.5a | 8.0c | 19.5c | 30.0c | 11.7c | 8.4c | 8.7c | 8.5c | 11.1 | 0.000* |
| SD (ẋ) | 11.0 | 17.1 | 281.7 | 9.3 | 10.4 | 1.2 | 11.6 | 9.3 | 317.8 | 1.8 | 10.3 | 26.4 | 4.7 | 2.4 | 1.9 | 2.0 | |||
| Ratio BOD 5/COD | 0.4 | 0.5 | 0.5 | 0.3 | 0.2 | 0.2 | 0.4 | 0.6 | 0.7 | 0.2 | 0.4 | 0.3 | 0.2 | 0.2 | 0.2 | 0.2 | - | - | |
ẋ- mean; SD (ẋ) - Standard deviation of the mean; Fisher's F-F; p- probability; ns- non-significant differences for the same row and different letters in the same row- statistically significant differences according to Duncan ra p <0.05
On the other hand, C/N values between 8.1 and 12.0 indicated an allochthonous character, originating from contamination by waste from livestock companies that dump directly into the Mampostón sub-basin, for which values higher than 12.1 are considered to be comes from fertilized soils 25. The sampling stations with organic matter of animal origin are G1, G4, M1, M3, M4, M5, P1, P3 and P4. The sampling stations presented an edaphic origin of organic matter: M2, P2, PM1, PM2 and PM3 (Table 6).
BOD5 and COD
From the spatial point of view, the station with the highest BOD5 and COD was M5, followed by G3 (Table 6). The rest of the stations do not present significant differences for both parameters. According to the American Public Health Society 30, drinking water has a BOD5 of 0.75-1.5 mg L-1 of oxygen and the water is considered contaminated if the BOD5 is greater than 5.0 mg L-1, industrial and agricultural wastes contain levels of BOD5 and COD above one hundred.
On the other hand, the BOD5/COD ratio indicated that organic matter is easily biodegradable in stations G2, G3, M4 and M5 with values equal to or greater than 0.5 15. Aspect that is closely related to the type of waste dumped at these points.
Heavy metals
The reported values of heavy metals for the international standard SLRS-5 satisfied the specifications of the specialized literature 20. All this for the satisfactory work, certification of processing the samples and the equipment operation, since all the values measured in the reference material ranged between 8 and 120 % of the coating factor, with respect to the certified values (Table 7). This indicated that the values reported for the sub-basin samples are reliable.
Table 7 Validation of analytical work in the processing of samples for the determination of heavy metals
| Metal | International Standard SLRS-5 | ||
|---|---|---|---|
| Measured concentration | Certified concentration | Coating Factor (%) | |
| (µg L-1) | |||
| Cr | 0.36±0.1 | 0.31±0.003 | 115 |
| Cu | 13.8±0.1 | 17.4±1.3 | 80 |
| Zn | 0.8 | 0.8±0.1 | 99 |
| As | 0.46 | 0.41±0.003 | 114 |
| Pb | 0.078 | 0.081±0.006 | 97 |
Among the heavy metals evaluated, only Zn2 + and Pb2 + showed statistical differences in their spatial distribution.
Zn2 + presented its highest concentration in stations G3, M1 and P2 (Table 5). However, in none of the cases does it exceed the Cuban Standard for drinking water 8) and the WHO Standard for irrigation water 4, which set the maximum value of this element at 5,000 µg L-1 for safe exploitation. The concentrations reported do not constitute a limitation for its use.
Regarding the average content of Pb, there is widespread contamination by this element in the surface waters of the Ganuza and Mampostón tributaries and Pedroso diverter dam. The sampling stations with the highest concentrations are G2, M3 and P1, with statistical differences compared to the rest of stations. A second group with average content of Pb in solution is constituted by stations G1, G4 and M2. In all cases, presumably, because the low flow of both tributaries produces a retreat of the water in some points and, therefore, the organic matter and cations contributed by the discharges of the industries remain stagnant, accumulating in the sediments until the beginning of the rainy season 31. These six sampling stations exceed the permissible levels established for drinking water by Cuban regulations 8) and the WHO regulations for irrigation water 4) set at 10 µg L-1.
Despite the use of unleaded fuels, since 2000 in Cuba, Pb is a metal with low mobility, which results in its accumulation in soils in high-traffic areas, due to contamination from previous decades 32. Therefore, the Pb content accumulated in the soils around the asphalt factory (station M2) and the national highway (station M3) may have been washed away by rain, wind or human activities, and deposited in these areas from the river. Another source of this element may be related to waste from the paint factory (G4), a point before station M2, and leaks of used oil from the boilers of the pasteurizer “El Aljibe”, which contaminates stations G1 and G2.
The contamination of the water at station P1 (Pedroso diverter dam) could be due to the negligent dumping of urban solid waste and sewage water on its margins, an aspect notified to the pertinent authorities and subsequently corrected.
Temporal differences in the physical-chemical composition of the Mampostón sub-basin surface waters
There is little seasonal variability in the physical-chemical parameters evaluated (Table 8). These results indicated the anthropic influence on the composition of surface waters in the territory, since the seasonal differences inherent to the concentration of elements in dry season are eliminated by the constant contributions received, from the waste from the companies. In addition, it was reported that this phenomenon might also be due to the bidirectional water exchange system between the Pedroso diverter dam and the Mampostón dam, which can occur both through the artificial channel and through the river 31. There are significant differences in pH, which increases 0.6 units in dry season, although its character continues to oscillate around neutrality.
The content of SO4 2- dissolved in the water is higher in dry season (Table 8). The SO4 2- concentrations found are not lithologically justified and it constitutes an anthropic contribution, in accordance with the information reported by other authors 21. The content of SO4 2- and Cl- in karst basins depends on the presence of gypsum (nonexistent in this sub-basin) or saline rocks, respectively, or on processes produced by human activity and that are related to agricultural fertilization, which are it increases in the months of October-February, according to reports from the Mayabeque Agriculture Delegation 33.
These results indicated the anthropic influence on the composition of surface waters in the territory, since the seasonal differences inherent to the concentration of elements in dry season are eliminated by the constant contributions received from the waste from the companies. In addition, it was reported that this phenomenon might also be due to the bidirectional water exchange system between Pedroso diverter dam and the Mampostón dam, which can occur both through the artificial channel and through the river 31.
Table 8 Determination of the temporal differences of the evaluated parameters
| Parameter | Season | ẋ | SD (ẋ) | F | p | |
|---|---|---|---|---|---|---|
| pH | Little Rainy | 7.4 a | 0.5 | 8.20 | 0.006* | |
| Rainy | 6.8 b | 0.5 | ||||
| EC (µS cm-3) | Little Rainy | 477.2 | 289.8 | 0.37 | 0.542 ns | |
| Rainy | 526.0 | 345.0 | ||||
| Majority Anions | HCO3 - (mg L-1) | Little Rainy | 279.9 | 122.2 | 0.581 | 0.449 ns |
| Rainy | 258.9 | 96.3 | ||||
| SO4 2- (mg L-1) | Little Rainy | 22.6 a | 11.0 | 4.394 | 0.04* | |
| Rainy | 17.9 b | 6.1 | ||||
| Cl- (mg L-1) | Little Rainy | 25.7 | 18.4 | 0.642 | 0.426 ns | |
| Rainy | 22.7 | 10.3 | ||||
| NO3 - (mg L-1) | Little Rainy | 4.0 | 2.4 | 0.172 | 0.68 ns | |
| Rainy | 3.2 | 2.0 | ||||
| Majority cations | Na+ (mg L-1) | Little Rainy | 18.6 | 16.9 | 0.066 | 0.798 ns |
| Rainy | 19.6 | 17.0 | ||||
| K+ (mg L-1) | Little Rainy | 7.3 | 6.3 | 0.906 | 0.345 ns | |
| Rainy | 4.9 | 3.6 | ||||
| Mg2+ (mg L-1) | Little Rain | 5.3 | 3.0 | 0.706 | 0.404 ns | |
| Rainy | 4.8 | 1.3 | ||||
| Ca2+ (mg L-1) | Little Rain | 52.7 | 23.2 | 2.295 | 0.135 ns | |
| Rainy | 62.8 | 29.8 | ||||
| Organic matter | COD (mg L-1) | Little Rainy | 9.0 | 5.1 | 3.77 | 0.05 ns |
| Rainy | 6.7 | 4.0 | ||||
| COP (mg L-1) | Little Rainy | 53.4 | 35.6 | 1.10 | 0.29 ns | |
| Rainy | 64.4 | 51.2 | ||||
| NOP (mg L-1) | Little Rainy | 6.5 | 3.8 | 0.99 | 0.32 ns | |
| Rainy | 7.8 | 5.3 | ||||
| DBO5 (mg L-1) | Little Rainy | 179.0 | 60.0 | 0.10 | 0.74 ns | |
| Rainy | 79.0 | 29.0 | ||||
| DQO (mg L-1) | Little Rainy | 223.7 | 39.5 | 0.79 | 0.37 ns | |
| Rainy | 169.0 | 79.6 | ||||
| Heavy metals | total Cr (mg L-1) | Little Rainy | 9.5 | 4.1 | 0.70 | 0.40 ns |
| Rainy | 9.9 | 2.1 | ||||
| Cu2+ (mg L-1) | Little Rainy | 4.3 | 2.4 | 0.98 | 0.32 ns | |
| Rainy | 6.6 | 3.1 | ||||
| Zn2+ (mg L-1) | Little Rainy | 97.0 | 54.3 | 0.71 | 0.40 ns | |
| Rainy | 91.9 | 35.1 | ||||
| total As (mg L-1) | Little Rainy | 0.6 | 0.2 | 0.31 | 0.57 ns | |
| Rainy | 0.6 | 0.3 | ||||
| Pb2+ (mg L-1) | Little Rainy | 28.1 | 9.2 | 0.06 | 0.79 ns | |
| Rainy | 31.9 | 7.5 | ||||
ẋ- mean; SD (ẋ) - Standard deviation of the mean; Fisher's F-F; p- probability; ns- non-significant differences; Different letters in the same column for each parameter indicate statistically significant differences according to Duncan for p <0.05
Content of total microorganisms and fecal coliforms
Regarding the total microbial count in water (Table 9), as well as the concentrations of fecal coliforms, they showed that the presence of fecal coliforms in the water of the Aljibe station (G2) does not exceed the permissible limits for water for agricultural use. The restriction of the water use of f this station for the irrigation is due to its content of Na + and Pb2 + and not to the presence of fecal pathogens.
According to this indicator, the water in the section of Mampostón River, included in the sampling station M5, should not be used in the irrigation of root and leaf crops, as well as for long-stemmed crops, if the applied irrigation is drip nor in labor-intensive or highly mechanized agriculture 34. In the case of the Violento station (M3), results show that the water should not be used for irrigation, regardless of crop type.
Table 9 Count of total microorganisms and fecal coliforms in three sampling stations of the Mampostón sub-basin
| Monitoring station | Total microorganism (CFU mL-1) | Morphotypes | Fecal coliforms (UFC mL-1) |
|---|---|---|---|
| G2 | 13x103 | 6 | 11x103 |
| M3 | 2x10⁵ | 8 | 2x10⁵ |
| M5 | 2.8x10⁵ | 7 | 2x10⁶ |
CFU-Colony Forming Units
The evaluation of the spatio-temporal differences of the chemical-physical parameters allowed to establish the influence of the various polluting sources of the territory, on the average composition of the surface waters with respect to a great diversity of parameters and also to verify the aptitude for irrigation in the sampling stations evaluated. This approach has been widely used in the evaluation of the anthropic contribution to soils and waters, both surface and underground 35-38.
This work has made it possible to establish a work tool for the design of an adequate management plan, with a view to reversing the impacts of organic and inorganic pollution by the Territorial Council of Hydrographic Basins. It is important taking into account that the implementation of a coordinated work between decision-makers and environmental managers, it guarantees to put into practice ecological compensation strategies and the optimization of the industrial structure, as bases for obtaining a sustainable ecosystem 39.
CONCLUSIONS
The spatial variability is the determining factor to explain the variance of the different parameters evaluated relative to the quality of the waters in the Mampostón sub-basin. Its analysis allows determining the aptitude for irrigation of 16 sampling stations, based on the knowledge of the main pollutants and their sources of discharge.
The sampling stations G2, G3 (Ganuza river) and M5 (Mampostón river), present organic and soluble salts contributions that establish limitations for their use in agricultural irrigation. While the average concentrations of dissolved Pb, disable the operation of stations G1, G2, G4 (Ganuza river), M2 and M3 (Mampostón river) and P1 (Pedroso diverter dam). The M5 station also has concentrations dangerous to human health of fecal coliforms.
The rest of the stations located in the Pedroso diverter dam and the Mampostón dam, comply with all the quality standards for agricultural irrigation.
A monitoring and management program for the area must be designed, which makes it possible to assess the risk of exposure to pollutants and the implementation of an action plan that allows its mitigation.
BIBLIOGRAFÍA
1. Wilcox Lv. Classification and use of irrigation waters. Circular No.969, Washington, D.C: US Department of Agriculture; 1955. 19 p. [ Links ]
2. Chang F-J, Tsai Y-H, Chen P-A, Coynel A, Vachaud G. Modeling water quality in an urban river using hydrological factors-Data driven approaches. 2015;151. [ Links ]
3. Wu X, Cobbina SJ, Mao G, Xu H, Zhang Z, Yang L. A review of toxicity and mechanisms of individual and mixtures of heavy metals in the environment. Environmental Science and Pollution Research. 2016;23(9):8244-59. [ Links ]
4. Chang A, Pan G, Asano T, Schonning T. WHO guidelines for the safe use of wasterwater excreta and greywater. Wastewater Use in Agriculture. Vol. 2. World Health Organization; 2006. 397 p. [ Links ]
5. García-Fernández JM, Gutiérrez-Díaz JB. Un índice para evaluar la calidad de los recursos hídricos superficiales en cuencas hidrográficas (ICAsp 2014). Voluntad Hidráulica. 2015;113. [ Links ]
6. Quiroz Fernández LS, Izquierdo Kulich E, Menéndez Gutiérrez C. Aplicación del índice de calidad de agua en el río Portoviejo, Ecuador. Ingeniería Hidráulica y Ambiental. 2017;38(3):41-51. [ Links ]
7. Rodríguez-Miranda JP, Serna-Mosquera JA, Sánchez-Céspedes JM. Índices de calidad en cuerpos de agua superficiales en la planificación de los recursos hídricos. Revista Logos, Ciencia & Tecnología. 2016;8(1):159-67. [ Links ]
8. Oficina Nacional de Normalización. Norma Cubana Obligatoria NC 827. Agua potable. Requisitos sanitarios. La Habana: ONN; 827, 2017. p. 1-13. [ Links ]
9. Oficina Nacional de Normalización. Norma Cubana Obligatoria NC 27. Vertimiento de Aguas Residuales a las aguas terrestres y al Alcantarillado. Especificaciones. La Habana: ONN; 27, 2012. p. 1-14. [ Links ]
10. Oficina Nacional de Estadística e Información. Anuario Estadístico de Cuba. La Habana: ONEI. 2020;447. [ Links ]
11. Barranco-Rodríguez G. La problemática ambiental y la ordenación de la cuenca hidrográfica Mayabeque, Cuba. Mapping. 2005;(101):44-51. [ Links ]
12. Casanueva-Marenco MJ, Díaz-de Alba MI, Granado- Castro MD, Galindo-Riaño MD. Metales en ecosistemas acuáticos. Métodos de análisis y especiación química analítica de metales en aguas [Internet]. Editorial Académica Española; 2018 [cited 31/05/2021]. 292 p. Available from: https://www.morebooks.de/store/es/book/metales-en-ecosistemas-acu%C3%A1ticos-m%C3%A9todos-de-an%C3%A1lisis-y-especiaci%C3%B3n/isbn/978-620-2-13914-4 [ Links ]
13. Aguinaga S. Manual de procedimientos analiticos para aguas y efluentes [Internet]. Dirección Nacional de Medio Ambiente; 1996 [cited 31/05/2021]. 174 p. Available from: https://www.yumpu.com/es/document/read/14893851/manual-de-procedimientos-analiticos-para-aguas-y-efluentes [ Links ]
14. N'guessan YM, Probst J-L, Bur T, Probst A. Trace elements in stream bed sediments from agricultural catchments (Gascogne region, SW France): where do they come from? Science of the total environment. 2009;407(8):2939-52. [ Links ]
15. Aznar-Jimenez A. Determinación de los parámetros físico-químicos de calidad de las aguas. Revista Manuel de gestión ambiental. 2000;2(23):12-9. [ Links ]
16. NRC-CNRC (National Research Council of Canada. Ottawa. Canada). River water reference material for trace metals [Internet]. 2009 [cited 31/05/2021]. Available from: http://www.speciation.net/Database/Materials/National-Research-Council-of-Canada-NRC--CNRC/SLRS5-River-water-reference-material-for-trace-metals-;i1230 [ Links ]
17. Oblitas Terrones YG. Identificación de coliformes totales, coliformes fecales y Escherichia coli aisladas del agua potable del distrito de Cajamarca. [Internet] [Tesis de Diploma]. [Cajamarca]: Universidad Privada Antonio Guillermo Urrelo; 2016 [cited 01/06/2021]. 124 p. Available from: http://repositorio.upagu.edu.pe/handle/UPAGU/454 [ Links ]
18. Bergey DH. Bergey`s Manual of determinative bacteriology. Board and trustees. 7th Ed. Baltimore; 2010. 1268 p. Available from: https://www.biodiversitylibrary.org/item/41848 [ Links ]
19. Quevauviller P, Maier EA. Quality assurance and quality control for environmental monitoring. In: Quality assurance in environmental monitoring-sampling and sample pretreatment. VCH Weinheim New York; 1995. p. 1-25. [ Links ]
20. Oficina Nacional de Normalización. Microbiología del agua. Detección y enumeración de coliformes. Técnica del número más probable (NMP) [Internet]. La Habana; 1095, 2015 [cited 01/06/2021]. Available from: https://especialidades.sld.cu/higienepidemiologia/?s=NC+1095 [ Links ]
21. Álvarez A, Gutiérrez JE, Facundo JR, González R. Análisis hidrogeoquímico de las aguas de la subcuenca Mampostón. Ciencias de la Tierra y el Espacio. 2010;1729-3790. [ Links ]
22. Hernández-Baranda Y, Rodríguez-Hernández P, Peña-Icart M, González-Hernández P, Nicolás-López S, Tomás F. Caracterización química y agronómica de las aguas residuales del yacimiento Castellano, Pinar del Río. Cultivos Tropicales. 2018;39(3):11-7. [ Links ]
23. Ayers RS, Westcot DW. Water quality for agriculture. Food and Agriculture Organization of the United Nations Rome; 1985. 97 p. [ Links ]
24. Cartone A, Casolani N, Liberatore L, Postiglione P. Spatial analysis of grey water in Italian cereal crops production. Land Use Policy. 2017;68:97-106. [ Links ]
25. Paneque J, Fuentes E, Mesa A, Echemendía A. El mapa nacional de suelos escala 1: 25 000. In: Memorias del XI Congreso Latinoamericano y II Congreso Cubano de la Ciencia del Suelo, La Habana, Memorias,(DR Villegas y D. Ponce de León, eds.). 1991. p. 1345-7. [ Links ]
26. Fagundo-Castillo JR, González P. Hidrogeoquímica [Internet]. España: Academia Española; 2012 [citado 10 de junio de 2021]. 364 p. Available from: https://www.libreriauniversitaria.it/hidrogeoquimica-fagundo-castillo-juan-reynerio/book/9783847356127 [ Links ]
27. Bardhan P, Karapurkar SG, Shenoy DM, Kurian S, Sarkar A, Maya MV, et al. Carbon and nitrogen isotopic composition of suspended particulate organic matter in Zuari Estuary, west coast of India. Journal of Marine Systems. 2015;141:90-7. [ Links ]
28. Kendall C, Silva SR, Kelly VJ. Carbon and nitrogen isotopic compositions of particulate organic matter in four large river systems across the United States. Hydrological Processes. 2001;15(7):1301-46. doi:https://doi.org/10.1002/hyp.216 [ Links ]
29. Mayea S, Carone M, Novo R, Boado I, Silveira E. Microbiología Agropecuaria. Tomo II. Félix Varela; 2009. 281 p. [ Links ]
30. APHA-AWWA-WPCF. Métodos normalizados para el análisis de aguas potables y residuales [Internet]. 17.a ed. American Public Health Association Enc. New York.: Editorial Díaz de Santos, S.A.; 1992 [cited 10/06/2021]. Available from: https://dialnet.unirioja.es/servlet/libro?codigo=307542 [ Links ]
31. Mesa-Pérez MA, Díaz-Rizo O, García-Acosta H, Alarcón-Santos OA, Sánchez-Pérez JM. Relationship between micro-granulometric profile and chemical sediment composition in Mampostón sub-watershed, Mayabeque, Cuba. Journal of South American Earth Sciences. 2020;101:102538. [ Links ]
32. Guo G, Wu F, Xie F, Zhang R. Spatial distribution and pollution assessment of heavy metals in urban soils from southwest China. Journal of Environmental Sciences. 2012;24(3):410-8. [ Links ]
33. Ministerio de la Agricultura de Cuba. Informe anual sobre los resultados agrícolas de la provincia Mayabeque. Mayabeque: Ministerio de la Agricultura. 2014; p. 34. [ Links ]
34. Ríos-Tobón S, Agudelo-Cadavid RM, Gutiérrez-Builes LA. Patógenos e indicadores microbiológicos de calidad del agua para consumo humano. Revista Facultad Nacional de Salud Pública. 2017;35(2):236-47. [ Links ]
35. Scheili A, Rodriguez MJ, Sadiq R. Seasonal and spatial variations of source and drinking water quality in small municipal systems of two Canadian regions. Science of the Total Environment. 2015;508:514-24. [ Links ]
36. Cabrera Alfonso JR, Ponce de León Lima D, Cervantes Beyra R, Vargas Rodríguez H, Domínguez Palacio D. Distribución espacial de la calidad de las aguas subterráneas utilizadas para el riego. Revista Ciencias Técnicas Agropecuarias. 2015;24(3):13-21. [ Links ]
37. Zhou X, Lei K, Khu S-T, Meng W. Spatial flow analysis of water pollution in eco-natural systems. Ecological Indicators. 2016;69:310-7. [ Links ]
38. Zhao J, Lin L, Yang K, Liu Q, Qian G. Influences of land use on water quality in a reticular river network area: A case study in Shanghai, China. Landscape and Urban Planning. 2015;137:20-9. [ Links ]
39. Liu Y, Bralts VF, Engel BA. Evaluating the effectiveness of management practices on hydrology and water quality at watershed scale with a rainfall-runoff model. Science of the Total Environment. 2015;511:298-308. [ Links ]
Received: June 13, 2019; Accepted: March 17, 2021
 Este es un artículo publicado en acceso abierto bajo una licencia Creative Commons
