My SciELO
Services on Demand
Article
Indicators
-
 Cited by SciELO
Related links
-
 Similars in
SciELO
Share
Biotecnología Aplicada
On-line version ISSN 1027-2852
Biotecnol Apl vol.26 no.3 La Habana July-Sept. 2009
RESEARCH
Modelation of growth kinetics of mammalian cells in perfusion culture
Modelación de la cinética de crecimiento del cultivo en perfusión de células de mamíferos
Luis Y Hernández1, Diaselys Castro1, Pablo de la A Vitón1, Oscar Pérez2, Mercedes Rodríguez2
1Centro de Inmunología Molecular, CIM Ave. 15 esquina 216, Atabey, Playa, CP 11 600, Ciudad de La Habana, Cuba
2Instituto Superior Politécnico José Antonio Echeverría Calle 114 No. 11 901 e/ 119 y 129, Marianao, Ciudad de La Habana, Cuba
ABSTRACT
Specific equations describing the behavior of cell growth, substrate use and product formation in stirred tank fermentors and cell bank-scale perfusion cultures (30 L working volume) were developed from basic mass balance equations. A third-order polynomial equation was statistically fitted to the restricted cell passage through the screen (0) obtained from experimentally run data to model the behavior of the culture with time, since a clear description of the hydrodynamics of the system has not yet been developed. The results of the simulation of the operation process with the VisSim software application using these equations agreed with the experimental data available. The model was used to analyze the influence of cell concentration, specific growth rate and specific product formation rate on the process during years 2000 and 2001, comparing the results obtained for both periods.
Keywords: Perfusion culture, spinfilter, mammalian cells, growth kinetics.
RESUMEN
Partiendo de las ecuaciones básicas del balance de masa, se llegó a las ecuaciones particulares que describen el comportamiento del crecimiento celular, del consumo de sustrato y de la formación de producto en los fermentadores de tanque agitado y cultivo en perfusión a escala de banco (30 L de volumen de trabajo). En función de los datos reales de las corridas, se desarrolló el ajuste estadístico de un polinomio de tercer orden, al factor de paso de las células a través de la membrana del filtro rotatorio (spinfilter (0)), para describir su comportamiento en función del tiempo, ya que no se tiene una idea clara del comportamiento hidrodinámico del sistema, el cual será desarrollado en trabajos futuros. Con las ecuaciones desarrolladas y utilizando el programa VisSim, se simuló el proceso de operación, y se obtuvo una semejanza con los datos reales. En dicho modelo se analizaron la influencia de la concentración celular, la velocidad de crecimiento específica y la velocidad de formación específica de producto, durante el proceso, en los años 2000 y 2001; y se compararon ambos años.
Palabras clave: Cultivo en perfusión, filtro rotatorio, células de mamíferos, cinética de crecimiento.
INTRODUCTION
Although a variety of culture formats can be applied for the growth and propagation of mammalian cells in vitro, the main alternatives in use are batch, fedbatch, continuous, biomass-recycle continuous (1, 2) and perfusion (3) cultures. Perfusion cultures, equipped with a device for cell retention such as a spinfilter, can potentially reach very high cell densities (4, 5). However, no growth models have been derived for perfusion cultures and no clear definitions of the stages of their growth kinetics are available. It is therefore essential to develop equations describing the growth kinetics of perfusion cultures, and to validate them through computer-aided simulation (6).
MATERIALS AND METHODS
Materials
Bioreactor
A 41 L (30 L working volume) fermentor was used, with a diameter of 0.27 m, a height of 0.7164 m, an effective height of 0.52 m and a propeller-type impellent with a diameter of 0.088 m, manufactured by CHEMAP AG (CMF 400) (6).
Spin filters
The 41 L bioreactors use cylindrical stainless steel spin filters (CHEMAP AG) with a diameter of 0.088 m and a height of 0.152 m, fitted with a stainless steel 20 μm pore diameter mesh (6).
Cell line
The work was done with the NSO/H7 host cell line (6).
Culture medium
A protein-free culture medium was employed throughout the study (6).
Methods
Perfusion culture
The medium was injected into the fermentor using a peristaltic pump (Watson Marlow 504 U), a constant level was later maintained with a controller having a Watson Marlow 504 U peristaltic pump that suctions the product through the top of the spinfilter (6).
VisSim simulation software
VisSim is a software application that simulates equations, developed by Visual Solutions. It is available for the MS/Windows and UNIX/X platforms (6).
Statistical software
The modelation of factor θ was performed with Statistica for Windows version 4.3 (Stat Soft) (6).
RESULTS AND DISCUSSION
Derivation of material balance equations
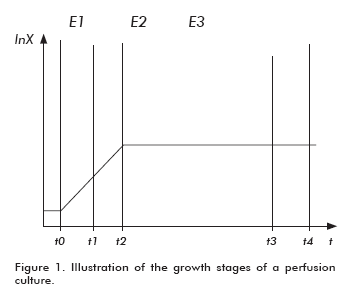
In order to develop a mathematical model for the behavior of a fermentor operated by perfusion, the existence of three growth stages must be considered for this setting (6, 7): 1) exponential growth at the non-stationary state (E1); 2) exponential growth at a continuous flow in a non-stationary state (E2); and limited growth at a continuous flow in a stationary state (E3) (Figure 1).
The first stage comprises the growth period before feeding the perfusion flow into the fermentor. The time required for this adaptive phase is very short, since the cells are under optimal conditions for their exponential propagation after inoculation. The second stage encompasses the period under perfusion flow, when the growth shows exponential kinetics before reaching the stationary phase. The third stage is a stationary growth period under perfusion flow. In theory, the duration of the first two stages is much shorter than the third stage.
Equations describing the growth kinetics of perfusion cultures
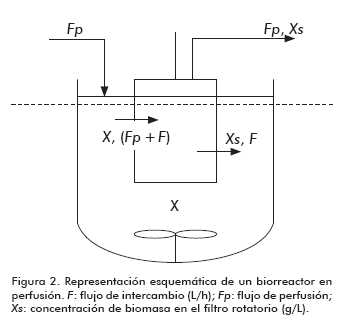
The analysis of growth kinetics for the first stage of the culture is similar to that usually applied to batch cultures (Figure 2)
The general mass balance equation for these systems (6) is:
![]()
Where:
Fp: Perfusion flow (L/h).
Xo: Biomass concentration in the bioreactor (g/L).
μ: specific growth rate (h-1).
X: Biomass concentration in the bioreactor (g/L).
V: Volume of the bioreactor
θ: Restricted cell passage through the screen
F: Exchange flow (L/h).
Xs: Biomass concentration in the spinfilter (g/L).
α: specific death rate (h-1).
Factor θ can be defined as the fraction of the cells entering the spinfilter (6):
![]()
Since Xs and X change with time, θ = F(t) Exponential growth in non-stationary state Since a) there is no biomass input or output, b) the death rate is negligible when compared to the growth rate, and c) at the beginning of the operation the number of cells entering the filter equals the number of cells exiting the filter and therefore the mesh of the spinfilter is clean, the following was obtained:

Where: μMAX: Maximum specific growth rate (h-1) Which is identical to the equation for batch cultures (1).
Exponential growth at continuous flow in non-stationary state In the second stage, according to the literature (3, 6), perfusion flow begins and the system continues growing exponentially due to the availability of substrate for cell growth at the maximum specific growth rate. Starting from equation (1) and with:
![]()
In this stage the filter mesh is partially clogged due to cell growth and the deposition of cell debris on the surface of the filter, thereby decreasing exchange flow (F) until it becomes negligible in relationship to the perfusion flow (Fp). At the same time, growth continues to follow exponential kinetics and the death rate (α) is negligible in relationship to the specific growth rate (μ = μMAX ) (6).
Therefore, the equation can be reduced to:

Where: D: Dilution rate (h-1).
Upon solving this separable differential equation, the following is obtained
![]()
For the substrate:
![]()
Where:
Fo: Starting exchange flow (L/h).
So: Starting substrate concentration (g/L).
S: Substrate concentration (g/L).
Yx/s: Biomass/substrate yield.

Solving this first-order differential equation yields:
![]()
For the product, using the equation:
![]()
Where:
Po: Starting product concentration (g/L).
Yp/s: Product/biomass yield P: Product concentration (g/L).
![]()
Applying first-order differential equations:
![]()
Limited growth at continuous flow in stationary state
During the final growth stage, after a large increase in substrate utilization due to the high cell densities reached by the culture, nutrient availability becomes a rate-limiting factor. This in turn leads to changes in specific growth and death rates that stabilize cell concentration at a stationary value with a magnitude that depends on substrate flow, and where growth, cell loss and death rates reach compensatory values.
Considering the third stage as a stationary process, biomass balance (starting from equation (1)) can be reduced to:

Where:
α: Specific death rate (h-1).
A: Total filtration area (m2).
μ*: Resulting specific growth rate (h-1).
Substrate balance:

Product balance:
![]()
Finally, the biomass/substrate yield for the system was defined as:

The productivity of the perfusion culture (g/Lh) is defined following the same logic applied to continuous culture (1), where cell productivity in this system:
![]()
And productivity for the product:
![]()
The whole derivation of these kinetic equations has taken into account neither the influence of the spin rate of the spinfilter, nor its area (6-8), nor the shear forces it exerts on the cells (9, 10):
![]()
Where:
Vc: Centrifugal speed (m/s).
s: Available area for cell passage through the membrane (m2).
ε: Membrane porosity.
![]()
Where:
Vg: Sedimentation speed (m/s).
Ø: g/h to m/s conversion factor
rs: Sedimentation flow (g/h)
Statistical modelation of θ
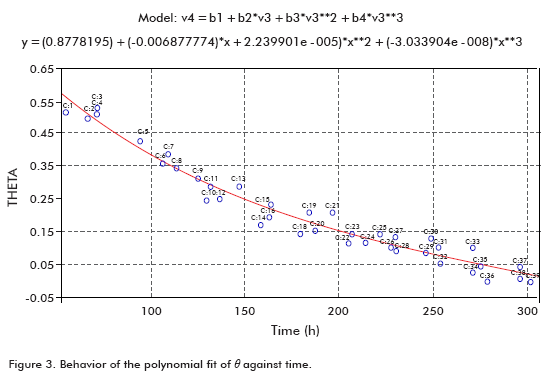
Taking data from several runs, θ was calculated in order to plot it against time (Figure 3), using a polynomial fit.
The fit showed that the fraction of cells entering the spinfilter through the mesh (θ) at the beginning of perfusion started from a maximum value at the beginning and progressively decreased with time, as described in the literature (3).
Simulation
Using the balances above, it is possible to obtain equations describing the behavior of the 41 L bioreactor:

Where:
qp: utilization rate (g/h).
![]()
Where:
Mp: Accumulated volume mass (L/h).
![]()
Where:
AcMan: antibody concentration (g/L).
And the behavior of θ was:
For 30 L
θ = (0.8778195) + (-0.006877774)* time + (2.239901e-5)* time 2 + (-3.033904e-8)* time 3 (23)
For runs during year 2000
μ = 0.03 for Xv ≤ Xv max (7.68 x 10⁶ cells/mL), where Xv is the cell concentration and Xv max, the maximum cell concentration.
μ = 0.005 for Xv ≥ Xv max
For runs during year 2001
μ = 0.035 for Xv ≤ Xv max = 24 x 106 cells/mL
μ = 0.005 for Xv ≥ Xv max
The equations for the models were programmed into VisSim, obtaining the predicted curves for cell growth, AcM concentration, accumulated product and perfused medium under the influence of the following variables: starting cell concentration, maximum cell concentration, maximum specific cell growth rate, minimum specific cell growth rate, and specific product formation rate.
Behavior of real and simulated values for runs from years 2000 and 2001
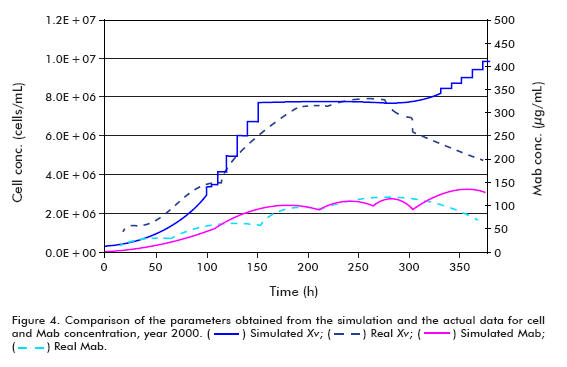
The simulation of the year 2000 runs was performed under the following conditions: Starting cell concentration (Xv0) of 2 x 10⁵ cells/mL, maximum cell concentration (Xv max) of 7.68 x 10⁶ cells/mL, maximum specific cell growth rate (μ max) of 0.03 h-1, minimum specific cell growth rate (μ min) of 0.005 h-1, specific product formation rate (qp) of 5 x 10⁻⁷ μg/(106 cells*h); using the model for theta in 30 L.
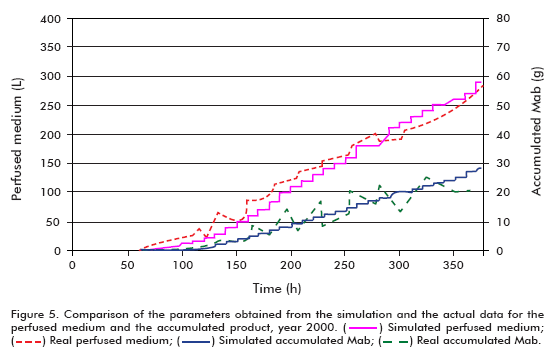
The efficiency of the model was examined by comparing the real and simulated data (Figure 4 and Figure 5); reaching the following conclusions:
Comparing the simulated and actual data from year 2000, it can be observed that the model describes adequately the behavior of the examined variables up to the start of cell death. The disparity of the simulated growth curve at the end of the fermentation when compared to the real data arises from the fact that the model does not represent the stage of cell death, and therefore the increase in filter retention results in exponential growth of the cells. The difference in growth curves from the start of the simulation to time = 100 h, on the other hand, can be explained based on the cell concentration inoculated into the bioreactor. Since the actual cell concentration was higher than that used in the simulation, it does not represent the stage of death, and therefore as a consequence of the increased filter retention, the cells begin to growth exponentially, as described in other works (6, 11-15).
Taking into account the slopes of the curves, it can be said that the simulated model has a larger specific growth rate.
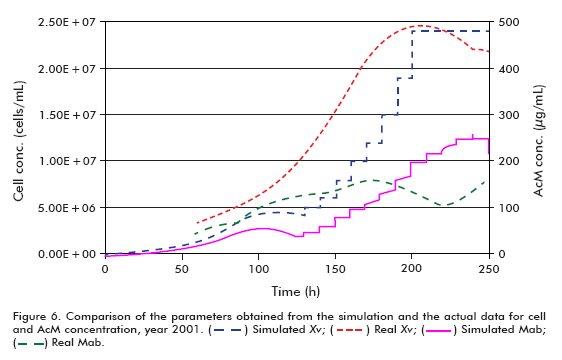
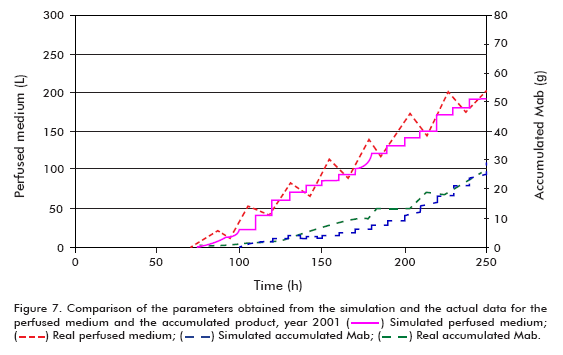
The simulation of the runs from year 2001 used the following conditions: starting cell concentration (Xv0) of 2 x 10⁵ cells/mL, maximum cell concentration (Xv max) of 24 x 106 cells/mL, maximum specific cell growth rate (μ max) of 0.035 h-1, minimum specific cell growth rate (μ min) of 0.005 h-1 and specific product formation rate (qp) of 5 x 10⁻⁷ μg/(106 cells*h), using the model for theta in 30 L.
Performing a similar analysis to that described above but using the data from year 2001 (Figure 6 and Figure 7), comparing simulated and actual curves, it can be concluded that there is a marked difference between specific growth rates. Evidently, the specific death rate influences significantly the outcome of kinetic processes, and therefore it is necessary to have a reliable numerical estimate of this variable for a more accurate fit of the model, as described in the literature (6, 11- 15). This effect carries over to the concentration of the product and, therefore, the accumulated product, but not to the perfused medium, which remains constant.
Limitations
The model does not take into account the influence of the spin rate of the spinfilter or the filtration area/ fermentor volume ratio. It also fails to consider the influence of hydrodynamic processes on the culture. Regarding the restriction factor for the passage of cells through the membrane of the spinfilter, a statistic, non phenomenological polynomial fit was used. Oxygen utilization by the culture was not balanced.
CONCLUSIONS
The derivation of mathematical equations describing cell behavior in perfusion fermentors, together with a statistical model fitting the observed behavior of cell passage through the mesh of the spinfilter on the 30 L bioreactor, allowed the implementation of a VisSim module to simulate the fermentation runs. This module was used to show that the variables have a marked influence on the perfusion system. Comparing simulated and actual data from year 2000, it was demonstrated that the model describes adequately the behavior of the variables until the moment in which cells start to die. The behavior of the simulated curve at the end of the run arises from the fact that the model does not take into account the stage of death, and therefore when filter retention increases, the cells start to grow exponentially. The difference in growth curves from time 0 to 100 h can be justified by the lower cellular concentration inoculated into the bioreactor under simulated conditions. A similar analysis was performed on data from year 2001, and the comparison of actual and simulated data revealed a large disparity in specific growth rates. Evidently, the specific death rate has a large influence on the outcome of kinetic processes, and therefore a reliable numerical estimate of this variable is necessary for a more accurate fit of the model, as described in the literature (6, 11-15). This effect carries over to the concentration of the product and, therefore, the accumulated product, but not to the perfused medium, which remains constant.
REFERENCES
1. Aiba S, Arthur EH, Nancy FM. Biochemical Engineering. Edición Revolucionaria, La Habana;1970.
2. Monbouquette HG. Modeling high biomass-density cell recycle fermentors. Biotechnol Bioeng 1992;39:498-503.
3. Yabannavar VM, Singh V, Connelly N. Mammalian cell retention in a spinfilter perfusion bioreactor for mammalian cell. Biotechnol Bioeng 1992;43:159-64.
4. Hartikka M, Vihko P, Södervall M, Hakalahti L, Torniainen P, Vihko R. Radiolabelling of monoclonal antibodies: optimization of conjugation of DTPA to F(ab)2 fragments and novel measurement of the degree of conjugation using Eu (III)- labeling. Eur J Nucl Med 1989;15:157-61.
5. Tolbert WR, Feder J, in: Annual Reports on Fermentation Processes 1983; Vol., Ed. 39.
6. Hernández LY, Castro LD. Análisis del proceso de fermentación en perfusión del monoclonal hR3 a escala de banco. Trabajo de tesis. ISP José Antonio Echevarría 2001. Cuba.
7. Robinson DK, Memmert KW. Kinetics of recombinant inmunoglobulin production by mammalian cells in continuous culture. Biotechnol Bioeng 1991;35:972-6.
8. Yashwant MD, Mina DM, Renato F. Practical consideration in operation and scale-up of spinfilter based bioreactors for monoclonal antibody production. Biotechnol Prog 1996;12:57-64.
9. Favre E, Thaler T. An engineering analysis of rotating sieves for hybridoma cell retention in stirred tank bioreactors. Cytotechnology 1992;12:180-7.
10. Varecka R, Scheirer W. Use of rotating wire cage for retention of animal cells in a perfusion fermentor. Develop Biologic Standard 1987;66:269-72.
11. Reuss M, Baltes M, Schneider R, Sturm C. Optimal experimental design for parameter estimation in unstructured growth models. Biotechnol Prog 1994;10:480-8.
12. Ryu DY. Cell cycle kinetics and monoclonal antibody productivity of hybridoma cells during perfusion culture. Biotechnol Bioeng 1994;44:361-7.
13. Zeng AP, Deckewer WD. Model simulation and analysis perfusion culture of mammalian cell density. Biotechnol Prog 1999;15:373-82.
14. Dutton RL, Schare JM, Moo-Young M. Descriptive parameter evaluation in mammalian cell culture. Cytotechnology 1998;26:139-52.
15. Haas CN. Unified kinetic treatment for growth on dual nutrients. Biotechnol Bioeng 1994;44:154-64.
Received in August, 2008.
Accepted for publication in August, 2009.
Luis Y Hernández. Centro de Inmunología Molecular, CIM. Ave. 15 esquina 216, Atabey, Playa, CP 11 600, Ciudad de La Habana, Cuba. E-mail: yunier@cim.sld.cu


