


 Custom services
 text in
  English (pdf)
 Article in xml format
 Article references
 Send this article by e-mail
 Cited by SciELO
  Similars in
SciELO
Similars in
SciELO 
 Permalink
Introduction
Microsatellites, or simple sequence repeats (SSRs), are small DNA motifs (from 1 to 6 nucleotides) repeated in tandem, present in all the genomes of prokaryotic and eukaryotic organisms 1. These sequences forms tracts that can range from a few copies to hundreds of them. The molecular mechanism that explains these sequences is the so-called replication slippage, being the mechanism itself the cause of variability observed in the number of copies 2. Microsatellites present high levels of polymorphism, which is translated as variable number of tandem repeats (VNTR) 3. They present mutation rates between 10-2 and 10-5 per locus per generation, contrasting with other markers, for example, simple nucleotide polymorphisms (SNP) that has mutation rate around 10-9. The variation in the mutation rates of VNTRs also produces a wide range of allelic diversity, making these markers very valuable to determine the degree of biological relationship between populations at the same species.
When, for a given study, microsatellites are chosen as markers, researchers have two options for their detection and characterization: generating sequence data or mining in repositories of sequences, whether public or private. The first option requires the preparation of genomic libraries, sequencing platforms and software for subsequent detection. The second option makes the first two steps of the first option unnecessary, eliminating its high costs, leaving only the stage assisted by software 4.
In silico mining of polymorphic SSRs comprises two stages: 1st detect SSRs, with a wide range of applications developed, which, despite having the same purpose, use diverse statistical and computational criteria that influences the results obtained (5, 6); 2nd determine if these SSRs has polymorphisms in repeat copy number, for which it is necessary to make sequence comparisons against repositories of sequences of related or the same species. The ideal applications for this purpose are those of BLAST type (Basic Local Alignment Search Tool, http://blast.ncbi.nlm.nih.gov/) 7. This second stage, due the goal of BLAST of searching through local alignment homologous subsequences and the composition of the SSRs, which are regions of very low complexity, entails post-processing the outputs which presents serious difficulties when we want to do this mining in a scaled manner. This post-processing is usually done by manually editing the alignments and visually inspecting them when there are few SSRs candidates to explore, but when it comes to hundreds or thousands of candidates, the process necessarily requires a formalization and automation. In reviewed articles on the subject, the methodology for these purposes is not clarified, presenting itself in some cases in a low explicit manner and in others, omitting completely. Few references appear on this second stage and it is due to the usual procedure of pass directly to functional genotyping in experimental manner, for which an extensive and expensive detection system is required, which includes PCR, electrophoresis and sometimes sequencing.
In the case of microsatellites, the determination of polymorphism by variation in copy number, either experimentally or in silico, is supported in the specificity of the flanks at each locus. These 5'- and 3'-flanking sequences, which are normally reported by software that detect SSR with sizes around 20bp, are assumed to be conserved and unique in the genomes of each species, allowing the unambiguous location of the locus and becoming candidates for primer sequences in PCR techniques.
When we do an extensive search with BLAST (blastn, for nucleotides) and the query sequences are SSRs with their respective 5'and 3' flanks, we have several complications due to the low complexity or redundancy of these sequences and also the possibility that flanks are not properly preserved. We must remember that BLAST is a system designed to detect homologous sequences that precisely includes filters to eliminate the high scores that produce these repeated regions. This system does not have a specific design to detect non-redundant homologous sequences separated by a redundant region and therefore it can’t capture the locus as a whole in order to compare the variations in copy number.
Figures 1A- 1D show BLAST outputs for an SSR with these characteristics and the different types of alignments that produce the findings (hits) for different entries in the chosen database. It is an SSR extracted from a genome of Vibrio cholerae faced with a database of nucleotide sequences of this bacterial species. The SSR query is shown with flanks of 20 bp in capital letters and the repeat region, which is the region that must vary in length in case of being a polymorphic locus, in lowercase letters, with repetition pattern aacaga. Figure 1A shows how the blastn finds a sequence that is identical to the query, producing 100% identity and an e-value of 1e-44. In this case it is not ruled out that the sequence found (ID: AP018677.1) is the same one from which the SSR was extracted, although it does not necessarily have to be that way. Figure 1B shows an ideal case where an entry is found in the database (ID: CP026647.1) with a locus that presents variation in the number of repetitions, in this case it is a suppression of (aacaga)2. Figure 1C shows two hits for the same sequence (ID: CP010812.1), which represent two entries in the BLAST output file (hit table) where the locus could not be completely covered by the system and two alignments are presented that overlap in a certain region. This represents a case where it is complicated to detect, visually or by another type of method, the variation in the number of copies. Finally, Figure 1D shows an entry for a sequence (ID: CP028892.1) where the alignment was truncated, not reaching the other flank and not reporting any other hit for that sequence with the right flank.
These are some examples where one can observe possible complications to interpret and detect polymorphism in a computational manner. When this is scaled to hundreds of markers it is totally impossible to do by simple visual inspection of alignments, even editing these to solve truncated entries.
The methodology that we present describes the stages and the algorithmic bases for the computational detection of polymorphisms in SSRs. The general procedure is done by the concatenation of software ranging from the detection of the SSRs, processing these by BLAST system and interpretation of BLAST outputs for detection of polymorphic markers.
In the following section (Methods) the sequence of steps followed by this methodology and the software used with explanation of its specificities are described in detail. In the Results section, the output corresponding to the detection of polymorphisms of SSRs in Mycobacterium tuberculosis genomes is exposed and analyzed. It also describes input parameters, input and output formats and reported values.

Methods
Figure 2 shows the general sequence of stages for in silico mining of polymorphic SSRs. First a run of MIDAS 8 is done, entering as parameters a genomic sequence file that can be in FASTA or GBFF format (with simple or multiple entries), the minimum unit of the repeat to be detected and the alignment parameters for match, mismatch and indel. MIDAS detects all SSRs, exact or approximate, and generates a MultiFASTA file (extension .mfaa) with 20 bp flanking sequences added in capital letters and the repeat in lowercase letters. This format that marks the repeat region with lowercase letters is used by BLAST as masking procedure.
Then we run SSRMerge script, which allows extracting the set of non-redundant SSRs from multiple MIDAS output files applied to multiple genomes. Its first parameter is a path to a directory in the PC and it will process all the files with extension .mfaa. This is an optional stage and is applicable only when we are analyzing multiple genomes of related species. The greater the taxonomic link between these genomes, the greater the probability of finding similar conserved loci that are repeated in different genomes. The algorithmic principle of this script is an all against all flank comparison of SSRs present in all files processed. This comparison is made by Nedleman-Wunsch global sequence alignment. When comparing two SSRs and they present more than 90% identity, one of them is chosen and the other is rejected. The result is a MultiFASTA file containing a set of non-redundant SSRs, according to the defined parameters, and we assume that these SSRs belong to different loci in the set of genomes analyzed.

The third step is a BLAST submitting (NCBI server, http://blast.ncbi.nlm.nih.gov/). The entry to the server is the MultiFASTA file of the previous stage. BLAST has many configuration parameters but the parameters that we must modify in that particular case are the following: In the search set (Choose Search Set) specify the organism for which we want to search (e.g. Mycobacterium tuberculosis (taxid: 1773)); in the program type select blastn, designed to find more remote homologies; in general parameters of the algorithm we are only interested in modifying the expected threshold (default threshold) which by default is 10. The expected threshold should be increased to > 30 allowing to find hits that although have large e-values they can be loci of interest. The next stage executed by PSSRextractor is responsible for debugging the wrong hits. Another parameter that needs to be changed is the masking procedure. We must mark the option of regions of low complexity and masking with lowercase letters. This guarantees that the blastn tries to recognize all loci including two flanks despite this is not always achieved, especially when the repeated region is large. The PSSRextractor script implements business rules to solve these cases. The output of this step is a hit table generated by the server.
Finally, the BLAST output is processed by PSSRextractor. It can process one or several outputs because its first input parameter is a path to a directory. It will process all the BLAST output files. This script first parses the hit table extracting all its information. The other two script parameters are identity and percentage of coverage that define criteria to consider the flanks in each entry of hit table. Subsequently it proceeds to evaluate the polymorphisms by variable number of repeat in the SSRs and it does so as follows:
For an SSR (query in hit-table) there will be one or many entries (subject in hit-table). Each SSR has a repeated unit size (RUS). Each entry in hit-table has the following values: subject access identifier (SAV), alignment length (AL), identity% (% I), initial position of the query (q.start), final position of the query (q.end), initial position of the subject (s.start) and final position of the subject (s.end). Then taking into account these data, the number of repetitions (RN) of each repeat unit is calculated by validating the following conditions:
If AL> 40 Then: RN = (AL - 40) / RUS. When the alignment is greater than or equal to 40 it means that it covered both sides of the query, since the repeated region is marked and not taken into account. Then the difference would give us the number of nucleotides that are in the repeat region that divided by RUS gives us the RN (Repeat Number). These cases occur with very low frequency.
If q.end <= 20 then the sequence found coincides with the left flank, otherwise, the sequence found coincides with the right flank. So for the same query, all the entries with the same SAV, will be classified to the left or to the right of the locus according to this condition. These cases are those that occur very frequently. See Figure 3.
If s.start left < s.end left AND s.start right < s.end right AND s.end left < s.start right, then RN = (|s.start right - s.end left| - 1) / RUS. This condition validates that the left flank is to the left of the subject sequence and that the right flank is to the right, being positive the direction (i.e. from 5' to 3'). Similar condition is validated when the address is negative, you just have to reverse the strict inequalities. This occurs because BLAST also analyzes the complementary sequence in the BD. See Figures 3 and 4.
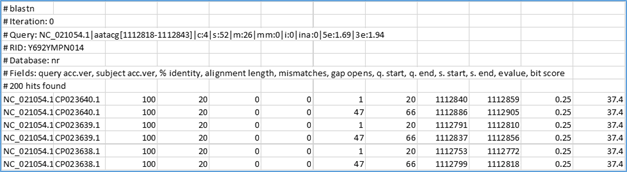
Figure 3 Example of BLAST hit-table output. It is observed how for a query it finds two entries for the same subject with SAV CP023640.1. The first entry has q.start = 1 and q.end = 20 (left side of the query) and the second has q.start = 47 and q.end = 66 (right side of the query).
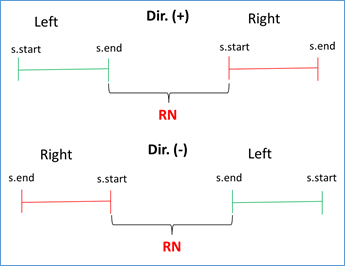
Figure 4 Validation of direction (positive or negative in query-subject comparison) and RN calculation.
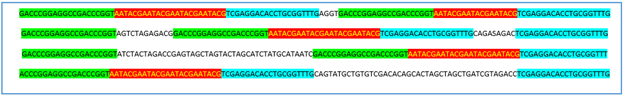
RN chosen = min {RNs found}. This validation is done because doubtful cases can occur due to duplicate regions in the same genome. For example, for the query with the repeated unit AATACG (red zone) between the left flank (green zone) and the right flank (blue zone) the following cases can be found:
Only entries where the alignments have a % I (second parameter of the script) and a % of coverage (third parameter of the script, (AL / 20) x 100) greater than 90 are taken into account. These two parameters guarantee that the flanks found are well preserved.
After having the set of RN for all subjects, PSSRextractor generates two result files, one detailed and one generic, with names equal to the hit-table but with suffixes _specific.xls and _generic.xls respectively. The detailed one provides information on each subject processed and the generic provides the information related to the polymorphism for each query, i.e. for each SSR.
Among the information related to the polymorphism that generic report provides, are the following values:
min_RN, max_RN and range: These are three columns in the report that respectively mean the minimum RN, the maximum RN and the range (max_RN - min_RN).
frequency: Frequency of the allele that shows the original SSR from which the search was made.
alleles: Number of alleles found for one locus (SSRs with different RNs).
PIC: Polymorphic Information Content
 . This value is also known in other contexts as expected average heterozygosity or Nei genetic diversity, and gives a measure of the probability that, for a single locus, a pair of alleles chosen at random in the population are different.
The rest of values shown in generic report come from MIDAS (access_number, pattern, pattern_length, RN, inaccuracy, entropy_5, entropy_3), which provides valuable information when interpreting polymorphic SSRs. For example, the degree of inaccuracy found in SSRs or the compositional entropy of the flanks allow us to know, respectively, the degree of inaccuracy of the repeated tract and how informative the flanks may be in the characterization of the locus.
The values of the last column of the generic report (exceptions) show labels that correspond to exceptions in polymorphism validation. There are entries in the generic report where more than one of these labels can appear because the exceptions can occur simultaneous. When all the subject sequences have exceptions, the labels are place. Labels are the following:
D (degenerated): The subjects have a% I and/or a % coverage <90%.
NF (not found): No subject was found in the database with similarity.
O (outlier): The number of repeat units between the flanks of the subjects is doubtful because it is very large, being unlikely that there is a microsatellite between them. The cut-off values established for this exception were mono: 157 bp, di: 364 bp, tri: 109 bp, tetra: 45 bp, penta: 150 bp and hexa: 193 bp. These values were defined after processing all the SSR from more than 200 bacterial genomes, registering their sizes, and establishing the cut-off in 3 times the interquartile range.
U (unpair): For the same subject sequence, one edge appears and not the other.
Results and Discussion
Mycobacterium tuberculosis, also known as Koch's bacillus, is a bacterial pathogen, causative agent of tuberculosis, a contagious infection that mainly affects the lungs but can spread to other organs. The prevalence of this disease is among the highest in the world, with approximately 12 million people infected. The bacillus is also object of concern in medical and scientific communities for presenting strains with resistance to multiple antibiotics.
The errors due to sliding in replication that cause microsatellites are normally repaired by three enzymes mutL, mutS and mutH, however some genomes such as mycobacteria suffer from this enzymatic system 9. Due to this, these bacterial species constitute a valuable example to investigate the rates of microsatellite mutations and the existence of regulatory mechanisms that govern them 10.
M. tuberculosis is a pathogen with a genetic diversity emerged from more diverse strains, gaining in virulence mechanisms 11. An example of medical importance in the expansion of microsatellites is that which occurs in proteins of mycobacteria with pentapeptide-2 (PP2) 12.
In the present study, 23 complete genomes were analyzed (RefSeq sequences), downloaded from the NCBI ftp site (ftp://ftp.ncbi.nlm.nih.gov/refseq/release/bacteria/), belonging to various M. tuberculosis isolates. MIDAS detected 4433 SSRs, and from them, SSRMerge script extracted 414 non-redundant loci from the species. The polymorphisms were mined from the BLAST server outputs with PSSRextractor script. The outputs of these two scripts can be found in the supplementary files (species_all.mfaa and Y692YMPN014-Alignment_generic_result.xls).
From 414 SSRs, 288 did not show any type of exception, and of these, 104 showed PIC> 0 (36.1%). Figure-5 shows average values obtained for the different types of SSRs classified by the size of the repeat unit (RUS).
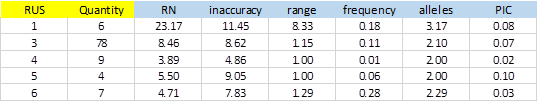
The number of SSRs with 3bp repeat unit is significant. This is because most of the bacterial genomes are coding regions, which have a bias in the use of codons. A single SSR was detected for dinucleotide and was excluded from the result due to exceptions in the polymorphism validation. On average, SSRs of 1bp were more inaccurate and showed greater polymorphism with more alleles and elevated PIC (3.17 and 0.08 respectively). The repetition tracts (RN) were also significantly greater than the rest.
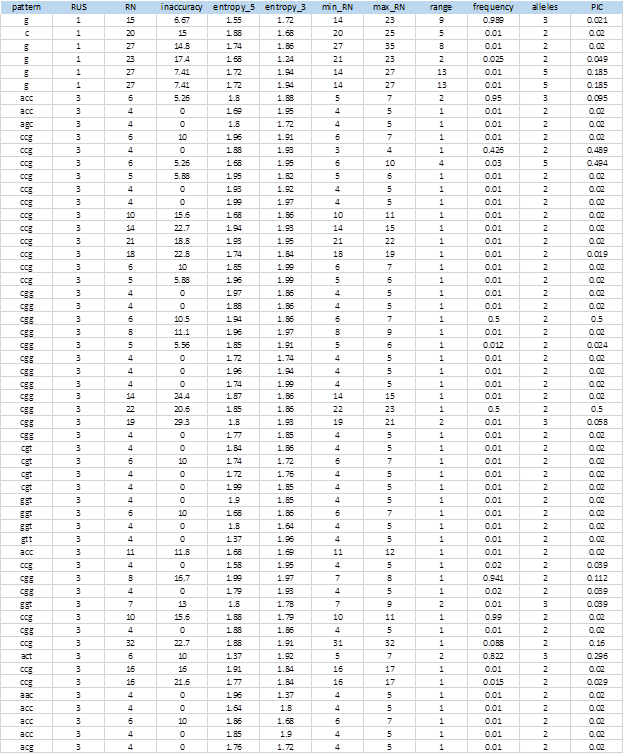
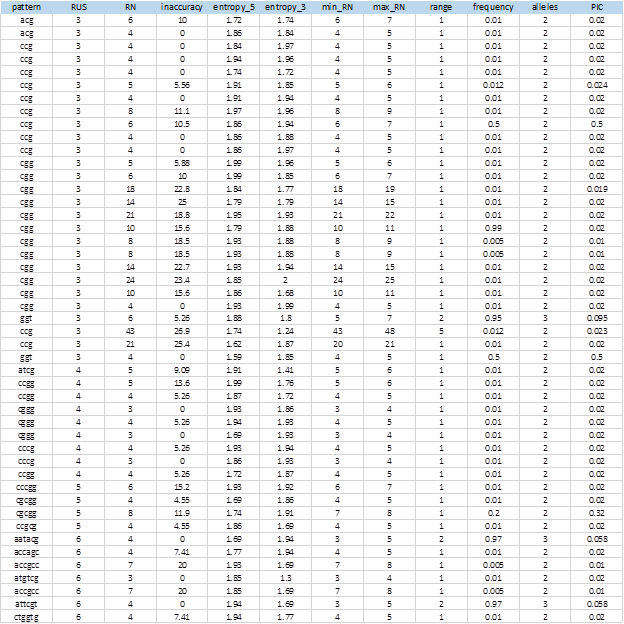
Figure 6 shows the complete list of 104 extracted SSRs that showed levels of polymorphism. The entire sequences of the markers, including the flanking sequences, the access numbers and positions in the genome can be obtained from the MIDAS outputs.
The methodology described has distinctive features with respect to other in silico procedures reported in the literature:
It has been experimentally demonstrated that not all SSRs loci show polymorphism. Among other aspects, this is because the locus within the analyzed population is not subject to a particular changing dynamic. In this sense, the methodology allows us to select those loci that do show polymorphisms in the selected sequence data banks, reducing the costs when it is done experimentally.
Determination of locus polymorphism is fully automated. The common procedures to detect polymorphisms, not the experimental ones, use visual inspection of multiple alignments for markers. In this sense, the procedure is ideal for large-scale analysis.
Polymorphism is defined strictly as variation in copy number (PIC> 0), and not as simple insertions or deletions present in markers that do not correspond to the size of the repeat unit.
The procedure can be done starting from SSRs detection in one sequence, but optionally, it can also start from multiple sequences without the need to assemble a consensus one. This allows a SSRs detection that do not belong to the same locus despite being in highly related genomes. SSRMerge script allows to eliminate the redundancy of common loci in all sequences.
The methodology is excellent for purely computational analysis of SSR loci, applied to evolutionary studies, genotypic identification or functional studies with the genes involved. For experimental analysis using PCR, the methodology provides all the necessary information (sequence access identifier, positions in the genome, flanking sequences, etc.) that allows the design of primers using applications available on internet.
Availability
All the software are available in supplementary material. MIDAS (binary distribution midas_v1.1.exe). SSRMerge and PSSRExtractor are compressed in zip format. Both are Java NetBeans Projects for JDK 1.8 platform or above. The binary jar files, for command line execution, are in \dist folder once decompressed.
Conclusions
A methodology for the fully computational detection of microsatellite polymorphic loci is described. As example of use, 23 complete genomes belonging to various isolates of M. tuberculosis were processed. 4433 SSRs were detected and from them 414 non-redundant loci were extracted within the species. The polymorphisms were mined from BLAST outputs and 104 SSRs showed polymorphisms. The methodology is intuitive and comes with software for application. Its main advantage lies in the levels of scaling it allows and the reduction of costs when experimental analyzes are made, allowing preselection of markers showing polymorphism in chosen genomic sequence data banks.

