


 Custom services
 English (pdf)
 Article in xml format
 Article references
 Send this article by e-mail
 Cited by SciELO
  Similars in
SciELO
Similars in
SciELO 
 Permalink
INTRODUCTION
Preclinical examination has been used in different areas of biomedical research, constituting one of the fundamental steps to provide the information necessary to design studies in human beings.1 The analysis of body composition is a fundamental part in the assessment of nutritional status of an individual and consists of the fractionation of the total mass of the body in its different main components. Said fractionation makes it possible to quantify each one of the fractions, as well as their variability during growth and in various pathological situations. According to the number of elements into which the total weight is divided, equations have been developed that range from the simplest model, which only considers fat mass and lean mass, to the more complex ones that distinguish up to six compartments.2
There are bioelectric methods that are based on physical principles such as the conduction or resistance capacity offered by the tissues to the passage of an electric current and one of the most used is electrical bioimpedance measurement (BIA). Indicators that comprehensively assess nutritional status include:3
It has been speculated from preclinical studies carried out in the last 10 years, on the effect of soy lecithin on pathologies related to obesity and overweight.4 The objective of this research is to determine the effect of soy lecithin on body composition.
MATERIAL AND METHODS
The present study is a secondary result of the investigation called "Nutritional effects, pharmacology and preclinical toxicology of LECISAN®". An experimental preclinical pharmacology study was carried out in the Basic Sciences Laboratory of the University of Medical Sciences and the Laboratory of Antibodies and Experimental Biomodels (Labex-cim) of Santiago de Cuba during 2019. Soy lecithin was used, supplied as raw material by the Soya Processing Plant of Santiago de Cuba, to the Oriente Pharmaceutical Laboratories for the production of the registered nutritional supplement LECISAN®.5
Study sample
Eighteen female Wistar rats, of 200 ± 70 gram weight and 10 weeks old were used, supplied by the Center for the Production of Laboratory Animals (CENPALAB), a recognized supplier of the Mayabeque Province, Cuba, belonging to the conventional sanitary category, with their corresponding hygiene-sanitary and genetic quality certificates.
Experimental design
The rats were randomly distributed in each group and a number of animals similar to that reported in previous research (n=6) was used, applying the principle of reduction of animal experimentation.6.7 Soy lecithin was administered to the experimental groups at doses considered maximum and minimum, equivalent to 600 (8.57 mg/kg for rat weight) and 300 (4.29 mg/kg for rat weight) milligrams/day in a human of average weight of 70 kg.5 The control group for comparison only received regular feeding and the same volume of distilled water at the time of administration. The test substance was administered via a 16G oral intragastric cannula for 30 days.
BIA measurement and recording techniques and procedures
A BODYSTAT QuadScan 4000 analyzer equipment was used, verifying its calibration prior to registration, which began without entering data, to only use pure values of Impedance (Z), electrical resistance (R) and capacitive reactance (Xc) in ohms (Ω). A current of 200 A at 50 kHz and tetrapolar methodology was used.8 All the precautions established with the animal were taken after anesthesia with sodium pentobarbital at doses between 15-40mg / kg. To place the electrodes, the axial line, the edges of the ear openings and the anterior edges of the orbits and the point at the level of the ischial spines towards the edge of the base of the tail were taken as reference. Care was taken to ensure the correct insertion of the needles, perpendicular to the skin and with a depth never less than 5 mm. (Fig. 1)

Fig. 1 -Procedure for recording bioelectric variables in anesthetized Wistar rats. Insertion of long 26½G metal needles and placement of electrodes of the BODYSTAT QuadScan 4000 analyzer that inject the current (red = positive) located outwards, and those that register (black = negative) inwards.
Analysis of body composition by electrical bioimpedance
Body composition was evaluated by calculating the fat and lean compartments applying equations for the determination and to calculate the impedance the standardized formula was used:9,10
Z = (R2 + Xc2) ½
To calculate the total body fat, the fat-free mass was subtracted from the body weight.8,9 The resistivity coefficient (Ro o ρ) was calculated for each animal in order to reduce the percentage of error, from values as the snout-anus length (L), resistance (R) and area (A), assuming values such as the abdominal perimeter of the animal to determine the radius (r) using the formulas:
ρ= (A/L)R, where A= π*r2 and r= 2*π/l (perimeter or abdominal circumference)
Analysis of body composition using dissection techniques
The weight gained was estimated as the difference between initial weight and weight at the end of the administration. After the animals were sacrificed, dissection techniques were used to separate the fatty tissue observed macroscopically in each fat compartment of the animal located in the abdominal and thoracic cavity (pericardial, retroperitoneal, omental, mesenteric, gonadal, subscapular and popliteal inguinal), weighing in grams of each one, in the case of the gonadal compartment, estimating the weight by mathematical equation taking into account that it is made up of 30 % of its weight by fat. The total fat weight was estimated as the sum of the fat tissue of all the compartments and as lean weight, the skin carcass, muscles and remaining appendages. Weight (in grams) and length (in centimeters) of the liver were taken for their value in the accumulation of fat tissue after weight gain.
Statistical data processing
The records were taken to a database that allowed the statistical-mathematical processing of the results with the SS©® version 23.0 system (SPSS, Inc., Philadelphia) for WINDOWS©® (Microsoft, Redmond, Virginia). Variables were described using the arithmetic mean and standard deviation to create tables and graphs. The differences between the study groups were produced using the Kruskal-Wallis test for independent samples, considering the level of significance to be less than 5 %, and Tukey's "post-hoc" test was performed for multiple comparisons of arithmetic means.
Ethical aspects
All the protocols were submitted to the consideration, analysis and approval of the ethics committee at the institutional level, for the study of compliance with the standards for the care and responsible use of animals in experimentation according to national and international standards, also observing the provisions of biological safety standards.1,11
This work is part of a Sectorial project of the Ministry of Public Health, approved by the Ministry of Science, Technology and Environment, which has the title "Nutritional effects, pharmacology and preclinical toxicology of LECISAN®" and that will give rise to other investigations of the product under study since they have the purpose of providing preclinical elements that support the development of a clinical trial that allows LECISAN to be positioned as a natural medicine, currently registered as a nutritional supplement.
RESULTS
The results of the pure parameters recorded by BIA did not show statistical significance in any of the administration groups with respect to the control, nor between both groups, except in the phase angle where it was significantly lower compared with the control and significantly particularly the intra- and inter-group comparison. Similarly, the statistical results of the post hoc test stood out. (Table 1).
Table 1. Variations in BIA records at the beginning and end of soy lecithin administration according to experimental groups
|
|
|
||||
|---|---|---|---|---|---|
| Z 5 Ω | Initial | 338.5±59.87 | 350.83±59.87 | 385.25±89.45 | |
| Final | 311.0±40.35 | 276.00±38.43 | 291.60±17.04 | 0.425 | |
| Z 50Ω | Inicial | 319.4±42.52 | 304.00±52.30 | 344.66±82.86 | 0.452 |
| Final | 269.6±35.94 | 240.33±36.43 | 294.70±85.75 | 0.190 | |
| Z100 Ω | Inicial | 294.0±38.84 | 294.66±40.07 | 319.41±79.39 | 0.511 |
| Final | 248.4±33.31 | 226.33±38.59 | 278.20±91.76 | 0.237 | |
| Z 200 Ω | Initial | 268.8±36.13 | 280.41±29.04 | 294.91±75.50 | 0.670 |
| Final | 228.6±30.36 | 214.83±40.99 | 264.20±101.72 | 0.302 | |
| Reactance(Xc) | Initial | 45.4±5.20 | 46.76±3.62 | 45.06±7.84 | 0.640 |
| Final | 36.6±5.21 | 30.90±4.15 | 40.08±13.08 | 0.136 | |
| Electrical Resistance(R) | Initial | 316.1±42.28 | 329.25±33.14 | 341.75±82.53 | 0.738 |
| Final | 267.6±36.56 | 238.75±36.59 | 291.90±85.12 | 0.197 | |
| Phase angle | Initial | 7.57±0.09 | 8.19±0.06 | 8.10±0.01 | 0.000 |
| Final | 7.51±0.01 | 7.78±0.05* | 7.38±0.07* | 0.000** | |
* p<0.05, statistically significant with respect to the control.
**P Value p˂0.05, statistically significant when comparing between groups of administration of the product under study.
As can be seen in the figure, the variation of the phase angle in both experimental groups of soybean lecithin administration presents a reduction of the parameter with respect to the initial value, but with a greater tendency to reduction in the one that received the maximum dose. (Figure 2).
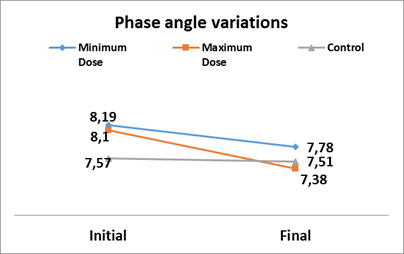
Fig. 2 Variations in the phase angle after administration of soy lecithin, according to experimental groups
During the research, the records of the parameters established by BIA with their variations in the groups studied were estimated and used to calculate and analyze total body water (TBW), fat-free mass (FFM), fat-mass (FM), extracellular water (ECW), intracellular water (ICW) and total body fat (TBF), as bioelectrical variables to estimate the body composition of the rats in the experimental and control groups (Table 2). All the variables showed significant differences when compared to the control except ECW. In the comparison between groups, only FM and ICW showed statistically significant differences. These results suggest effects of the product on lean and fat tissues and body water movement, which vary depending on the dose, toward increasing with minimum dose and decreasing with maximum dose.
Table 2. Effects of soy lecithin on body composition determined by BIA according to experimental groups
| TBW | Initial | 409.56±56.74 | 423.71±56.84 | 390.99±64.12 | 0.910 |
| Final | 523.02±75.70 | 549.24±63.76* | 470.41±78.05* | 0.185 | |
| FFM | Initial | 262.32±16.66 | 254.04±6.96 | 256.22±13.60 | 0.587 |
| Final | 290.67±14.35 | 310.02±18.72* | 274.64±21.88* | 0.264 | |
| FM | Initial | 237.15±232.7 | 232.71±7.14 | 244.52±7.40 | 0.069 |
| Final | 251.71±11.80 | 275.67±15.24* | 246.79±11.29* | 0.009** | |
| ECW | Initial | 240.93±35.34 | 220.53±28.05 | 218.65±46.22 | 0.643 |
| Final | 298.62±39.14 | 256.50±41.14 | 259.85±57.00 | 0.278 | |
| ICW | Initial | 168.83±24.44 | 203.18±60.12 | 172.33±28.22 | 0.488 |
| Final | 224.40±42.03 | 292.74±41.45* | 210.56±39.87* | 0.018** | |
| TBF | Initial | 181.49±14.14 | 176.11±5.61 | 188.64±4.86 | 0.005 |
| Final | 199.73±9.99 | 223.83±15.09* | 195.64±7.37* | 0.000** | |
* p<0.05, statistically significant with respect to the control.
** Value p˂0.05, statistically significant when comparing administration groups of the product under study.
The variables estimated as indicators of increase in body fat mass were analyzed, observing the statistical significance for all the indicators in the comparison between groups, with an increase in them. This result was also decreased in the group that received minimal doses of soy lecithin when compared to the control. However, in the group supplemented with lecithin at the maximum dose compared to the control, the Kruskal-Wallis test of independent samples showed only p˂0.05 values for the distribution of weight gain, liver weight and total fat. In the same way, these results are corroborated in the post hoc test. (Table 3).
Table 3. Effects of soy lecithin on variables estimated as indicators of increase in body fat mass
| Initial weight (g) | 253.8±15.2 | 248.5±6.47 | 260.50±5.43 | |
| Final weight (g) | 272.5±10.62 | 297.33±15.76* | 265.66±10.05 | 0.002** |
| Total weight gained (g) | 18.7±7.78 | 48.83±15.96** | 5.16±7.05* | 0.000** |
| Overall organ weight (g) | 53.95±4.79 | 57.38±3.45* | 53.37±6.36 | 0.000** |
| Lean weight (g) | 207.9±8.14 | 226.33±13.18* | 200.46±10.58 | 0.004** |
| Total fat weight (g) | 16.25±0.24 | 17.73±0.20* | 15.43±1.24* | 0.006** |
| Liver weight (g) | 8.56±1.82 | 8.78±0.50* | 7.33±0.42* | 0.000** |
| Liver Length (cm) | 4.38±0.36 | 4.96±0.15* | 4.53±0.34 | 0.026** |
* p<0.05, statistically significant with respect to the control.
**P Value p˂0.05, statistically significant when comparing between groups of administration of the product under study.
An increase in the perivisceral and surrounding adipose tissue of the cardiac area could be observed in rats of the minimal dose administration group, coinciding with the group that obtained greater weight gain, greater total fat weight, as well as global weight of organs with significant increase in weight and liver size. (Figure 3).

Fig.3 Observation and identification of adipose tissue in compartments located in the abdominal and thoracic cavities.
To estimate body composition using dissection techniques, the fat tissue located in the thoracic and abdominal cavity of the biomodels was observed, separated and weighed by experimental groups (Figure 4). It was observed that the accumulation or distribution of fat in the animals studied did not follow a pattern that bears any relation to fat loss in compartments of greater or lesser accumulation of this tissue.

Fig.4 -Dissection and separation of adipose tissue in compartments located in the abdominal and thoracic cavities in rats from the experimental group that received a minimum dose.
Variations in the distribution of fatty tissue for each compartment were studied to facilitate the analysis of the effect of the administration of the studied product in each experimental group (Table 4). In the experimental group that received minimal dose soybean lecithin, the weights of the retroperitoneal, mesenteric, inguinal, pericardial, and subscapular fat compartments, as well as the total fat weight, were significantly higher with p value <0.05. When analyzing the significance in the group that received the maximum dose, a p value of 0.05 was obtained only in the gonadal compartment. During the evaluation between the administration groups, the weight in the mesenteric, pericardial and total fat compartments were also statistically significant, and in addition, the gonadal and subscapular fat compartment.
Table 4. Effects of soy lecithin on body composition estimated by dissection techniques
| Gonadal | 0.81±0.07 | 0.75±0.05 | 0.56±0.08* | 0.001** |
| Retroperitoneal | 4.18±0.07 | 4.91±0.14* | 4.27±0.22 | 0.411 |
| Mesenteric | 2.81±0.07 | 3.05±0.10* | 2.55±0.32 | 0.011** |
| Omental | 1.43±0.08 | 1.46±0.21 | 1.26±0.18 | 0.117 |
| Inguinal | 5.55±0.13 | 5.80±0.10* | 5.41±0.46 | 0.099 |
| Subscapular | 1.21±0.07 | 1.35±0.10* | 1.10±0.22 | 0.045** |
| Popliteal | 0.00±0.00 | 0.00±0.00 | 0.03±0.08 | 0.363 |
| Pericardial | 0.26±0.05 | 0.40±0.08* | 0.26±0.08 | 0.022** |
| Total fat | 16.25±0.24 | 17.73±0.20* | 15.43±1.24 | 0.006** |
* p<0.05, statistically significant with respect to the control.
**P Value p˂0.05, statistically significant when comparing between groups of administration of the product under study.
DISCUSSION
BIA, a precise method to determine the volume of body fluids and FFM, is based on the application of an electrical current of low potentials and intensity at different frequencies that is transmitted differently through lean and adipose tissues, being the greater driving by the first.9
Its foundation is based on the principle of Z, by which the response of a cylinder filled with liquid to the passage of electric current is studied.12 The electric charges of the ions present in the fluid oppose the passage of the current electrical, and this is known as R. The relationship between impedance and resistance allows the calculation of Xc that constitutes the capacitance of the membranes, expressed in Ohm. The tangent between R and Xc is known as the Phase Angle, an excellent nutritional marker.(8.9)
In an investigation in Wistar rats to observe the distribution of adipose tissue under a high sucrose diet, the body compartments were evaluated by BIA and no difference was found between experimental groups.13 Neto-Angéloco et al.,14 in a similar investigation concluded that the BIA analysis did not emerge sensitive for detecting changes in body composition, but found a reduction in total body water in the experimental group with the highest fat quantification, which differs from this study. On the other hand, we consider that the increase in indicators at a minimum dose is probably related to the modulation of physiological functions in the tissues, which favor weight gain; however, at maximum dose, cumulative effects of the constituents of the product occur, showing weight reduction, which would have to be corroborated in future studies aimed at searching for toxic effects.
According to Pomar et al.15 in one study, the offspring of rats fed a diet with a high lipid content during lactation had less lean mass but more adipose tissue, a result that is similar to that observed in the group that received the lowest dose. For these authors, obesity causes chronic inflammation that can affect the integrity and function of tissues, and in muscle tissue there is a greater deposit of adipose tissue. This promotes specific changes in muscle protein metabolism, impairing protein synthesis in the muscle. On the other hand, the increase in ACT could be related to the inflammatory processes that obesity generates.
BIA was used in preclinical research to design a neurodiffuse system capable of accurately predicting fat content.16 In a study to test the use of murinometric and bioimpedance indices (BIA) in determining obesity in oophorectomized Wistar rats, body fat gain was detected with greater precision by BIA, due to its ability to distinguish lean mass from fat.17 This result is similar to that of our research and the consideration of a single FA cut-off point in the groups studied seem to be sufficient for its interpretation as a prognostic factor, and it proved useful to evaluate nutritional status in rats after administration of soy lecithin.
PA is the parameter of the BIA most established for the diagnosis of malnutrition and the clinical prognosis, it is dependent on the capacitance of the tissues, associated with the size of the cell and integrity of its membrane, and by the resistance, which depends of the hydration of the tissues. There is a positive association between PA and survival and it is suggested as an important tool to assess disease progression, but the lack of reference values has limited its use.8,9
In healthy tissue, the distance between cells is minimal, but it allows current to pass through the extracellular space.2,3 Tissues contain different cells that vary in morphology, arrangement, aggregation, adhesion, and ion channel activity and protein and genetic expression, all of them factors that affect the bioimpedance spectrum. The greater the number and proximity of the cells, the greater the electrical resistance of the extracellular space.8,9
The method has been used successfully as a tool to differentiate between normal and stroke conditions in rats.18 Some pathological conditions involve cellular alterations that are reflected in changes in electrical properties. When there is a decrease in oxygen supply, cell volume increases because extracellular water penetrates inside. As a consequence, the resistance to the passage of current through the extracellular medium increases.2,12 A study to detect hypoxia in real time in rabbits showed that BIA could be a potential tool due to its sensitivity and precision.19
The anatomical distribution pattern of body fat has a clear relationship with cardiometabolic risk, and fat accumulation at the perivisceral level is associated with increased risk.20 In the present study, no useful pattern could be found to suggest effects of the product in the reduction of visceral fat and, therefore, indicative of benefit as suggested by some recently published research.21 The increase in fat observed in the pericardial compartment was an unfavorable prognostic indicator for the development of atherosclerotic processes.
There are preclinical studies that address the factors associated with the origin of fatty liver infiltration, including obesity22 and it is suggested that soy lecithin in high doses can stimulate the synthesis of fatty acids causing liver involvement.23
Specialized studies are required to determine the hepatoprotective effect of soy lecithin and must be corroborated with macro and microscopic, humoral and acute and chronic toxicity studies, as established by the regulations for research of a new product.
The research was limited to evaluating the influence of the product on body composition, but estimates of other nutritional parameters and the use of direct methods of studying body composition such as carcass examination, as the gold standard, are required to corroborate these results.

