My SciELO
Services on Demand
Article
Indicators
-
 Cited by SciELO
Related links
-
 Similars in
SciELO
Share
Ingeniería Energética
On-line version ISSN 1815-5901
Energética vol.39 no.2 La Habana May.-Aug. 2018
APLICACIONES INDUSTRIALES
Wind resources assessment of Cuba in future climate scenarios
Evaluación de los recursos eólicos de Cuba en futuros escenarios climáticos
Yoandy Alonso1, Arnoldo Bezanilla1, Abel Centella1, Israel Borrajero1, Alfredo Roque1, Yosvany Martinez2
1Center of Atmospheric Physics, Cuban Institute of Meteorology, INSMET, Havana, Cuba
2Meteorological Research Division, Environment Canada, Dorval, Quebec
ABSTRACT
A preliminary analysis of the behavior of the wind speed is presented using the regional climate model PRECIS, focusing on changes in the distribution of this variable for three periods of 30 years in the future 2011-2040, 20412070 and 2071-2099. The regional climate model PRECIS is used in high resolution scenarios of climate change SRESA1B, using boundary conditions from the MCG ECHAM5 and 6 of the 16 members of the set of perturbed physics HadCM3 MCG. It was found that changes in wind speed will be higher in the eastern and northern coast, becoming statistically significant for the second half of this century with an increase in wind magnitude between 0.1 and 0.4 m s−1. It is concluded that these areas of increased wind power match with the current projection of the Cuban wind program where the construction of 13 new wind farms are contemplated.
Key words:wind resource assessment; wind power; climate model PRECIS; changes wind speed; climate change scenarios.
RESUMEN
Se presenta un análisis preliminar del comportamiento de la velocidad del viento, utilizando el modelo climático regional PRECIS, centrándose en los cambios en la distribución de esta variable para tres períodos de 30 años en el futuro 2011-2040, 2041-2070 y 2071-2099. Se emplea el modelo climático regional PRECIS en escenarios de cambio climático de alta resolución SRESA1B, utilizando condiciones de frontera de MCG ECHAM5 y 6 de los 16 miembros del conjunto de física perturbada HadCM3 MCG. Se comprueba cómo los cambios en la velocidad del viento serán mayores en la región oriental y costa norte del país, siendo estadísticamente significativos para la segunda mitad del siglo XXI, con un aumento en la magnitud del viento entre 0.1 y 0.4 m s−1. Se concluye que estas áreas de aumento del potencial eólico coinciden con la proyección actual del programa eólico cubano donde se contempla la construcción de 13 nuevos parques eólicos.
Palabras clave: evaluación de recursos eólicos; energía eólica; modelo climático PRECIS; cambios en la velocidad del viento; escenarios de cambio climático.
INTRODUCTION
Exploring the impact of climate change on wind energy is a focus of research and scientific analysis in many countries around the world. Several studies have shown that during the last three decades of measurements in the boundary layer and in the surface layer of the atmosphere, the wind has changed over the planet. The use of regional climate models (MCR) in the Caribbean region is relatively limited, although in recent years there has been a noticeable increase in the use of this tools. Recently, [1], used the model RegCM4 for similar purposes, while [2] and [3], developed a sensitivity study to the parametrizations and dimensions of the domain, using the model RegCM4.1.
In Cuba, the first climate scenarios generated by the use of downscaling techniques were due to [4], from the participation of researchers in a regional initiative coordinated by the Climate Change Centre of the Caribbean Community (CCCCC) ([5]). The technique of downscaling used was dynamic, using the regional climate model HadRCM3, encapsulated in the PRECIS system, which was fed by the outputs of the MCG HadAM3P and ECHAM4, for emission scenarios SRESA2 and B2. The results were generated at a resolution of 50 km and though in a limited way, they considered two important sources of uncertainty; the emission scenarios and structural. Among other varied studies, these scenarios were the basis of the impact studies and adaptation measures documented in [6].
In subsequent years, the technological development of INSMET and the CCCCC coordinated initiative strengthening, have created the conditions to develop new and more complex simulations using the PRECIS system. However, increasing the number of simulations with HadRCM3, required to assess and identify an appropriate and computationally optimal domain so that they could be performed. In the study by [7] it was possible to demonstrate that the HadRCM3 model showed little sensitivity to changes in the dimensions of domains and it was concluded that a relatively small domain could be used optimally to reproduce the Caribbean climate. In that study elements showing the added value of PRECIS and the ability of this RCM to represent key features of the climate of the region as the Caribbean low level jet, midsummer drought, and also the variations found in the North Atlantic Subtropical anticyclone influence. Thus, these authors confirmed some of the findings by [4] and [8].
Until now, climate scenarios developed in Cuba have been used to assess impacts on different sectors such as agriculture, water resources, and human settlements or in areas such as biodiversity. However, until now, potential impacts on renewable energy sources such as wind power, have not been evaluated. Such evaluations have great significance when considering two key aspects: i) Renewable energy sources appear as very promising climate change mitigation alternatives, though they are typically dependent of the weather and ii) in addition to benefits aimed at mitigating climate change, there are other environmental and economic issues that have led to the promotion and development of these alternatives within the energy matrix in Cuba. For these reasons, the development of climatic scenarios linked to assessments of potential impacts on the generation of wind energy are highly topical and have great scientific and practical importance. The main goal of this research is to generate high resolution future climate scenarios for the Caribbean region to analyze the behavior of the wind speed, this variation will be added to the new outputs of The Numerical Wind Atlas of Cuba to estimate the values of wind speed in the future.
METHODOLOGY
The dataset used in this study consisted of: 1. wind speed average fields at 10 m height above mean sea level (ASL) estimated by [9], 2. average wind speed fields at 10 m height above mean sea level (ASL) estimated by [10], 3. and finally, to validate PRECIS model performance reanalysis data for the period 01 January 1989 to 31 December 2002 will be used. The dataset used for validation consists of 6-hourly observations of wind speed at 32 meteorological stations at 10 m AGL.
These data, including daily wind speed, estimated from the 6-hourly observations for the period 01 January 1989 to 31 December 2002 were compared with estimated wind from the PRECIS model fed by reanalysis data provided above. The availability of these time series of observed data allowed to have an idea of the trend in the velocity of simulated and observed wind. Calculating wind power values (fig. 7) was performed from wind speed, using the equation (1):
Where V is the wind speed and ρ is the air density assumed as approximately 1.19 kg m−3 [11].
The experiments developed in this work were based on the proposed domain [7], who conducted a detailed analysis of the implications of the dimensions of different domains in the simulation of key aspects of the climate of the Caribbean region. These authors also demonstrated the ability of model PRECIS to produce added value on the higher resolution information that feeds it, something that had already been approached by [4] and [8].
In this work is used the version 1.8.2 of the PRECIS regional climate modeling, The RCM is a 19 levels hydrostatic model described by a hybrid system of coordinates. The horizontal resolution is 0.22◦ x 0.22◦ equivalent to 25 km, respectively, in the Equator of the rotated grid. Due to the use of this high resolution, the model requires a time step of 2.5 minutes to maintain numerical stability. Surface conditions are required only on water, where the RCM needs time series of sea surface temperature and ice extensions.
Currently the Met Office at Hadley Centre is in a position to provide the boundary conditions for 17 members of a set of physically disturbed runs for use with the PRECIS RCM in order to allow users to generate a set of high resolution regional simulations. However, developing projections with all 17 experiments require a computational capacity that is not currently available and therefore it was decided to select a subset of six members for such purposes. For the selection of the six members used in this work, results presented by ([12]) were used to develop an expert judgment exercise within the Climate Modeling Group in the Caribbean. The elements considered were the ability of five of the six members to play the current climate in the Caribbean and consider those who represent the widest possible range of future uncertainty, using the values of climate sensitivity of each member. Following the selection of the subset to be used, selection methods have been published that incorporate objective aspects ([13]), but still rely largely on subjective aspects when establishing elements for selection conditions. The sixth member of the subset was represented by the standard version of the model HadCM3, which is a undisturbed member ([9]). All experiments were performed at 10 m ASL to establish a comparison of the results with surface meteorological stations. To determine how significant the increase or decrease in the values of the wind speed is, it is necessary to know the degree of significance that such variation can have, for this we calculate the standard deviation using equation (2), for each grid point i where Vki is the value of the PRECIS wind speed for the i-th grid point for day k and V¯i is the average speed for all days and N is the total number of days run.
The significance level field in the i -th grid point is calculated according to the equation (3):
Where V¯0i is the average speed of the base period and σ0i is the standard deviation of the base period.
After calculating the significance ζ for each grid point we keep only the values that are above the 95th percentile of the entire sample (ζi ≥ 1.96) and only those grid points are now taken into account to represent the wind speed BIAS.
RESULTS AND DISCUSSIONS
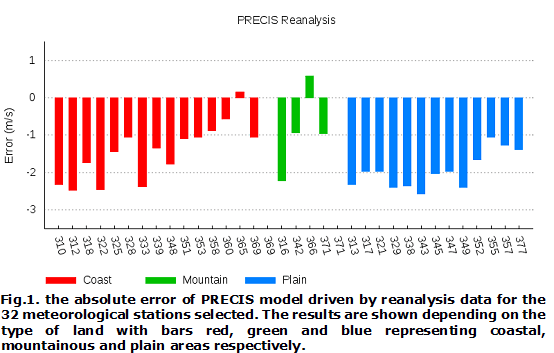
It is necessary to know the ability of the modeling system used to represent aspects of the wind power. Therefore we proceeded to calculate the absolute error of PRECIS model (fig. 1) driven by reanalysis data (1989-2001) was also calculated. The EMA for all meteorological stations is 1.56 m s−1, maintaining a large number of stations with errors that exceed 2 m s−1. According to the findings in this same figure 1, we can say that the PRECIS model tends to overestimate the wind resource, with some exceptions like Punta Lucrecia (365) and Gran Piedra (366). [9] argued that some of the main factors of the discrepancies in the calculations PRECIS can be attributed to the large size of the grid with the model (25 km) was run.
To study in greater detail the behavior of the model and reflect the skill in the conducted experiments and the ability to represent climate variability of the wind, stations of Casablanca , Camaguey,¨ Nuevitas, Puerto Padre, Punta Lucrecia and Mais´ı were selected; which are related to wind studies currently being carried out in our country [11] and [10]. Establishing a comparison between the time series of surface stations and time series produced by the model PRECIS, in this case using reanalysis data for the period 01 January 1989 to 31 December 2001 (fig. 2). This figure 2, shows panels of the observed (black lines) and time series constructed using the PRECIS model (every year) for wind speed (blue lines) at 10 m AGL. The graphs indicate that the model overestimates the values of the wind speed in the selected meteorological stations with the exception of Punta Lucrecia where it tends to underestimate it and the station of Mais´ı where the wind speed is very close to the measurements made. However, the model does show a great effectiveness in the trend of the wind speed over the time series at the selected meteorological stations.
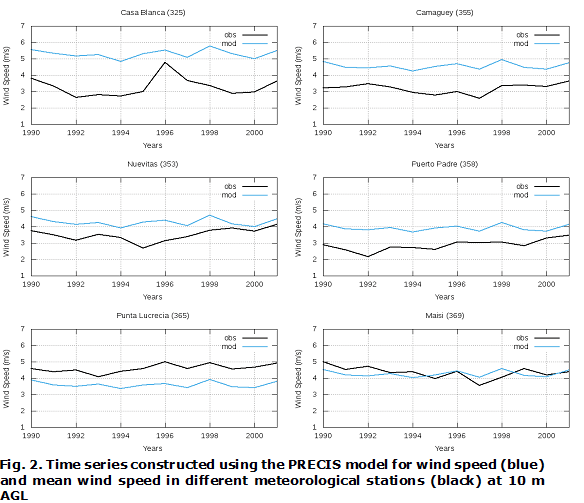
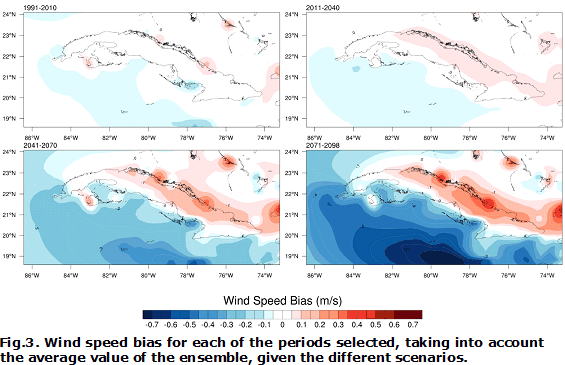
Figure 3, shows the behavior of the average wind for each of the periods selected with respect to the base period, taking into account the average value of the ensemble, given the different scenarios. In this figure a reinforcement of the magnitude of the wind can be seen, especially towards the second half of the century in regions where the largest wind resources in Cuba are currently located [11] and [10]. However, to know the significance of this increase, the level of significance was calculated using the methodology described, and the result is reflected in figure 4.
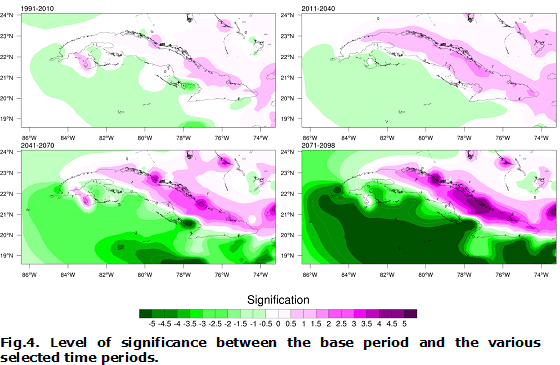
Setting an absolute threshold value of 1.96, corresponding to 95 % of the interval of no significance, regions can be determined where the increase obtained for the second half of the century is truly important.
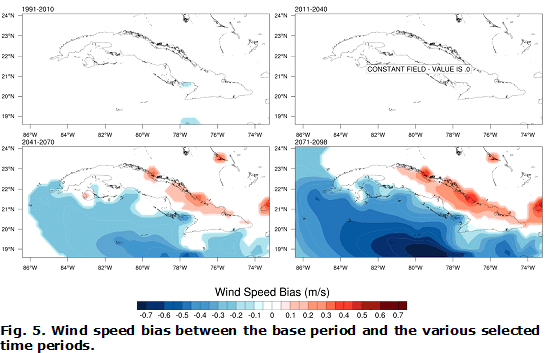
Filtering of these values is shown on figure 5, with the significant increase for each of the periods with respect to the base period. It can be seen that for the periods 1991-2010 and 2011-2040, the average wind does not experience any change as to its magnitude and, from the period 2041 to 2070, it begins to show a rising trend on the north coast from the central provinces to the east of the country, and this will further increase to the period 2071-2098. The expected increase of wind magnitude is between 0.1-0.4 m s−1, may be higher for higher levels, if the vertical increase in wind speed in the atmospheric surface layer is taken into account ([14]). The most relevant of this increase is that it can consolidate the current projection of the Cuban wind program until 2030, where the construction of 13 wind farms is proposed precisely where the wind power of Cuba will increase since the second half of the century. Moreover, Cuba’s southern coast experienced a slight decrease in the values of wind speed that will be greater towards the Caribbean Sea.
The future projection of the wind power of Cuba are based on estimates from the reference period (1961-1990) and future periods changes (2011-2040, 2041-2070 and 2071-2098), taking approximately intervals of 30 years as this is recommended by various authors for conducting the climatological studies. Figure 6, shows the average wind given by the ensemble using the PRECIS model for different periods selected. In this figure it can be seen that on the north coast the highest values are obtained in correspondence with other works on the estimation of wind resources in Cuba ([11] and [10]). Figure 7, is as figure 6, but for the wind power in W m−2, which has tremendous value for the wind energy industry.
![Fig.6. Average wind speed given by the ensemble using the PRECIS model for different selected periods. The values of the average wind speed are given in [m−2].](/img/revistas/rie/v39n2/f0607218.gif)
![Fig. 7.average wind power given by the ensemble using the PRECIS model for different periods selected. The values of the average wind power are given in [W m−2].](/img/revistas/rie/v39n2/f0707218.gif)
CONCLUSIONS
The wind atlas generated from the 53 years experiment is compared with the wind speed observations collected during the same period of time at 32 meteorological stations, distributed all over the country. All the experiments were carried out at 10 m height ASL to be able to establish a comparison with the results at the meteorological stations. The results for this first experiment indicate that, overall, PRECIS overestimates the near surface wind speed and the largest wind resources are obtained on coastal areas, at the top of the hills and in areas of plateaus.
PRECIS estimates highly accurately the wind resource in those areas. The largest discrepancies between observations and model are found at the stations with observed wind speed below 2.5 m s−1 which are mainly located in coastal regions, areas of dense and high vegetation clusters, and narrow keys that were smoothed out by the model grid spacing.
In the future it is observed that the wind resource will be greater in the Eastern and Northern coast of the country. Coincidentally with other studies on estimation of the wind resource in Cuba. Comparing with the baseline it is observed that the major changes will occur in the north east coast of our country in the second half of this century and these changes are statistically significant for an increase in the magnitude of the wind between 0.1 and 0.4 m s−1 with a confidence level of 95 % to 10 meters in height, coinciding with the current projection of the Cuban wind program until 2030 where the construction of 13 new wind parks has been planned.
REFERENCES
[1] ALONSO,Yoandy, Y. Martinez, A. Roque, W. Yu, and I. Borrajero. ¨A post-processing module based on Cressman’s Analysis to improve the Wind Energy Simulation Toolkit (WEST) mapping system¨. Wind Engineering, ISSN 0309524X, Submitted, 2017.Disponible en: http://www.latestjournalarticles.com/default.asp?tab=3&camefrom=ENERGY&issn=0309-524X&eissn=blank
[2] A. Bezanilla, A. Centella, A. Roque, I. Borrajero, and Yoandy Alonso. ¨Escenarios climáticos de alta resolución sobre el Caribe usando el modelo PRECIS¨: Análisis preliminar sobre el comportamiento de dos fuentes renovables de energı́a en Cuba. Informe cientı́fico técnico, INSMET, 2016.Disponible en: https://www.google.com/url?sa=t&rct=j&q=&esrc=s&source=web&cd=1&ved=0ahUKEwic94aEobfZAhWJ21MKHa0JCh0QFggmMAA&url=http%3A%2F%2Fwww.oei.es%2Fhistorico%2Fdecada%2FElcambioClimatico_r.pdf&usg=AOvVaw2fNsfgpU5zTpemYIdZyOi-
[3] JD Campbell, MA. Taylor, TS. Stephenson, RA. Watson, and FS. Whyte. ¨Future climate of the Caribbean from a regional climate model¨. Int J Climatol., page DOI: 10.1002/joc.2200, 2010.Disponible en: http://onlinelibrary.wiley.com/doi/10.1002/joc.2200/abstract
[4] A Centella, A Bezanilla, I. Borrajero, and A. Vichot. ¨Escenarios Climáticos de Alta Resolución para la región de los Mares Interamericanos utilizando el Modelo PRECIS¨. Informe de Resultado Cientı́fico, Instituto de Meteorologı́a:53 p, 2009.Disponible en : http://cabernet.atmosfcu.unam.mx/IAI-CRN/files/DanielMartinezModRegClim.pdf
[5] A. Centella-Artola , et al. ¨Assessing the effect of domain size over the Caribbean region using the PRECIS regional climate model¨. Clim. Dyn., 44, ISSN 0930-7575:1901–1918, 2015.Disponible en: https://www.metoffice.gov.uk/binaries/content/assets/mohippo/pdf/migrated/centellaartola15caribbeanprecisdomainsize.compressed.pdf
[6] S. Emeis. ¨Wind Energy Meteorology. Atmospheric Physics for Wind Power Generation¨. Springer-Verlag Berlin Heidelberg, pages ISBN 978–3–642–30523–8 (eBook), 2013.Disponible en: http://www.springer.com/la/book/9783642305221
[7] R. Fuentes-Franco, et al. ¨Inter-annual variability of precipitation over Southern Mexico and Central America and its relationship to sea surface temperature from a set of future projections from CMIP5 GCMs and RegCM4 CORDEX simulations¨. Clim. Dyn., 45, ISSN 0930-7575:425–440, 2015.Disponible en: https://rd.springer.com/article/10.1007/s00382-014-2258-6
[8] D. Martı́nez-Castro, A. et al. ¨Performance of RegCM-4.3 over the Caribbean region using different congurations of the Tiedtke convective parameterization scheme¨. Revista de Climatologı́a, 16, ISSN 1578-8768:77–98, 2016.Disponible en : https://rd.springer.com/article/10.1007/s00382-017-3863-y
[9] C.F. McSweeney, R. Jones, and B.B.B Booth.¨ Selecting ensemble members to provide regional climate change information¨. J. Climate, doi: 10.1175/JCLI-D-11-00526.1, 2012.Disponible en: https://journals.ametsoc.org/doi/abs/10.1175/JCLI-D-11-00526.1
[10] E Planos, R. Rivero, and V. Guevara. ¨Impacto del Cambio Climático y Medidas de Adaptación en Cuba¨. Instituto de Meteorologı́a. Agencia de Medio Ambiente, Ministerio de Ciencia Tecnologı́a y Medio Ambiente, La Habana, Cuba, 2014.Disponible en: http://www.revistaccuba.cu/index.php/acc/article/viewFile/387/318
[11] A. Roque, et al. ¨Application of the Wind Energy Simulation Toolkit in Subtropical Climates: Wind Atlas of Cuba¨. Wind Engineering, ISSN: 0309524X, Submitted, 2017.Disponible en: http://www.latestjournalarticles.com/default.asp?tab=3&camefrom=ENERGY&issn=0309-524X&eissn=blank
[12] B. M. Sanderson. ¨A Multimo del Study of Parametric Uncertainty in Predictions of Climate Response to Rising Greenhouse Gas Concentrations¨. J. Climate, 24, DOI: 10.1175/2010JCLI3498.1:1362–1377, 2011.Disponible en: https://journals.ametsoc.org/doi/abs/10.1175/2010JCLI3498.1
[13] K. Taylor and R. Stoufferand G. Meehl. ¨An overview of CMIP5 and the experiment design. Bulletin of the American Meteorological Society¨, 93(4), ISSN 1093-9563:485–498, 2012.Disponible en: https://journals.ametsoc.org/doi/abs/10.1175/BAMS-D-11-00094.1
[14] A. Vichot-Llano, D. Martı́nez-Castro, A. Centella-Artola, and A. Bezanilla-Morlot. ¨Sensibilidad al cambio de dominio y resolución de tres configuraciones del modelo climático regional RegCM 4.3 para la región de América Central y el Caribe¨. Revista de Climatologı́a, 14, ISSN 1578-8768:45–62, 2014.Disponible en: https://slides.tips/sensibilidad-al-cambio-de-dominio-y-resolucion-de-tres-configuraciones-del-model.html
Recibido: 1/10/2017
Aprobado: 1/1/2018
Yoandy Alonso, Center of Atmospheric Physics, Cuban Institute of Meteorology, INSMET, Havana, Cuba. E-mail: yoandy.alonso@insmet.cu


 (2)
(2) (3)
(3)
