


 Custom services
 Spanish (pdf)
 Article in xml format
 Article references
 Send this article by e-mail
 Cited by SciELO
  Similars in
SciELO
Similars in
SciELO 
 Permalink
Introduction
This article looks at the development of energy consumption and carbon dioxide (CO2) emissions in Cuba. The change over time in energy consumption and CO2 emissions and the reasons for changes are in the focus. Earlier studies on the reasons for a change in aggregated energy consumption or/and CO2 emissions in Cuba are rare, only one article by Vazquez et al, [1], solely focuses on Cuba. However, in some international comparisons, especially those made for the Caribbean and Latin American countries, Cuba has been included in the analysis of energy consumption [2], energy intensity [3], and CO2 emissions [4, 5], in recent years.
We carry out two index decomposition analyses with the Sun-Shapley method to illustrate the role of major drivers of energy consumption and the CO2 emissions from fossil fuel combustion in Cuba. The decomposition of energy consumption takes into account the major economic sectors, and identifies the activity effect, intensity effect, and structural effect to change in energy consumption in the years 1971-2019. The CO2 decomposition analysis identifies a larger number of effects by using an extended version of the Kaya identity but deals with the national aggregate level of the Cuban economy only.
Desarrollo
Decomposition analysis
Energy decomposition
Several methods have been developed for index decomposition analysis (IDA), of changes over time in the energy sector [6, 7, 8, 9, 10, 11, 12]. Typically, energy-related decomposition focuses onchanges in energy consumption, energy intensity, or CO2 emissions, and takes changes in different sectors of the economy into account by applying index numbers such as Paasche, Laspeyres, Fisher, and Divisia indexes. Decomposition analysis divides the observed change into a number of effects, which may either increase or decrease energy consumption or CO2 emissions.Typically the effects include (i) activity effect, (ii) intensity effect, and (iii) structural effect. The structural effect usually refers to changes in the shares of different sectors in the total economic output, but in the CO2 decomposition analysis, it often refers also to the shares of different energy sources in the energy mix. This kind of methodology, of course, provides comprehensive results.
We have used a complete decomposition method based on the Laspeyres index developed by Sun [13, 14], and named as Sun-Shapley method by Ang [9], who observed that a Shapley decomposition method, introduced by Albrecht et al. [15], is similar to Sun’s method where a principle “jointly created, equally distributed” [13, 14] provides a complete decomposition without a residual term:
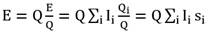
The energy intensity Ican be operationalised as. (See equation (1)).
 (1)
(1)
where E is energy consumption and Q is the economic output. Energy intensity defined different sectors (i) of the economy is.; See equation (2).in
 (2)
(2)
where
i |
is energy intensity in sector i |
E i |
is the energy consumption of sector i |
Q i |
is the economic output of sector i |
To decompose the energy use of an economy we can use the following equations (3):
 (3)
(3)
where the sum is taken over all sectors, and the structural factor of the economy, i.e. one sector’s share of the total production, is. See equation (4).
 (4)
(4)
In equation(3), the energy use is decomposed in relation to the structure of the economy. . Here we use a dynamic version of the Sun-Shapley method developed by Luukkanen and Kaivo-oja [16, 17, 18, 19], where the activity effect, intensity effect, and structural effect are calculated as follows: Se equations (5, 6, 7, 8)
 (5)
(5)
 (6)
(6)
 (7)
(7)
 (8)
(8)
In equations (5, 6, 7, 8), superscripts 0 and t refer to the base year and comparison year values of the corresponding variable and Δ refers to change during the studied period, i.e. difference between the comparison year t and the base year 0 values, in this case, the base year is 1971 and the comparison years cover the period 1971-2019 starting before the oil crisis and ending at almost the present day.
The activity effect Q effect (equation 6),describeshow total economic growth changessectoral energy use. It does not directly depend on the sector’s own production. The intensity effect I effect (equation 7),describeshow technological change and change inthe production system change sectoral energy consumption. The structural effect S effect (equation 8), describes how changes in the sectoral share of total production change total energy consumption. All these three effect analyses provide interesting and vital information for decision-makers.
A major strength of the Sun-Shapley method is its perfect value-robustness, i.e. the method can handle all input data without data modifications that are needed for zero and negative values e.g. in the logarithmic mean Divisia index method [22, 23]. This methodological character of Sun-Shapley method is very valuable in times when dramatic negative changes are possible as we have noted during the global Covid19-crisis. This is important, especially in the short-period analysis and the analysis of CO2 emissions, where negative are common. De Boer and Rodrigues [24], do not recommend using LMDI if the input data includes a lot of negative values. On the other hand, the Sun-Shapley method is not as applicable and flexible as the LMDI methods, if there is a need to analyse a larger number of variables and structural effects. Both methodological approaches have their advantages and disadvantages.
CO2 decomposition
We have carried out the so-called chained two-factor decomposition to analyse the drivers affecting CO2 emissions in Cuba. In this analysis we use an extended version of the original Kaya identity [25], to identify the major drivers of CO2 emissions [26, 27]: See equation (9).
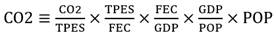 (9)
(9)
where
CO2 |
is carbon dioxide emissions from fuel combustion |
TPES |
is total primary energy supply |
FEC |
is final energy consumption |
GDP |
is the gross domestic product in real prices |
POP |
is the amount of population |
Equation (9), identifies the major drivers of change in CO2 emissions. The effect of CO2/TPES indicates the change in the shares of different energy sources in the primary energy mix and their impact on CO2 emissions. For instance, a shift from fossil fuels to renewables or from oil to natural gas decreases this effect.The effect of TPES/FEC describes the change in the energy efficiency of the conversion process from primary to final energy, such as electricity production fromcoal, natural gas, and other primary energy sources. If the energy conversion efficiency improves, this effect decreases. Because some energy sources such as hydro, wind, solar, or nuclear, are difficult to measure in primary energy terms, energy statistics apply conversion factors when calculating the primary energy from the produced energy carrier (usually electricity). IEA energy statistics use a conversion factor of 1 for hydro, wind, and solar electricity, and a conversion factor of 3 for nuclear electricity. For this reason, a shift from other energy sources to nuclear in electricity production can increase the effect of TPES/FEC, while a shift to hydro, wind, or solar decreases it. Therefore, the effect of TPES/FEC also depends on the change in the use of different energy carriers (electricity, heat, and combustible fuels).These facts are good to remember when interpreting the results of energy decomposition analyses.
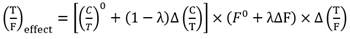
The effect of FEC/GDP comes from the changein the energy intensity of production - how much energy is needed for producing one unit of economic output. If energy intensity decreases, this effect decreases. Improvement in energy efficiency at the end-use level decreases this effect. The effect of GDP/POP comes from the change in the economic output per capita, and the effect of POP comes from the change in the amount of population. Increases in GDP and POP increase energy use and hereby CO2 emissions.In the following equations (10, 11, 12, 13, 14, 15, 16, 17), variable C is CO2, G is GDP, P is POP, F is FEC, and T is TPES. A base year value has a superscript 0 and Δ refers to change, i.e. the difference between comparison year t and base year 0 values (e.g. ΔC = C t -C 0 ).
The parameter λ determines the allocation of a joint effect to the factors in each of the chained decompositions. In the empirical analysis, the value λ = 0.5 is used systematically following the “jointly created, equally distributed” principle defined by Sun [13, 14]. The decomposition is complete with all choices of λ values (0 ≤ λ ≤ 1). However, each choice slightly affects the size of decomposed effects.
The analysis starts with decomposing C into the effects of factors C/T and T: See equations (10, 11)
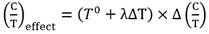 (10)
(10)
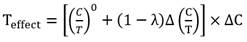 (11)
(11)
Then, the Teffect is further decomposed into the effects of T/F and F by chaining a new variable F: See equations (12, 13)
 (12)
(12)
 (13)
(13)
Next, a new variable G will be added to decompose the Feffect into the effects of F/G and G: See equations (14, 15)
 (14)
(14)
 (15)
(15)
And finally, by adding a new variable P the Geffect will be decomposed into the effects of G/P and P: See equations (16, 17)
 (16)
(16)
 (17)
(17)
To summarise, the effects of CO2 emission drivers identified in the extended Kaya identity (Eq. 9) are thus calculated in the chain of equations (10, 12, 14, 16), and 17), above.
We have taken all energy and CO2 data from the International Energy Agency database [28], and the economic and population data from the United Nations database [29]. In the following results section, changes in the different decomposed components are compared to the base year value, which is in this case 1971 (the first year of the data in the IEA statistics for Cuba). The results from energy decomposition are presented in kilotonnes of oil equivalent (ktoe) from the base year 1971 energy use value, and the results from CO2 decomposition are presented in percentage change from the base year 1971 CO2 emission value. In section 3, we shall present the main results and findings of the analyses.
Results
Energy decomposition
We have analysed the different sectoral effects on Cuban energy consumption for the period of 1971-2019 using the sectoral energy data taken from the IEA statistics [28], and sectoral economic performance data taken from the UN statistics [29], for a Sun-Shapley index decomposition analysis. Figure 1, shows the total and sectoral energy consumption from 1971 ro 2019 in Cuba, which will be decomposed into the activity effect, intensity effect, and structural effect. Figure 2 (a-c), illustrates the activity effect, intensity effect, and structural effect on Cuban energy consumption in the major economic sectors compared to the base year 1971. The activity effect illustrated in figure 2 (a), is the largest in the industrial sector,which indicates its central role in energy consumption. In the activity effect, we can see the major periods of change in the Cuban economy, i.e. the recession of the early 1990s after the collapse of the Soviet Union.
The intensity effect on energy consumption in different economic sectors in Cuba is illustrated in figure 2 (b), compared to the base year 1971. Energy intensity in the Cuban industry has decreased considerably and significantly reduce dindustrial energy use. Energy efficiency (reduction in energy intensity) has improved also in the transport and communication sector. In the commercial service sector and agriculture, the intensity effect has not reduced energy consumption, which indicates that these sectors have not been able to reduce their energy consumption in relation to the value of their economic output.This critical result should be taken seriously into account in energy policy decision-making in Cuba.
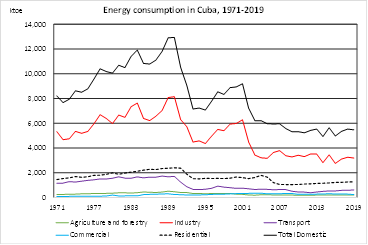
Data source: IEA [28]
Fig. 1 Energy consumption in Cuba 1971-2019 (ktoe) in total and in different economic sectors.
The structural effect on energy consumption in different sectors in Cuba is shown in figure2(c),compared to the base year 1971. Structural changes in Cuba before 1990 were very small and for that reason, the impact on energy use 1971-1990 was small as well. After the collapse of the Soviet Union, the structural changes in the Cuban economy have been considerable impacting also the energy use.
The role of the industry has reduced in Cuban economic output remarkable after 1996, and this has reduced industrial energy use very fast. The transportation and communication sector has increased its impact on the economy, which results in an increase in energy consumption. In the commercial (service) sector, there is a slight increase in the share of economic output and hence a slight increasing impact on energy use. The agricultural sector has decreased in economic importance and the structural effect on energy use can be seen asa reduction in energy use, especially in the early 2000s.Figure 2 (d), shows the change in the sectoral energy consumption as a sum of the decomposed effects.
CO2 decomposition
Figure 3, shows the carbon dioxide emissions from fuel combustion (CO2) in Cuba during the years 1971-2019. in the following, change in CO2 emissions will be decomposed into the effects identified in the extended Kaya identity (equation 2), i.e. change in the carbon intensity of primary energy (CO2/TPES), the efficiency of energy conversion from primary to final energy (TPES/FEC), the energy intensity of economic production (FEC/GDP), economic production per capita (GDP/POP), and amount of the population (POP). The results from the chained two-factor Sun-Shapley index decomposition analysis are presented in figure 4 and summarised in figure 5.
Figure 4 (c), shows the impact of change in energy intensity (FEC/GDP) on CO2 emissions in Cuba. This factor defines how much energy is needed for producingone unit of value-added (GDP) in the economy. This factor has been reducing significantly, indicating that the production system has become much more efficient in its energy use for producing economic output.
Reasons behind this positive development include the use of more efficient technology and structural change in the economy, i.e. a shift from energy-intensive production (especially in the industrial sector) to lighter production, and a shift from other sectors tonew branches of the service sector. Figure4 (d), shows the impact of changes in GDP per capita (GDP/POP) on CO2 emissions in Cuba. Here we see the impact of aGDP reduction during the “special period” and the considerably fast growth starting from 1994. Figure 4 (e), shows that population growth has had a modest increasingeffect on CO2 emissions in Cuba.
The total change in CO2 emissions in Cuba compared to the 1971 level as a sum of the different factors presented above is shown in figure 4 (f). Since the scales in figure 4 (a-f), are not the same, the effects of different factors on CO2 change are presented in a common scale in figure 5, to describe better their relative importance. A comparison of the different factors shows the importance of the improvement of energy efficiency (effect of FEC/GDP) in reducing CO2 emissions and the role of economic growth (effect of GDP/POP) in increasing emissions. During the analysed period, changes in the use of different primary energy sources (indicated by the effect of CO2/TPES) or energy transformation technology (indicated by the effect of TPES/FEC) have not had a very large impact on emissions. The planned shift to renewable energy sources will naturally in the future impact the CO2/TPES and TPES/FEC relation when implemented.
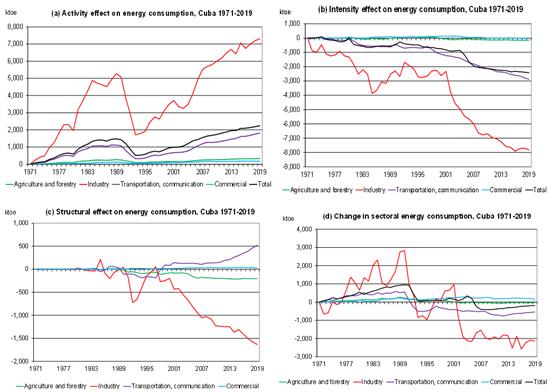
Fig. 2 The activity effect (a), intensity effect (b), and structural effect (c) on energy consumption in different sectors of the economy, and the total change in energy consumption (d) in Cuba 1971-2019. Data sources: IEA [28]; UN [29]
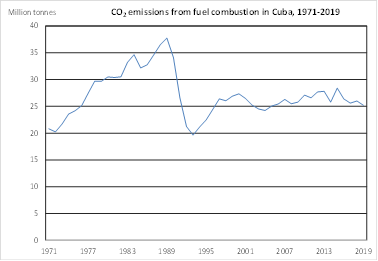
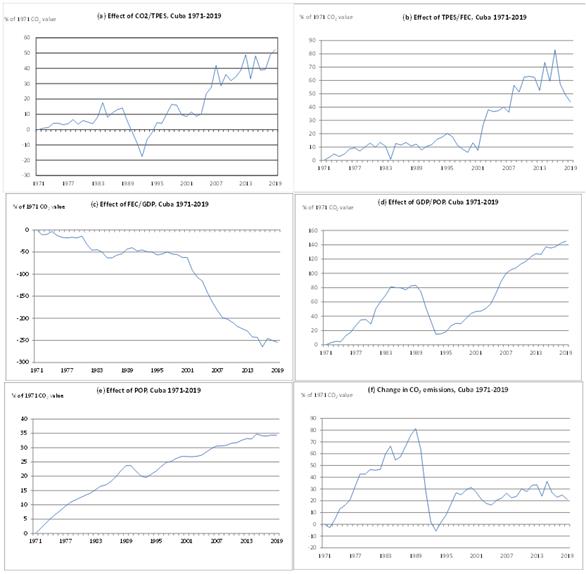
Fig. 4 Impact of the extended Kaya identity factors CO2/TPES (a), TPES/FEC (b), FEC/GDP (c), GDP/POP (d), and POP (e) on change in CO2 emissions in Cuba 1971-2019 (f), as a percentage from the base year 1971 CO2 value. Data sources: IEA [28], UN [29]
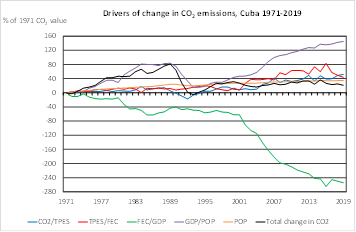
Fig. 5 Impact of the extended Kaya identity factors on CO2 emissions in Cuba compared to the base year 1971. Data sources: IEA [28], UN [29]
Improving the energy efficiency of production processes will not only reduce their energy intensity but also financially benefit firms and households by cutting resource use. In regular economic activities, investments in higher energy efficiency processes will result in a return on investment. However, reducing the carbon intensity of energy production does not provide such benefits directly, but with time lags. Additional measures are therefore required to facilitate the introduction of energy carriers with lower carbon footprints unless they provide a cheaper alternative.The lack of inherent commercial drivers forms the essence of the challenges we face when attempting to decarbonize industry and the energy system.
Conclusions
In this article, we have studied the drivers of change in energy consumption and carbon dioxide (CO2) emissions from fuel combustion in Cuba during a period of almost 50 years, 1971-2019. The results of energy decomposition summarised in figure 2, show that decreasing energy intensity and structural change of the economy have decreased and the activity effect increased energy consumption in Cuba. The volume of these changes has been in the industrial sector, where energy consumption has been decreasing especially in the 2000s. In addition to industry, the intensity effect has decreased energy consumption also in the transportation and communications sector, but the activity effect and structural effect have increased it so that the energy consumption in the transport and communications sector has only slightly decreased during the studied period. It is therefore a massive challenge to decarbonize an energy system that is essentially based on fossil fuels.
The results of CO2 decomposition summarised in figure 5, show that decreasing energy intensity (FEC/GDP) is the only factor that has constantly decreased CO2 emissions in Cuba. GDP growth per capita (GDP/POP) has been the most significant factor in increasing CO2 emissions, and a slight increase in emissions due to population growth (POP) has been continuous when the effect is compared to the base year 1971 CO2 emission value. The other effects, i.e. change in the efficiency of primary energy conversion into energy carriers (TPES/FEC) have also increased CO2 emissions except for a short period in the early 1990s when the CO2 emissions temporarily decreased especially due to economic recession, but also carbon intensity of the primary energy mix (CO2/TPES) decreased at the same time.
The energy system efficiency in Cuba depends on further development in the intensity and structural effects (calculated in the energy decomposition analysis), well as in the efficiency of the energy conversion system (effect of TPES/FEC calculated in the CO2 decomposition analysis). From the point of view of the 100 % renewable energy system target in Cuba, reaching the target is easier if the amount of consumed energy decreases. Here the structural change of the economy towards a less energy-intensive structure and energy saving are in a key position, in addition to technical improvements in energy efficiency. In this study, methodologically we introduced Sun-Shapley decomposition analysis combined with the Kaya identity assessment. We kindly recommend this method for assessing energy and climate policy, as it also allows the assessment of negative changes.

