


 Custom services
 text in
  English (pdf)
 Article in xml format
 Article references
 Send this article by e-mail
 Cited by SciELO
  Similars in
SciELO
Similars in
SciELO 
 Permalink
INTRODUCTION
In recent years, buffalo cattle rearing shows accelerated growth in different regions of Europe, North, Central and South America. Their ability to adapt to different ecosystems, as well as the nutritional quality of their meat and dairy products, are some of the aspects that stimulate their expansion (Fraga et al. 2017). Currently, many countries develop genetic improvement programs, with the objective of increasing production yields and compensating the growing demand. Apparently the future is projected towards high production herds, similar to the existing models in specialized bovine cattle.
However, a prospective analysis of the feeding systems, initially conceived for this species, is necessary, since intensifying production would increase the risk of alterations in their health and reproduction (Espósito et al. 2014). An increase in the productive potential, as well as changes in the diet, generate transformations in the energy, protein, endocrine, mineral, vitamin and enzymatic metabolism, which are reflected in plasma concentrations of the intermediate compounds. According to Balarezo et al. (2016), the greatest variations occur during the early postpartum period, as a consequence of increases in milk production (production peak) and decrease in nutrient intake, which is a situation that generates an energy imbalance.
In bubaline species, there is insufficient information about the study of metabolic indicators in the current production systems in Cuba, mainly in early lactation. The objective of this study was to evaluate the performance of blood levels of glucose, cholesterol, triglycerides, total proteins and urea during the first eight postpartum weeks.
MATERIALS AND METHODS
Location, animals and study stage. The study was carried out in the bubaline experimental unit "Genético 1", belonging to the Institute of Animal Science of the Republic of Cuba. An amount of 30 multiparous water buffaloes was used. This study was conducted in October and November 2016. The average rainfall during the period was 93.65 mm, while average temperature and relative humidity were 23.1 ° C and 78 %, respectively.
Management and feeding. The production system was semi-intensive, with paddock rotation and a stocking rate of 1.0 LAU hectare-1. The milking was manual, once a day, from 04:00 to 06:00 am, without food offer and with offspring stimulation. Mean milk production was 5.2 kg / animal / d. Feeding was exclusively based on natural and improved pastures, with predominance of star grass (Cynodum nlenfuensis) and Cenchrus purpureus cv. CT-115 (table 1). No irrigation or fertilization was applied during the experimentation period. Pasture availability, during the study period, was 17.0 kg DM. buffalo-1, covering the requirements of dry matter to 80%, according to the in situ calculated grass use. A 70.0% of utilization was considered for a buffalo of 500Kg, with a demand of 3% of its live weight.
Table 1 Bromatological composition of Cenchrus purpureus cv. CT-115 and star grass (% of DM)
| CP | ADF | NDF | Lig | Cel | Ca | P | Ash | |
|---|---|---|---|---|---|---|---|---|
| Cenchrus CT-115 | 5.37 | 46.3 | 67.3 | 4.3 | 38.4 | 0.43 | 0.19 | 9.3 |
| Star grass | 6.25 | 32.2 | 60.5 | 4.2 | 31.6 | 0.26 | 0.17 | 10.4 |
Experimental design, processing and analysis of samples. From the first and to the eighth postpartum week, 10 mL of blood from the jugular vein was extracted from each animal and with a frequency of seven days. Vacuum test tubes without anti-coagulant (Vacutainer®, Becton-Dickinson, Franklin Lakes, NJ, USA) were used, which were transported in refrigeration to the laboratory, where they were centrifuged at 3,000 revolutions per minute (rpm) for 15 minutes to obtain the serum. The biochemical analyzes were carried out by the enzymatic colorimetric method, with the use of commercial kits (Kovalent Biosys ®) for glucose (GOD-PAP), cholesterol (CHOD-PAP), triglycerides (GPO-POD), urea (UV urea) and total proteins (Biuret method). Determination of metabolites concentrations was performed by absorption spectrophotometry with visible light (Stardust MC 15 semiautomatic spectrophotometer).
Statistical analysis. A generalized mixed linear model was used with the GLIMMIX procedure (Wolfinger and O Connell 1993). For all the analyzed data, the link function dist = gamma and link = log was used, since all the tested distributions rejected the Normality test (Shapiro-Wilk, Kramer von Mises, Kolgomorov-Smirnov and Anderson-Darling) and had a better fit to the gamma distribution through the Severity procedure of the statistical package used (SAS 2007 version 9.1.3). Means were compared with Kramer (1956) test for the evaluated variables. The factors studied through the model were: number of parturitions (3 ..., 8), weeks (1 ..., 8) and fitting by covariance to daily milk production (60 days).
Model
Where:
µ |
- constant common to all observations |
αi |
- fix effect of the i-th postpartum week i = 1, 2...8 |
γj |
- fix effect of the j-th number of parturition j = 3, 4…8 |
φk |
- fix effect of daily milk production in the k-th day k=1, 2…60 |
Xk |
- mean of the variable postpartum daily milk production (60 days) |
βk |
- effect of the covariable daily milk production on the evaluated variable |
a |
- random effect of the l-th animal l=1, 2...30 |
eijk |
- residual, normal and independently distributed error (0, σe2) |
RESULTS AND DISCUSSION
Postpartum weeks showed a significant effect (P <.0001) on the performance of studied serum indicators (table 2). However, the number of parturitions and milk production, during the first 60 days of lactation, did not show similar performance. The use of multiparous buffaloes could influence on the results of this research, since primiparous animals require a greater nutrient demand to complete their growth and maintain milk production, which generates a Negative Energy Balance (BEN), and, as a consequence, greater losses of body condition (BC) and intermediary metabolism imbalance (Quinte la et al. 2011).
Table 2 Effect of number of parturitions, weeks and milk production on the performance of metabolic indicators
| VS | gl | Significance | ||||
|---|---|---|---|---|---|---|
| Glucose | Cholesterol | Triglycerides | Total Protein | Urea | ||
| NP | 4 | 0.0841 | 0.613 | 0.4631 | 0.2566 | 0.3652 |
| SEM | 7 | <.0001 | <.0001 | <.0001 | <.0001 | <.0001 |
| MP 60 | 1 | 0.84 | 0.3900 | 0.9586 | 0.9586 | 0.3010 |
VS: variation source, NP: number of parturitions, SEM: weeks and MP 60: milk production in the first 60 days of lactation
Glycemia dynamics during the first eight postpartum weeks (figure 1) is similar to the performance observed in the lactation curves described by authors in buffalo herds from Venezuela, Colombia and Cuba (Montiel et al. 2000; Vélez et al. 2010 and García et al. 2012). Similarly, the highest glucose concentrations in the present study coincide with the peak of milk production for this species (Suárez and Ramos, 2011 and Fraga et al. 2017). However, once the weeks of highest milk production (weeks 5 and 6) have passed, a significant decrease of blood glucose concentrations is observed. Similar values to this research were obtained by Hagawane et al. (2009), in female water buffaloes during the initial (2.08 ± 0.19 mmol / L) and medium (3.02 ± 0.35 mmol / L) stage of lactation.
 () Values retransformed in mmol/La, b, c Means with different superscripts differ according to Kramer (1956)
Figure 1 Glucose concentration in blood during the eight first postpartum weeks
However, Khan et al. (2011) found no differences during the first sixty days after parturition. By contrast, in dairy cows, it is confirmed that most research reports the lowest glucose concentrations during the first five weeks after parturition (Santini et al. 2009, Galvis et al. 2013 and Gallego et al. 2017). This suggests that milk production would be one of the factors responsible for the decrease of glucose values, presumably as a consequence of the greater demand for nutrients that the mammary gland imposes on the organism to satisfy production levels.
Although most studies on metabolic profile during the early postpartum period are found in dairy cows, it is possible that the performance of buffaloes in this study would also be justified by the low productive levels of the herd. Another analysis that could explain the dynamics and concentration of glycemia is the high fat percentage that buffalo milk contains, compared to dairy cattle. This situation generates greater metabolic activity of adipose tissue (lipolysis) and, in consequence, an increase in gluconeogenic precursors such as glycerol for glucose synthesis. However, further studies are required for deepening in these aspects, because it is known that this precursor, in dairy cows, only contributes between five and ten percent of blood glucose (Galvis and Cardona. 2002).
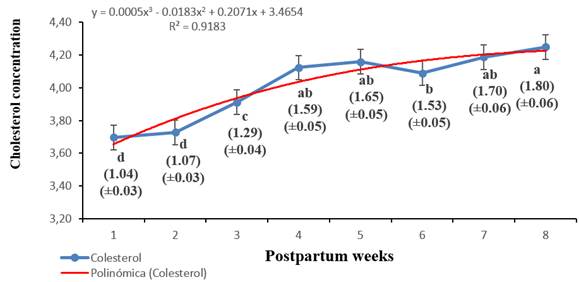
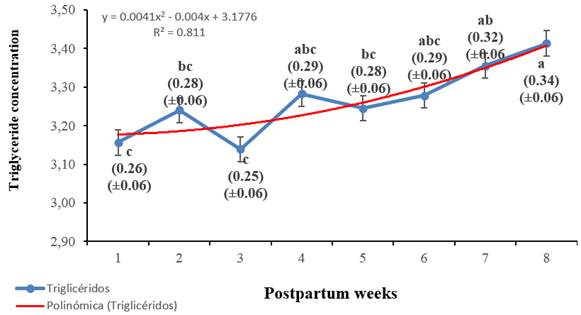
Total cholesterol and triglycerides concentrations (figure 2 and 3) showed continuous increase (P<.0001) during the first eight postpartum weeks. Hagawane et al. (2009) observed a similar performance of total cholesterol from the early (3.66 ± 0.94 mmol/L) to the medium (11.8 ± 1.94 mmol / L) stage of lactation. Similarly, Monteiro et al. (2012) also reported an increase of triglycerides as the days of lactation, in Mehsana female buffaloes, progressed.
 () Values retransformed in mmol/La, b, c, d Means with different superscripts differ according to Kramer (1956)
Figure 2 Total cholesterol concentration in blood during the first eight postpartum weeks
 () Values retransformed in mmol/La, b, c Means with different superscripts differ according to Kramer (1956)
Figure 3 Triglyceride concentration in blood during the first eight postpartum weeks
The tendency to increase both metabolites can be attributed to the need for energy and lipid substrates once lactation begins. For example, Kessler et al. (2014) reported that triglycerides are used by the mammary gland to form milk fats, and their need increases during the first postpartum weeks. Unlike bovine cattle, the high fat percentage present in bubaline milk may justify the continuous increase in lipid concentrations during the first months after parturition.
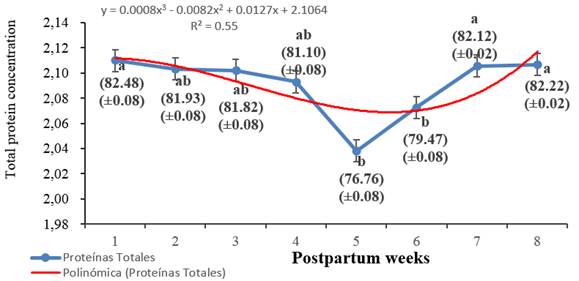
The lower values of total proteins in blood coincide with the peak of milk production for this species (figure 4). This performance could be due fundamentally to the relationship between the period of greatest nutrient demand for dairy synthesis and a limited protein and energy contribution of pastures consumed by the animals (table 1). Similar results were reported by Cardentey et al. (2008), who observed that the lowest concentrations (P <0.01) of serum proteins (47.2 ± 2.6 g / L) corresponded to animals with the highest milk production. Serdura et al. (2011) also found a significantly lower proteinemia in lactating female buffaloes (73.0 ± 9.5 g / L), when compared with pregnant animals (55.3 ± 2.53 g / L). However, Yotov et al. (2013) did not find similar performance in Murrah buffalo during the initial postpartum stage (28 days). This situation could be fundamentally justified by the productive level, pre and postpartum body condition, the diet used and / or the percentage of protein and energy foods included in the ration. For example, Piccione et al. (2012) point out that diets with high levels of starch (concentrates) generate higher production of propionic acid in the rumen and, in consequence, of microbial protein, which is reflected in an increase in blood proteins.
 () Values retransformed in mmol/La, b, c Means with different superscripts differ according to Kramer (1956)
Figure 4 Total protein concentration in blood during the first eight postpartum weeks in female water buffaloes
Other authors (Cozzi et al. 2011) pointed out that the decrease of total protein concentration, during the first postpartum days, is also due to the transfer of globulins for the synthesis of colostrum in the mammary gland, and/or decrease of the capacity for protein synthesis in the liver, mainly due to the accumulation of fatty acids from adipose tissue during BEN.
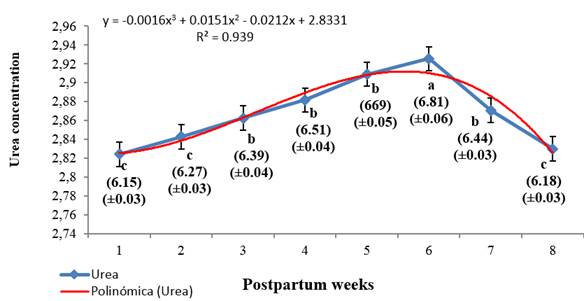
There was a significant increase in blood urea concentrations during the first six weeks after parturition (figure 5). In Mediterranean buffalos, Verdurico (2015) also found the highest (P <0.001) concentrations of blood urea between the fourth and eighth week of lactation (5.04 mmol / L), comparing it 21 days before parturition (3.0 mmol/L) and during the parturition (3.58 mmol / L). Similarly, recent research in this same species corroborates the influence of the lactation stage on blood urea concentration (Das et al. 2017).
 () Values retransformed in mmol/La, b, c Means with different superscripts differ according to Kramer (1956)
Figure 5 Blood urea concentration during the first eight postpartum weeks in female water buffaloes
The performance of this metabolite could be caused by the gradual increase of degradation of tissue proteins, as a consequence of a state of undernourishment. All this involves, in addition to adipose tissue, the use of amino acids as an important source of carbon for glucose formation (glucogenic amino acids), an essential substrate for lactose synthesis in the mammary gland. This analysis is based on the evidence from studies of Noro and Wittwer (2012), who demonstrated that gluconeogenesis rate from alanine is more than double in lactating animals, compared during prepartum period. Likewise, Galvis et al. (2013) observed a positive and significant correlation among blood urea concentrations, milk production and gluconeogenic activity, the latter evaluated from the hepatic enzyme phosphoenolpyruvate carboxykinase (PEPCK).
It is concluded that, during the first eight weeks after parturition, there are variations in the concentrations of some of the indicators of energy and protein metabolism in female water buffaloes, mainly due to the mobilization of body reserves, as a consequence of the gradual increase of milk production and nutritional requirements. Under current feeding and management conditions, energy and protein availability are limited, which are aspects that should be considered in the future. It is also recommended to study other physiological stages within the productive cycle and include a higher number of blood indicators. These can provide more information and responses to the performance of intermediary metabolism in dairy female water buffaloes, with respect to other species of domestic animals.

